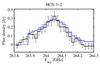
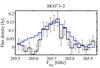
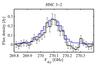
Fig. A.2
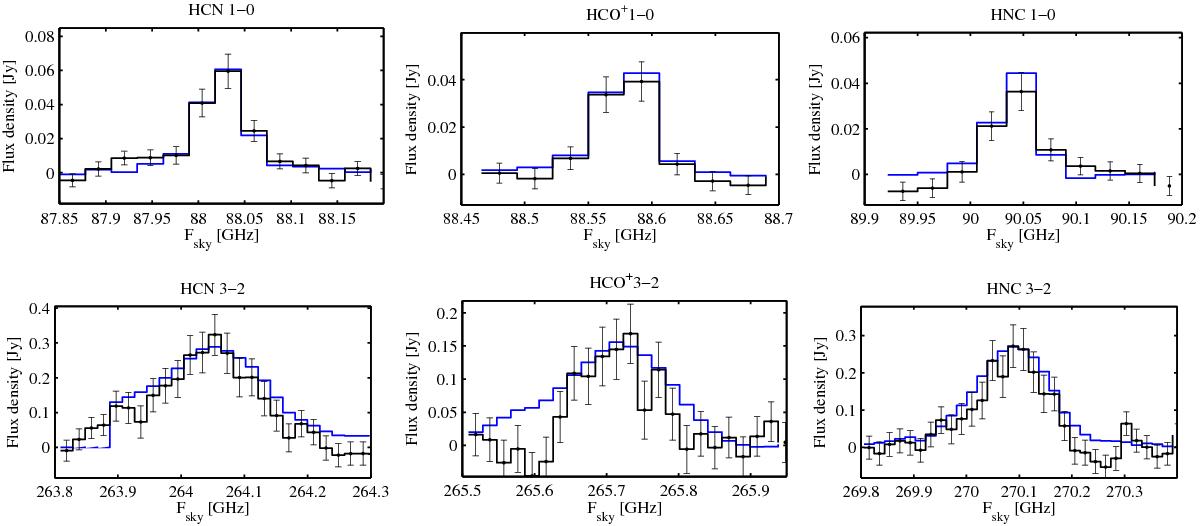
Comparison of our ALMA data with single-dish spectra of the brightest lines in the scan. The blue line shows the spectrum extracted from the ALMA visibilities by fitting a point source with the CASA routine uvmultifit. The black line shows single dish spectra observed by the authors with the IRAM 30 m telescope. The error bars show the squared sum of the rms of the two datasets. The spectra were interpolated to a common resolution of 28 and 19.5 MHz at 3 and 1 mm, respectively.
Current usage metrics show cumulative count of Article Views (full-text article views including HTML views, PDF and ePub downloads, according to the available data) and Abstracts Views on Vision4Press platform.
Data correspond to usage on the plateform after 2015. The current usage metrics is available 48-96 hours after online publication and is updated daily on week days.
Initial download of the metrics may take a while.