Fig. A.3
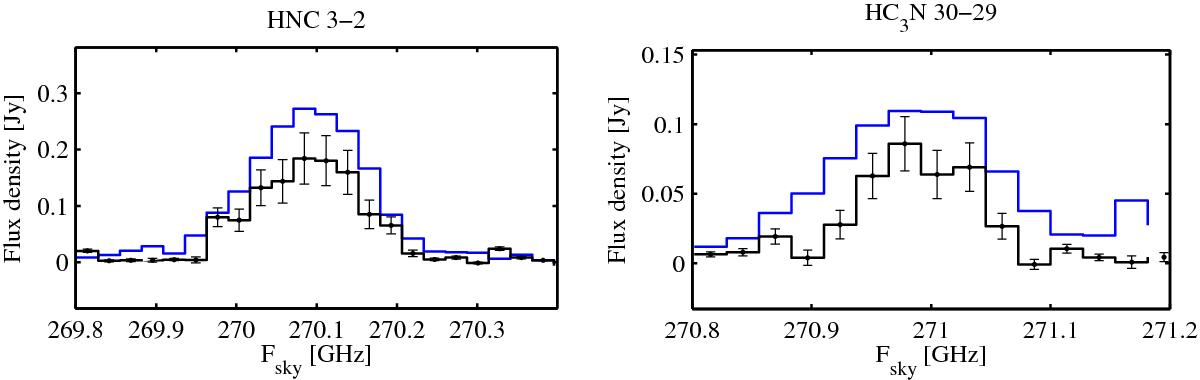
Comparison of our ALMA data with SMA observations by Costagliola et al. (2013). The blue line shows the spectrum extracted from the ALMA visibilities by fitting a point source with the CASA routine uvmultifit. The black line shows the flux density measured by the extended configuration of the SMA, with a beam size of 0.̋4 and a maximum recoverable scale of 2′′. The error bars show the squared sum of the rms of the two datasets. The spectra were interpolated to the resolution of the ALMA spectral scan.
Current usage metrics show cumulative count of Article Views (full-text article views including HTML views, PDF and ePub downloads, according to the available data) and Abstracts Views on Vision4Press platform.
Data correspond to usage on the plateform after 2015. The current usage metrics is available 48-96 hours after online publication and is updated daily on week days.
Initial download of the metrics may take a while.