| Issue |
A&A
Volume 582, October 2015
|
|
|---|---|---|
| Article Number | A7 | |
| Number of page(s) | 12 | |
| Section | Cosmology (including clusters of galaxies) | |
| DOI | https://doi.org/10.1051/0004-6361/201525623 | |
| Published online | 29 September 2015 | |
Near-infrared radiation background, gravitational wave background, and star formation rate of Pop III and Pop II during cosmic reionization
1 School of Astronomy and Space Science, Nanjing University, 210093 Nanjing, PR China
e-mail: fayinwang@nju.edu.cn
2 Key Laboratory of Modern Astronomy and Astrophysics (Nanjing University), Ministry of Education, 210093 Nanjing, PR China
Received: 7 January 2015
Accepted: 29 July 2015
Context. The transition from Population III (Pop III) to Population II (Pop II) stars plays an important role in the history of the Universe. The huge amount of ionizing photons generated by Pop III stars begin to ionize the intergalactic medium (IGM) at the early stage of reionization. Meanwhile, the feedback from reionization and metal enrichment changes the evolution of different populations. The near-infrared radiation background (NIRB) and the stochastic background of gravitational waves (SBGWs) from these early stars will provide important information about the transition form Pop III to Pop II stars.
Aims. We obtain the NIRB and SBGWs from the early stars, which are constrained by the observation of reionization and star formation rate (SFR).
Methods. We studied the transition from Pop III to Pop II stars via the star formation model of different populations, which takes into account the reionization and the metal enrichment evolution. We calculated the two main metal pollution channels arising from the supernova-driven protogalactic outflows and genetic channel. We obtained the SFRs of Pop III and Pop II and their NIRB and SBGWs radiation.
Results. We predict that the upper limit of metallicity in metal-enriched IGM (the galaxies that are polluted via the genetic channel) reaches Zcrit = 10-3.5 Z⊙ at z ~ 13 (z ~ 11), which is consistent with our star formation model. We constrain the SFR of Pop III stars from reionization observations. The peak intensity of NIRB is about 0.03 − 0.2 nWm-2 sr-1 at ~1 μm for z> 6. The predicted NIRB signal is consistent with the metallicity evolution. We also obtain the gravitational wave background from the black holes formed by these early stars. The predicted gravitational wave background has a peak amplitude of ΩGW ≃ 8 × 10⁻⁹ at ν = 158 Hz for Pop II star remnants. However, the background generated by Pop III.2 stars is much lower than that of Pop II stars, with a peak amplitude of ΩGW ≃ 1.2 × 10⁻¹¹ at ν = 28 Hz. The background of Pop III.1 shifts to lower frequencies, and the amplitude of ΩGW for Pop III.1 stars shows a minimum value at ν ≃ 10 Hz that is due to the lack of gravitational wave signals from stars with 140 M⊙<M∗< 260 M⊙.
Key words: cosmology: theory / diffuse radiation / gravitational waves
© ESO, 2015
1. Introduction
The first stars, known as Population III (Pop III), formed at the end of the cosmic dark age and began the reionization era. Pop III stars can have characteristics different from Pop I/II stars. Some authors have stated that Pop III can be very massive, on the order of 500 − 600 M⊙ (Abel et al. 2002; Omukai & Palla 2001, 2003; Bromm & Loeb 2004), while others have claimed that the masses are lower, on the order of 30 − 60 M⊙ or 10 M⊙ (Hosokawa et al. 2011, 2012; Stacy et al. 2012). The initial conditions for Pop III star formation are entirely determined by basic cosmology parameters (Tegmark et al. 1997; Yoshida et al. 2003; Bromm et al. 2009). According to the popular “bottom-up” hierarchical structure formation in the standard cold dark matter (CDM) model, the first stars formed in a sufficient amount of cold dense gas in a dark matter halo with mass ≳106 ~ 108 M⊙, which collapsed at redshift z ~ 20 − 30 (Bromm et al. 1999, 2002; Abel et al. 2002). At first, these stars contained no elements heavier than helium, viz., they were metal free, the so-called Pop III.1. The second generations of stars originated from the environment influenced by earlier star formation, defined as Pop III.2, which exist in a preionized region and are affected by previous generations of stellar radiation that is due to photoionization of ambient neutral hydrogen of Pop III.1 stars. Supernova (SN) explosions and stellar winds introduced heavier elements into the intergalactic medium (IGM), gradually increasing its metallicity. On the other hand, some new galaxies inherited the metals from their low-mass progenitors. After the metal-element enriching to a certain threshold Zcrit, the Pop I/II stars formed (Bromm et al. 2001; Bromm & Loeb 2003; Schneider et al. 2002, 2006a; Mackey et al. 2003).
Pop III stars have not been observed directly. Fortunately, there are some observations to constrain the early stellar population and reionization, such as the near-infrared radiation background (NIRB), Gunn-Peterson trough (Fan et al. 2006), and the stochastic background of gravitational waves (SBGWs; Marassi et al. 2009; Pereira & Miranda 2010). The NIRB contains some important information about the early Universe, which arises from accumulated emission from the early galaxy populations with a wide range of redshifts. Because photons lose energy in cosmic expansion, the optical and UV radiation from the early stars during reionization is expected to leave a signature in the extragalactic background light at NIR bands with a wavelength shorter than a few micrometers. Although most high-redshift galaxies are below the limiting magnitude of current detectors, we could observe their redshifted cumulative spectrum, which would be present in any background emission in the NIR band (Barkana & Loeb 2000; Salvaterra & Ferrara 2006; Wyithe & Loeb 2006; Kistler et al. 2009; Bouwens et al. 2010; Robertson et al. 2010; Fernandez & Shull 2011; Mũnoz & Loeb 2011). On the other hand, since Pop II galaxies at z ~ 6 are already observed with the Hubble Space Telescope (HST) and will shortly be studied in great detail with the James Webb Space Telescope (JWST), we can find many properties of the early stars by examining the NIRB intensity, such as the star formation rate (SFR) of high-redshift stars whose photons are redshifted, the clustering properties (by studying the anisotropy power spectrum of the NIRB), the classification of Pop III stars (by studying the number of the Lyman alpha bumps), the transition from Pop III to Pop II stars (by studying the evolution of Lyman bumps), the reionization and metal enrichment (which we discuss in this paper). However, determining the contribution of these early stars at high redshifts from observations is a hard task. There are two reasons: first, low-redshift and very faint galaxies contribute significantly to the NIRB, which is not measured accurately. Second, the extragalactic NIRB is hard to distinguish from the brighter zodiacal foregrounds in the local matter (e.g., interplanetary dust within the solar system), and the stars and the interstellar medium (ISM) of our Galaxy (Hauser & Dwek 2001; Kashlinsky 2005), which is two to three orders of magnitude larger than 10 nWm-2 sr-1. Recent works suggested that the NIRB intensity cannot be higher than a few tenths nWm-2 sr-1 (Kneiske et al. 2004; Stecker et al. 2006; Franceschini et al. 2008; Gilmore et al. 2009, 2012; Finke et al. 2010; Kneiske & Dole 2010; Inoue et al. 2013). Except for the mean intensity, the anisotropy power spectrum of the NIRB could provide direct information of these early stars (Cooray et al. 2004, 2012a; Kashlinsky et al. 2004; Fernandez et al. 2010). The Pop III epoch contains a lower projected volume than the ordinary galaxy populations (e.g., Pop II stars), leading to stronger relative fluctuations, and their anisotropy power spectrum represents the clustering behavior of sources in the IR regime. However, the angular power spectrum of ordinary galaxies (containing Pop II stars) is nearly a power law over a wide range of angular scales (Cooray et al. 2004, 2012a).
The UV photons ( ) produced at z = 9 during reionization are redshifted to the NIR band with wavelength λ ~ 1 μm. Thus the NIRB depends on the evolution of the early stars during reionization. So far, many works have obtained some information about reionization, for instance, the optical depth for electron scattering, the end of the reionization redshift, and the escape fraction of ionizing photons, which can be used to constrain the SFRs of the early stars (Yu et al. 2012; Wang 2013) and further constrain the intensity of the NIRB and SBGWs. Recently, many studies have calculated the contribution of stars and galaxies that is responsible for reionization and the NIRB (Kashlinsky et al. 2002, 2004, 2005, 2007a, 2012; Kashlinsky 2005; Santos et al. 2002; Salvaterra & Ferrara 2003; Cooray & Yoshida 2004; Cooray et al. 2004; Madau & Silk 2005; Magliocchetti et al. 2003; Fernandez & Komatsu 2006; Thompson et al. 2007a,b; Fernandez et al. 2010, 2012, 2013; Cooray et al. 2012a; Fernandez & Zaroubi 2013; Yue et al. 2013). As a crucial part of the entire story of the cosmic history, reionization reflects the transformation of neutral hydrogen in the IGM into an ionized state, which is due to ionizing photons generated by the early stars and galaxies. In the process of the early star formation, the IGM is enriched with metals that are dispersed by the first SNe and stellar winds. This process might reflect the evolution of the stellar populations, although it is not understood when the transition from Pop III to Pop II takes place because of an uncertainty in the critical metallicity Zcrit (Bromm et al. 2001; Jappsen et al. 2009a,b), the redshift evolution of the IGM metallicity (Barlow & Tytler 1998; Ferrara et al. 2000; Greif & Bromm 2006), and some other metal pollution channels, such as the genetic channel (Schneider et al. 2006b; Trenti & Stiavelli 2009). With more Pop II stars forming (although fewer ionizing photons per star), there are more ionizing photons to ionize the IGM, and the ionized bubbles gradually overlap, allowing the mean free path of ionizing photons to increase rapidly. The average volume fraction of ionized hydrogen in the IGM increases rapidly. Finally, the entire Universe is almost completely ionized (Barkana & Loeb 2001; Robertson et al. 2010; Bromm 2013).
We here consider two main channels of metal pollution: the supernova-driven protogalactic outflows (Ferrara et al. 2000; Furlanetto & Loeb 2005) and the genetic channel (Schneider et al. 2006b; Trenti & Stiavelli 2009). The former assumed that metals are enriched via supperbubbles resulting from supernova explosion in protogalaxies, and the latter suggested that the new galaxies inherit metals from the lower mass progenitor galaxies. Moreover, we constrain the SFR through the observations and reionization, for example, the optical depth for electron scattering as measured by WMAP and Planck, and the redshift of the end of reionization with a possible range from 5 to 10. During reionization, the metal elements enrich the IGM. Pop III.1 stars originate from a freshly collapsed halo, and Pop III.2 stars exist in a preionized metal-free region, and they form via hydrogen deuteride cooling. Pop II stars originate from the dark matter halos that have been polluted by metal enrichment. Thus the SFRs of these early stars would depend on the hydrogen reionization fraction and pristine fraction (Greif & Bromm 2006; Wang & Dai 2009; de Souza et al. 2011). Following Fernandez & Komatsu (2006), this NIRB consists of several contributions: the continuum emission from stars themselves, the series of recombination lines, the free-free and free-bound continuum emission from ionized gas or nebula, and the two-photon emission. Based on the constraint on the SFRs of the early stars, we can obtain the contribution of the first stars to the high-redshift NIRB during reionization, which is lower than the current observation (the total luminosity 1 ~ 10 nWm-2 sr-1) (Santos et al. 2002; Salvaterra & Ferrara 2003; Cooray & Yoshida 2004; Kneiske et al. 2004; Kashlinsky et al. 2005, 2007a, 2012; Stecker et al. 2006; Franceschini et al. 2008; Gilmore et al. 2009, 2012; Finke et al. 2010; Kneiske & Dole 2010; Inoue et al. 2013) due to the foreground pollution. On the other hand, as pointed out by Fernandez & Zaroubi (2013), the Lyman α emission from Pop III stars at high redshift could result in a bump in the spectrum of the NIRB. This shape of the Lyman α bump is determined by the transition from Pop III to Pop II stars.
In addition, these early stars are predicted to collapse into black holes (except in the mass range 140 − 260 M⊙, where they die as pair-instability supernova (PISN; Heger & Woosley 2002) and are expected to be the sources of the SBGWs (Schneider et al. 2000; Buonanno et al. 2005; Sandick et al. 2006; Suwa et al. 2007; Marassi et al. 2009; Pereira & Miranda 2010). Based on the SFRs, we calculate the SBGWs that were produced by these early stars, including Pop II, Pop III.2, and Pop III.1 stars. At present, some gravitational wave interferometers are operating in the frequency of 10 − 3000 Hz, for instance, VIRGO and the Laser Interferometer Gravitational-Wave Observatory (LIGO). In the future, next-generation gravitational wave detection will open a lower frequency window, for example, with the Laser Interferometer Space Antenna (LISA) covering the frequency range 10-4 − 0.1 Hz and the Big Bang Observer (BBO) operating in the range 0.01 − 10 Hz. The signals of gravitational waves will open a new window for studying the cosmic transition from Pop III to Pop II stars.
This paper is organized as follows. In Sect. 2 we outline the stellar models, including the properties of distinct populations and their SFRs during the era of reionization. In Sect. 3 we introduce our reionization model by considering the transition from Pop III to Pop II. In Sect. 4 we calculate the spectrum of the NIRB, which is contributed by the early stars before the end of reionization. In Sect. 5 the gravitational wave spectra produced by Pop III and Pop II stars are presented. In Sect. 6 we discuss our results and conclude. We assume a flat ΛCDM model with Ωm = 0.27, ΩΛ = 0.73, and H0 = 71 km s-1 Mpc-1 throughout.
2. Stellar models
In this section, we consider the emissions from early stars during reionization. Following Fernandez & Komatsu (2006), we calculate the emission from two stellar populations. First, Pop III stars can be divided into the first-generation stars (Pop III.1), whose formation only depends on the initial conditions of the early Universe, and the second-generation stars (Pop III.2), which exist in a preionized region and are affected by previous generations of stellar radiation that is due to photo-ionization of ambient neutral hydrogen of Pop III.1 stars. They form via hydrogen deuteride cooling (Johnson & Bromm 2006) with extremely poor metallicity Z ≲ 10-3.5 Z⊙. In the hydrogen deuteride cooling process, the gas temperature would reach that of the cosmic microwave background (CMB) within a Hubble time. When the gas temperature reaches the CMB limit, the Pop III.2 stars with typical masses ~40 M⊙ form, which are smaller than the typical mass of Pop III.1 stars. For simplification, we assumed that the Pop III.2 stars have a lower-mass distribution, but have the approximate properties of the Pop III.1 stars (Ohkubo et al. 2009), including the intrinsic bolometric luminosity, the effective temperature, the main-sequence lifetime, and the time-averaged hydrogen photoionization rate. Second, the Pop II stars, as metal-poor stars with metallicity Z = 1 / 50 Z⊙, form in clouds that can undergo metal and dust cooling. The clouds are able to fragment into lower masses, leading to typical masses lower than those of Pop III stars.
2.1. Pop III and Pop II
We adopted the same initial mass function (IMF) as Cooray et al. (2012a) for Pop III.1 and Pop II stars. The IMF of Pop III.1 stars is (Larson 1998)  (1)where
  , and the mass range is from 5 to 500 M⊙. For Pop II stars, we adopted the IMF given by Salpeter (1955)
 (2)with the mass range from 5 to 150 M⊙. Following Johnson & Bromm (2006), we used an intermediate stellar IMF between Pop III.1 and Pop II for Pop III.2 stars. We adopted the IMF given by Larson (1998) with
  , and the mass range is from 5 to 250 M⊙. Accordingly, the mean mass of Pop III.2 is ~40 M⊙, which is consistent with the typical mass given by Yoshida et al. (2007) and Hosokawa et al. (2011). The normalization is given by
  (3)The mean stellar mass of one population is
  (4)Here we used the results from Lejeune & Schaerer (2001) and Schaerer (2002) to calculate the main stellar parameters, such as the intrinsic bolometric luminosity
  , the effective temperature
  , the main-sequence lifetime τ∗(M∗), and the time-averaged hydrogen photoionization rate
  . First we define x = log 10(M∗/M⊙).
For Pop III stars (Pop III.1 and Pop III.2), the parameters are given by  (5)For Pop II stars, the parameters become
  (6)This stellar model gives the number of ionizing photons emitted per stellar baryon
  (7)where mp is the proton mass, Y = 0.25 is the mass fraction of helium, and τeff(M∗) is the effective stellar lifetime, given by Eq. (51) in Sect. 4. The effective stellar lifetime τeff may be shorter than the real lifetime τ∗ because some low-mass stars are not dead yet.
2.2. Star formation rate
Following Greif & Bromm (2006), we considered that the Pop III.1 stars form in the minihalos with a minimum virial temperature Tvir ≈ 103 K. Pop III.2 stars form in metal-free halos above Tvir = 104 K via HD cooling. When star formation begins, a sufficient amount of cold dense gas accumulating in a dark matter halo is needed. Because of the collapse of the dark matter halos, the baryonic gas is in viral equilibrium with the dynamically dominant dark matter halos,  (8)where Mh is the dark matter halo mass, Rvir is the virial radius, and υvir is the virial velocity. The virial radius is (Barkana & Loeb 2001; Bromm 2013)
  (9)where Δc = ρvir/ρb is the overdensity after virialization is nearly complete, ρvir is the virial density of dark matter halos, ρb = Ωbρcr is the baryon mass density of the Universe, and Δc ≈ 18π2 in the Einstein–de Sitter model. The gas heats up as a result from the collapse of the dark matter halo, in which the virial temperature of the gas corresponds to the virial velocity of dark matter halos. Therefore
  , which leads to
  (10)where μ = 1.2,0.6 is the mean molecular weight for neutral and ionized primordial gas, respectively. For a dark matter halo with mass of 106 M⊙, the virial temperature in this minihalo is ~103 K, which is below the threshold ~104 K of the cooling temperature of atomic hydrogen, so that the gas is unable to cool, with the result that there is no star formation. The gas would simply remain in hydrostatic equilibrium. However, the cooling in such a low-temperature primordial gas could instead rely on molecular hydrogen (H2). The main formation channel is the sequence H + e−→ H− + γ, followed by H− + H → H2 + e− (Bromm 2013). Finally, the evolution of gas inside minihalos, driven by H2 cooling, leads to the formation of Pop III.1 stars with typical masses ~100 M⊙. After the Pop III.1 star formation, the composition of the primordial gas becomes different, and the cooling process would be more complicated. The hydrogen deuteride (HD) molecule provides an additional cooling channel. For such a dark matter halo with mass of ≳108 M⊙, the cooling of HD would be efficient with a temperature of ~104 K, leading to the formation of Pop III.2 with typical masses of ~40 M⊙.
To obtain the SFRs of the early stars, we considered a semi-analytic approach by using the collapse fraction function of a dark matter halo. The famous one is the Press–Schechter formalism, providing a way to calculate the abundance of the mass of dark matter halos (Press & Schechter 1974). For a given power spectrum  , we adopted the matter power of Komatsu et al. (2009). The Gaussian variance of the fluctuations on the mass-scale Mh is
  (11)where
  and W(k,Rh) is a top-hat filter function
 ![\begin{eqnarray} W=\frac{3}{\left(k R_{\rm h}\right) ^{3}}\left[ \sin \left( k R_{\rm h}\right) -\left( k R_{\rm h}\right) \cos \left( k R_{\rm h}\right) \right] . \end{eqnarray}](/articles/aa/full_html/2015/10/aa25623-15/aa25623-15-eq93.png) (12)The comoving number density of dark matter halos per unit mass is given by the Press & Schechter (1974) formalism
(12)The comoving number density of dark matter halos per unit mass is given by the Press & Schechter (1974) formalism  (13)where the critical density of the Universe is ρcr = 1.8785 × 10⁻²⁹h2g cm-3, and δc = δρ/ρ = 1.686 is the critical overdensity for a spherical perturbation. For the ΛCDM model, the growth factor is given by
  , where
  (14)with
  The fraction of mass in the Universe collapsing into halos with the mass more massive than Mh,min, referred to as the collapse fraction, is written as
  (17)where ρm = Ωmρcr is the matter density of the Universe, and
  is obtained by the PS formalism. Mh,min and Mh,max are determined by the virial temperature. Thus the preliminary SFR is given by (Greif & Bromm 2006)
  (18)where f∗ is the star formation efficiency.
The transition from Pop III to Pop II stars is dependent on the evolution of metallicity. Here, we considered two channels of metal pollution: supernova-driven protogalactic outflows (Ferrara et al. 2000; Furlanetto & Loeb 2005) and the genetic channel (Schneider et al. 2006b; Trenti & Stiavelli 2009). First, we considered that metals are enriched via supernova-driven protogalactic outflows. For a protogalaxy within a dark matter halo, metals are blown out by superbubbles (SBs) resulting from supernova explosions. According to Ferrara & Tolstoy (2000), the condition of blowout is that the blowout velocity vb is higher than the escape velocity ve, which gives the fraction of the mechanical energy of the superbubble that can blowout. The efficiency of the metal escape produced by SNe is close to unity when blowout does take place (MacLow & Ferrara 1999). If a primordial galaxy has an exponentially stratified density distribution  , then the shock wave from SN explosion is initially decelerated by the ISM and subsequently accelerated due to blowout in a lower density environment and continued SB luminosity. The velocity of the shock wave has a minimum at z = 3H, which is defined as the blowout velocity. It is given by (Ferrara & Tolstoy 2000)
  (19)where L is the mechanical luminosity of SBs, n is the number density of a uniform ambient medium of protogalaxies, and H is taken to be a free parameter. For ISM parameters n = 0.5 cm3 andμ = 1.25, blowout occurs if vb>ve. Thus, the critical mechanical luminosity is
  (20)The total mechanical luminosity Lt must be higher than Lc when blowout occurs. Here we assumed that the escape velocity is equal to the circular velocity of the halo ve ≈ vc = (GMh/Rh)1 / 2. The total mechanical luminosity of SB in a galaxy is given by (Ferrara 1998)
  (21)where εSN = 1051 erg is the characteristic energy of an SN, the cooling fraction of baryons fb ≃ 1 in the halo 104.3 K <Tvir< 105.7 K (Madau et al. 2001), and f∗ is the star formation efficiency.
  is the free-fall time of dark matter halo. A typical mechanical luminosity is Lt ≈ 2.3 × 1038 erg s-1 for Mh = 108 M⊙ and z = 10. The mass in stars per SN event ν-1 is given by
  (22)Here we assumed that the lowest mass of SN progenitors is 8 M⊙. Equation (21) gives the total mechanical luminosity. However, only a fraction of the mechanical luminosity can blow out from galaxies because the SNe might occur in different regions in one galaxy, and some superbubbles with low mechanical luminosity cannot blow out in certain regions. Therefore we calculated the efficiency of blowout following Ferrara et al. (2000). Pop III.1 stars are formed in minihalos, and recent simulation (Bromm et al. 2009) implied that a minihalo only contains one Pop III.1 star. Thus the star formation may be confined to a small region, leading to SN explosions in the formation of a single superbubble. In this case, the single superbubble is likely to blow out Lt>Lc and the fraction of the mechanical energy that could blow out is ηB ≃ 1. For larger galaxies where Pop III.2 and Pop II stars have formed (Bromm 2013), the SNe would occur in different OB associations, which are more widely distributed within galaxies. The luminosity function of the OB association is approximated by (Oey & Clarke 1997; Portegies Zwart et al. 2010)
  (23)where N is the number of SN in a cluster. The probability to have N SNe in one OB association is p ≈ N-2, and the average probability is
  . The average number of SN per OB association
  , The total number of supernovae is given by
  . The total number of OB associations is K ~ Nmax. The mechanical luminosity of an OB association is LOB = NεSN/tOB, where tOB = 40 Myr is the time at which the lowest mass SN progenitor expires ~8 M⊙. The total mechanical luminosity is given by
  (24)The first total mechanical luminosity given by Eq. (21) is calculated via the SFR of a proto-galaxy, which is related to the mass of the dark matter halo. The second total mechanical luminosity given by Eq. (24) is to obtain the efficiency of the blowout, which is related to the number of SNe in a cluster. Physically, the latter mechanical luminosity must be equal to the former. This relation between the maximum number of SN and the total number of SN is approximately
  (25)The above equation describes the dependence of the total number of SN Ntot as a function of the maximum number of SN in a cluster, and we assumed that the maximum possible number of SN in a cluster is Nmax ≲ 500, which is consistent with the Monte Carlo simulation of Ferrara et al. (2000). We found that Eq. (25) can be applied to the case of Pop III.1 stars in minihalos with Mh ~ 106 M⊙. Similarly, the effective mechanical luminosity leading to blowout is
  (26)where Nc = LctOB/εSN is the number of SN in a cluster with mechanical luminosity. Thus the fraction of the mechanical energy that can blow out is defined as (Ferrara et al. 2000)
  (27)After the shock wave of SBs propagates to the IGM, the metal bubble would be enriched in a larger zone due to the lower density of the IGM. The outflow will be confined by the pressure of the IGM, which determines the radius of the metal bubble. The shell growth stalls when Pi = P0, where P0 is the IGM pressure in the surroundings of the galaxy as P0 = n(z)kBT, where n(z) is the average baryon number density of the cosmology, and the gas of IGM is heated to T ≃ 2 × 10⁴ K by photoionization heating. When the ionized zone overlaps, the SN-driven bubbles propagate in the photoionization gas. Here we assumed that the outflow propagates in the ionized zone.
We considered the standard evolution for an adiabatic, pressure-driven superbubble. The growth of the SN shell radius is (Weaver et al. 1977)  (28)where
  is the number density of the ambient medium in the IGM. The interior pressure is
  (29)When the shell growth stalls Pi = P0, we have
  (30)where Le = ηBLt is the effective mechanical luminosity, which is the fraction available for blowout into IGM. The stall age is
  (31)The typical parameters are Rs ≈ 33 kpc and ts ≈ 1.5 Gyr for Mh = 108 M⊙ and z = 10. If z ≫ 1 (ΩM ≫ ΩΛ), the stall redshift is given by (Voit 1996)
  (32)where tst = tISM + ts. tISMis the time during which an SN shell spreads through a galaxy, which is much shorter than the stall age in the IGM. The comoving metal-enrich radius is Re ≈ (1 + zs)Rs. If ts ≲ 1 /H0, the fraction of space with metals is approximately given by
  (33)This equation can be well approximated if the metal-enriched bubble does not overlap and the expanding time is much shorter than the Hubble time H-1(z) . If the protogalaxies are randomly distributed, then the filling factor would be
 ![\hbox{$p_{\rm e}^\prime(z)=1-\exp [-Q_{\rm e}^\prime(z)]$}](/articles/aa/full_html/2015/10/aa25623-15/aa25623-15-eq173.png) . In fact, due to clustering, some new halos form in the metal-enriched regions. The fraction of space with metals needs to be corrected for an excess probability that two galaxies are located near each other, viz., the galaxy two-point correlation function ξgg(Re) = b0bmξhh(Re) (Furlanetto & Loeb 2005), where ξhh is the correlation function of dark matter halo (e.g., Greif & Bromm 2006), b0 ≃ b(Mh,min) is the bias of the newly formed galaxies, and bm is the bias of the metal-enriched regions, which is given by
. In fact, due to clustering, some new halos form in the metal-enriched regions. The fraction of space with metals needs to be corrected for an excess probability that two galaxies are located near each other, viz., the galaxy two-point correlation function ξgg(Re) = b0bmξhh(Re) (Furlanetto & Loeb 2005), where ξhh is the correlation function of dark matter halo (e.g., Greif & Bromm 2006), b0 ≃ b(Mh,min) is the bias of the newly formed galaxies, and bm is the bias of the metal-enriched regions, which is given by  (34)Thus, the probability that a new halo lies within a metal-enriched region is then approximately given by
 ![\begin{eqnarray} Q_{\rm e}=Q_{\rm e}^\prime[1+\xi_{gg}(R_{\rm e})] . \end{eqnarray}](/articles/aa/full_html/2015/10/aa25623-15/aa25623-15-eq179.png) (35)Finally, the filling factor would be pe(z) = 1 − exp [ − Qe(z) ] after assuming the wind hosts are distributed randomly.
(35)Finally, the filling factor would be pe(z) = 1 − exp [ − Qe(z) ] after assuming the wind hosts are distributed randomly.
On the other hand, the metal enrichment of galaxies can proceed via a genetic channel (Schneider et al. 2006b), that is, metals are enriched via the merger of the lower mass progenitors instead of through outflows from neighbors. Here, we calculated the probability fold(z) that a new collapsing halo accretes onto some old halos via an extended Press-Schechter model (the Appendix of Furlanetto & Loeb 2005), which is  (36)where the factor 2 is attributed to the assumption that a parent halo with a mass Mh< 2Mh,min would be included in the new halo component, and the fraction of the accreted mass in a halo with a mass Mh at redshift z is
  (37)where zh corresponds to some earlier time when a parent halo with a mass (<Mh,min) formed, which is fixed by the dynamic time within a galaxy (Furlanetto & Loeb 2005). After a halo merging at a mass above Mh,min, it would most likely form Pop II stars. Thus, the probability pgc(z) that a dark matter halo did not inherit any metals from its progenitor is pgc(z) ≃ 1 − fold(z).
In Fig. 1, the solid curve corresponds to the evolution of the pristine fraction ppris(z) = 1 − pe(z), and the dashed curve corresponds to the evolution of pgc(z). We find that the metals of the IGM begin to be significantly enriched via supernova-driven protogalactic outflows at z ~ 10. However, due to pgc(z) ~ 0.2 − 0.6 during a wide range in redshift, the metal enrichment of galaxies is still dominated by the genetic channel at z ≳ 6.
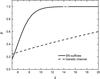 |
Fig. 1 Evolution of the non-metal fraction. The solid curve corresponds to the evolution of the pristine fraction ppris(z) = 1 − pe(z) and the dashed curve corresponds to the evolution of pgc(z) assuming that a dark matter halo did not inherit any metals from its progenitor. |
Since the Pop III stars generate many ionizing photons, the ionized bubbles are photoheated to ~104 K, which prevents the ionized gas from collapsing into new stars. Thus, the formation of Pop III.1 stars is suppressed by a factor that is equal to the volume-filling fraction of ionized regions Qion(z), which is discussed in the next section. The SFR of Pop III.1 stars is given by 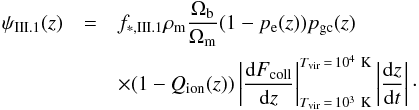 (38)As pointed out by Johnson & Bromm (2006), the free electrons can boost the production of H2 , leading to a lower temperature where the HD can be cooled. These stars, originating from metal-free gas and cooling via HD channel, would be less massive than Pop III.1 stars. The formation of Pop III.2 stars requires an increased abundance of free electrons. Here we considered two main pathways toward Pop III.2 (Bromm 2013) . The first one results from the photoionization of the ambient neutral hydrogen of Pop III.1 stars, and the non-equilibrium recombination leads to a boosted abundance of H2 and HD after the Pop III stars have died (Yoshida et al. 2007). To prevent pre-enrichment of the gas, these Pop III stars (260 <m< 500 M⊙) have to directly collapse into black holes, the number fraction of which is
  . The second path arises from the collision ionization in shocks that originate from the collapse of metal-free gas of more massive dark matter halos with Tvir = 104 K (Greif & Bromm 2006). Thus, the SFR of Pop III.2 is
  (39)The first term in the above equation is small because only few stars directly collapse into black holes. We assumed that Pop II stars are formed from the metal-enriched dark matter halos with Tvir = 104 K. The SFR of Pop II is
 ![\begin{equation} \psi _{\rm II}(z)=f_{\ast ,II}\rho _{\rm m}\frac{\Omega _{\rm b}}{\Omega _{\rm m}} [1-(1-p_{\rm e}(z))p_{\rm gc}(z)]\left\vert \frac{{\rm d}F_{\rm coll}}{dz}\right\vert _{T_{\rm vir}=10^{4}~{\rm K} }\left\vert \frac{{\rm d}z}{{\rm d}t}\right\vert\cdot \label{sfr2} \end{equation}](/articles/aa/full_html/2015/10/aa25623-15/aa25623-15-eq201.png) (40)In Eqs. (38) and (39), the SFRs depend on the hydrogen reionization fraction Qion, that is, as a function of redshift z, which is discussed in the next section.
(40)In Eqs. (38) and (39), the SFRs depend on the hydrogen reionization fraction Qion, that is, as a function of redshift z, which is discussed in the next section.
As a result of inhomogeneous metal pollution, some regions where the metal enrichment overlaps have a higher metallicity. The upper limit of metal-enriched IGM metallicity in these rich regions is estimated by  (41)where the metal yields are yII = 0.005 for Pop II, which is consistent with the proposed values in Greif & Bromm (2006), ρb is the mean baryon mass density of the Universe, ζe(z)ψII(z) is the SFR of Pop II stars that are polluted via supernova-driven protogalactic outflows, and ζe(z) = pe(z) / [ 1 − (1 − pe(z)pgc(z)) ]. The metals in the overlapping metal-enriched region mainly stem from the Pop II stars that are polluted via SNe, thus we ignored the first contribution of metal enrichment via the SNe of Pop III in this overlap region. On the other hand, we calculated the upper limit of the metallicity of the galaxies whose progenitors were all polluted by the genetic channel, which is
  (42)where ζgc(z)ψII(z) is the SFR of Pop II stars that are polluted via the genetic channel, and ζgc(z) = [ 1 − pgc(z) ] / [ 1 − (1 − pe(z)pgc(z)) ]. We assumed that the mean baryon mass density of the ISM is ρISM ≃ 10-24 cm-3, and the ratio of the mean distance between two galaxies to the scale of a galaxy is κv ≃ 100.
3. Reionization
The volume-filling fraction of hydrogen-ionized regions  is given by (Madau et al. 1998)
  (43)where i represents Pop II, Pop III.2, and Pop III.1 and fesc is the escape fraction of ionizing photons. As a result of clustering, the probability that a fresh halo lies within a hydrogen-ionized region (shown in Eqs. (38) and (39)) is
 ![\begin{eqnarray} Q_{\rm ion}=Q^\prime_{\rm ion}[1+\xi_{\rm hh}(z)] , \end{eqnarray}](/articles/aa/full_html/2015/10/aa25623-15/aa25623-15-eq217.png) (44)
(44) is the volume averaged recombination time, which is given by
 ![\begin{eqnarray} \overline{t}_{\rm rec}=[C_{\rm HII}(z)\alpha _{B}^{\rm rec}n_{\rm H,0}(1+z)^{3}(1+Y/4X)]^{-1}, \end{eqnarray}](/articles/aa/full_html/2015/10/aa25623-15/aa25623-15-eq219.png) (45)where
(45)where  /⟨nHII⟩2 is the clumping factor of ionized hydrogen. We used a simple analytic fit of the form
 ![\hbox{$C_{\rm HII}\left( z\right) =1+9\left[ \left( 1+z\right) /7\right] ^{-2}$}](/articles/aa/full_html/2015/10/aa25623-15/aa25623-15-eq222.png) for z> 6, and
for z> 6, and  for z ≤ 6 (Greif & Bromm 2006). We assumed that the mass fractions of hydrogen and helium are X = 0.75 and Y = 0.25, respectively. Thus the mean hydrogen number density at z = 0 is given by
  (46)The number of hydrogen-ionizing photons per stellar mass during a stellar lifetime is
 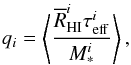 (47)where i presents Pop II, Pop III.2, and Pop III.1 stars, and τeff(M∗) is the effective stellar lifetime, which may be shorter than τ∗, given by Eq. (51). The optical depth for Thomson scattering determined by the ionization history is
 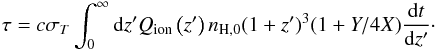 (48)To constrain our star formation model with fewer parameters, we adopted a fixed optical depth of Thomson scattering τ = 0.08, which is satisfied with the observation of WMAP nine-year data with τ = 0.089 ± 0.014 (Hinshaw et al. 2013) and the observation of Planck results with τ = 0.066 ± 0.016 (Planck Collaboration XIII 2015). The star formation efficiency of Pop II stars was assumed to be f∗,II = 0.01, which is constrained by the observation of the SFR at z ~ 5 − 10 (Bouwens et al. 2012a,b; Schenker et al. 2013). We took the same value of the star formation efficiency f∗ ,III for both Pop III.1 and Pop III.2 and the same value of the escape fraction of ionizing photons for all populations fesc. We assumed that stars form from redshift zin = 30. Figure 2 shows the three epochs of the cosmic star formation history: the blue line denotes Pop II stars, the black line denotes Pop III.1 stars, and the red line denotes Pop III.2 stars. The negative feedback from a star forming in a dark matter halo prevents the formation of other stars in the same halos, which causes Pop III stars to have a lower star formation efficiency than Pop II stars, and we set
  . For the same optical depth τ = 0.08, we considered three cases: case A (f∗ ,III = 0.01,fesc = 0.21), case B (f∗ ,III = 0.004,fesc = 0.45), and case C (f∗ ,III = 0.002,fesc = 0.75), which are denoted by dashed, solid, and dotted lines, respectively. For the same τ value, a higher value of fesc will result in a lower SFR and a lower value of fesc in a higher SFR. We also found that the SFR of Pop II rises earlier due to the metal pollution via the genetic channel.
 |
Fig. 2 Three epochs of the cosmic star formation history: the blue line denotes Pop II stars, the black line denotes Pop III.1 stars, and the red line denotes Pop III.2 stars. Case A (f∗ ,III = 0.01,fesc = 0.21), case B (f∗ ,III = 0.004,fesc = 0.45), and case C (f∗ ,III = 0.002,fesc = 0.75) are denoted by dashed, solid, and dotted lines, respectively. The observed data are taken from Bouwens et al. (2012a,b) and Schenker et al. (2013). |
Figure 3 shows the reionization history for three star formation models. The end of the reionization is zend = 5.1, 6.9, 7.2, corresponding to cases A, B, and C, which are denoted by dashed, solid, and dotted lines, respectively. We found that the higher SFR of Pop III.1 stars causes a larger hydrogen reionization portion at high redshift, but lower fesc leads to a later end of reionization. The higher SFR of Pop III.1 at high redshift and the huge amount of ionizing photons generated by Pop III.1 stars increases the hydrogen reionization fraction Qion at a higher redshift z ~ 20 until the SFR of Pop III.1 becomes low at z ~ 10. Soon after this, the Pop III.2 and Pop II stars form rapidly, leading to the hydrogen reionization fraction Qion that also rises rapidly until the Universe is completely ionized.
 |
Fig. 3 Hydrogen reionization fraction Qion as a function of redshift z. Case A (f∗ ,III = 0.01,fesc = 0.21), case B (f∗ ,III = 0.004,fesc = 0.45), and case C (f∗ ,III = 0.002,fesc = 0.75) are denoted by dashed, solid, and dotted lines, respectively. |
From Eqs. (41) and (42), we obtain the evolution of the upper limit of the metallicities in the metal-enriched region of IGM and in the galaxies whose progenitors were polluted via the genetic channel, as shown in Fig. 4. The upper limit is attributed to the inhomogeneous metal pollution. We predict that (i) for the metal-enriched region of the IGM, the upper limit of the metallicity reaches Zcrit = 10-3.5 Z⊙ (Bromm et al. 2001; Schneider et al. 2002)at z ~ 13; (ii) for the galaxies polluted by the genetic channel, it reaches the critical value at z ~ 11. Pop II stars with low mass formed at Z ≳ Zcrit, which agrees well with the star formation model in Fig. 2. We note that as shown in Fig. 1, the metal enrichment is dominated by the genetic channel, but at a certain redshift, the upper limit of the metallicity of the metal-enriched region is higher than that of the galaxies polluted via the genetic channel. The reason is that the fraction of space with metals is so small that the metallicity would be high if the Pop II stars that were polluted via SN outflows always formed in this metal-enriched region.
4. Near-infrared background
The intensity of the NIRB offers a window for probing the era of reionization. Following Fernandez & Komatsu (2006), we calculated the NIRB from the epoch of reionization. There are several contributions to the emission of NIRB: the continuum emission from stars themselves  , the series of recombination lines
  , the free-free and free-bound continuum emission from the ionized gas or nebula
  , and the two-photon emission
  . For the first stars, one of the remarkable properties is a bump in the spectrum of the NIRB, which stems from the Lyman α emission (Fernandez & Zaroubi 2013). The Lyman α bump would be higher if Pop III stars were more massive and presented at lower redshifts, and it would evolve with the transition from Pop III stars to Pop II stars. For the IGM, the hydrogen density is lower than that of the stellar nebulae. Here we neglect the emission from IGM, because it is only a small part of the NIRB (Cooray et al. 2012a). The intensity of the NIRB is given by
  (49)where the volume emissivity is given by
 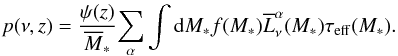 (50)The stellar effective lifetime is approximately given by
 ![\begin{eqnarray} \tau _{\rm eff}(M_{\ast })=\min [\tau _{\ast }(M_{\ast }),T_{\rm s}\left( z\right) ]. \label{timeeff} \end{eqnarray}](/articles/aa/full_html/2015/10/aa25623-15/aa25623-15-eq256.png) (51)
(51) is the time-averaged luminosity in the frequency interval dν for a radiative process α for stellar or nebular component, which consists of the stellar blackbody emission and the reprocessed nebular emission, such as two-photon emission, recombination line, and free-free and free-bound continuum emission. Ts is the time from the formation of the first stars of the Universe to the age of the Universe at redshift z (Fernandez & Komatsu 2006).
 |
Fig. 4 Evolution of the upper metallicity limit. The soild line denotes the upper metallicity limit in the metal-enriched region of IGM. The dashed line denotes the upper metallicity limit in the galaxies whose progenitors were polluted via the genetic channel. The dotted line denotes the critical metallicity Zcrit = 10-3.5 Z⊙. |
Following Fernandez & Komatsu (2006), we calculated four contributions to the emission of the NIRB: (1). The stellar spectrum, which is the Planck function with the Lyman absorption,  (52)where
  is the Planck spectrum. R∗ is the stellar radius, which is determined by the intrinsic bolometric luminosity
  and the effective temperature
  are given by Eqs. (5) and (6), respectively. (2). The luminosity of two-photon emission, which is given by
  (53)where νLyα = 2465 THz, fLyα = 0.64, P(y)dy is normalized probability of generating one photon via two-photon decay in the range dy = dν/νLyα for y ≡ ν/νLyα< 1 (Fernandez & Komatsu 2006). (3). The line luminosity, which is given by
  (54)where φ(ν − νLyα) is the line profile, which is taken to be a δ-function φ(ν − νLyα) = δD(ν − νLyα). We note that the above equation is valid only for the Lyman alpha line. (4). The free-free and free-bound continuum luminosity, that is,
 ![\begin{eqnarray} \overline{L}_{\nu }^{\rm cont}(M_{\ast })&~\simeq~& 6.8\times 10^{-38}\frac{ T_{g}^{-1/2}}{\alpha _{B}^{\rm rec}}\overline{R}_{\rm HI}(M_{\ast })\phi _{2}(T_{g}){\rm e}^{-h\nu /kT_{g}}\nonumber\\ &&\times \left[ \overline{g}_{\rm ff}+\frac{R_{y}}{kT_{g}} \sum_{n=2}^{\infty }\frac{{\rm e}^{R_{y}/(kT_{g}n^{2})}}{n^{3}}g_{\rm fb}(n)\right] , \end{eqnarray}](/articles/aa/full_html/2015/10/aa25623-15/aa25623-15-eq276.png) (55)where the case B recombination coefficient is
(55)where the case B recombination coefficient is  ,
,  and gfb(n) are the Gaunt factors for free-free and free-bound emission, respectively, approximately,
  and gfb(n) ≈ 1.05. Tg is the gas temperature; here we assumed that Tg ≈ 104 K, and the line profile is φ2(104 K) ≈ 1.0. Then
  is given by Eqs. (5) and (6).
Figure 5 shows the spectra of the NIRB at z> 6. Cases A, B, and C are denoted by dashed, solid, and dotted lines, respectively. Differently colored lines denote different contributions to the emission of the NIRB. The Lyman α and two-photon emission are dominant. We found that a higher value of f∗ ,III leads to a larger Lyman α bump and stronger two-photon emission. The mean intensity of the NIRB that is contributed by these early stars during reionization is nearly ~0.03 − 0.2 nWm-2 sr-1 at z> 6. We also plot the contributions of the different stellar populations to the NIRB in Fig. 6. The blue, black, and red lines denote the NIRB contribution of Pop II, Pop III.1, and Pop III.2, respectively. We found that the component of the Pop III.2 dominates the total NIRB spectra, and the two Lyman α bumps (~1215(1 + z)Å) associated with Pop III.2 and Pop III.1 are obvious at z> 6. If we can detect the Lyman α bumps, it would reveal many properties of the early stars, such as the SFRs, redshift distribution, and the classification of the Pop III stars.
 |
Fig. 5 Spectra of the NIRB at redshift z> 6. Case A (f∗ ,III = 0.01,fesc = 0.21), case B (f∗ ,III = 0.004,fesc = 0.45), and case C (f∗ ,III = 0.002,fesc = 0.75) are denoted by dashed, solid, and dotted lines, respectively. Differently colored lines denote different contributions to the emission of the NIRB. |
 |
Fig. 6 Contributions of the different stellar populations to the NIRB. The blue, black, and red lines denote the NIRB contribution of Pop II, Pop III.1, and Pop III.2, respectively. Case A (f∗ ,III = 0.01,fesc = 0.21), case B (f∗ ,III = 0.004,fesc = 0.45), and case C (f∗ ,III = 0.002,fesc = 0.75) are denoted by dashed, solid and dotted lines, respectively. |
5. Stochastic background of gravitational waves
In this section, we calculate the SBGWs that are generated when these stars collapse into black holes. The SBGW is mainly dependent on the SFR and IMF of Pop III and Pop II stars. The flux received in gravitational waves is 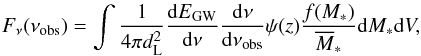 (56)where dL is the luminosity distance, dEGW/ dν is the specific energy of the source, ψ(z) is the SFR, f(M∗) is the IMF of one population, and
  is the mean stellar mass given by Eq. (4). As pointed out by Carr (1980), the specific energy flux per frequency is
 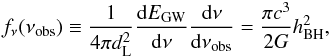 (57)where hBH is the dimensionless gravitational wave amplitude. The flux of gravitation waves is
 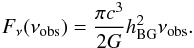 (58)The integral dimensionless gravitational wave amplitude produced from all events of stars collapsing into black holes is given by (Pereira & Miranda 2010)
  (59)The comoving volume can be expressed as
 ![\begin{eqnarray} {\rm d}V=4\pi d_{\rm C}^{2}\left( \frac{c}{H_{0}}\right) \left[ \Omega _{\rm m}\left( 1+z\right) ^{3}+\Omega _{\Lambda }\right] ^{-1/2}{\rm d}z. \end{eqnarray}](/articles/aa/full_html/2015/10/aa25623-15/aa25623-15-eq299.png) (60)When a star collapses into a black hole, we assume that gravitational waves radiates with an efficiency ϵGW = ΔEGW/mrc2, where ΔEGW is the total gravitational waves energy and mr is the mass of black hole. The efficiency ϵGW ≲ 7 × 10⁻⁴, if the collapse is axisymmetric (Stark & Piran 1985) . The characteristic amplitude is given by (Thorne 1987)
(60)When a star collapses into a black hole, we assume that gravitational waves radiates with an efficiency ϵGW = ΔEGW/mrc2, where ΔEGW is the total gravitational waves energy and mr is the mass of black hole. The efficiency ϵGW ≲ 7 × 10⁻⁴, if the collapse is axisymmetric (Stark & Piran 1985) . The characteristic amplitude is given by (Thorne 1987)  (61)and the observed gravitation waves frequency is
  (62)We considered that the black holes are formed with M∗> 25 M⊙ for Pop II and Pop III. For the stars with 25 <M∗< 140 M⊙, the black holes have the same mass of the helium core as their progenitors (Heger & Woosley 2002)
  (63)In the range 140 <M∗< 260 M⊙, the stars are completely disrupted in PISN explosions, leading to no black holes, mr = 0. For M∗> 260 M⊙, these stars would directly collapse into black holes, thus we neglected stellar mass loss, and the masses of the black holes are equal to those of their progenitor stars, mr = M∗. According to Eq. (62), the range of frequency is determined by the mass range of IMF after assuming that the highest star formation redshift is z = 30. For Pop II, the frequency is νobs> 6.4 Hz; for Pop III.1, the background is shifts to lower frequencies due to the direct collapse for M∗> 260 M⊙, νobs> 0.6 Hz; and for Pop III.2, νobs> 6.4 Hz, which has the same range as Pop II stars, because the stars with 140 <M∗< 250 M⊙ were disrupted by PISN.
The gravitational energy density parameter ΩGW is defined as the closure energy density per logarithmic frequency span (Pereira & Miranda 2010)  (64)In Fig. 7, Pop II, Pop III.2, and Pop III.1 stars are denoted by blue, red, and black lines, respectively. The sensitivity curves of advanced LIGO H1L1, LISA, and BBO are denoted by green, orange, and purple, respectively (Thrane & Romano 2013), assuming T = 1 yr of the observation. Cases A, B, and C are denoted by dashed, solid, and dotted lines, respectively. The predicted gravitational wave background has a peak amplitude of ΩGW ≃ 8 × 10⁻⁹ at ν = 158 Hz for Pop II star remnants. However, the background generated by Pop III.2 stars is much weaker than that caused by Pop II stars, with a peak amplitude of ΩGW ≃ 1.2 × 10⁻¹¹ at ν = 28 Hz. The background of Pop III.1 is shifted to lower frequencies, and the amplitude of ΩGW for Pop III.1 stars shows a minimum value at νobs ≃ 10 Hz because of the lack of gravitational wave signals from the stars with 140 <M∗< 260 M⊙. As shown in Fig. 7, it is difficult to observe the SBGWs from the early stars for the gravitational wave detectors. However, as shown for case A, we might have an opportunity to detect the SBGWs signal from Pop III.1 stars at observed frequency νobs ≃ 3.5 Hz, which are at twice the sensitivity of the BBO detector.
 |
Fig. 7 Spectrum of the gravitational waves. Pop II, Pop III.2, and Pop III.1 stars are denoted by blue, red, and black lines, respectively. Case A (f∗ ,III = 0.01,fesc = 0.21), case B (f∗ ,III = 0.004,fesc = 0.45), and case C (f∗ ,III = 0.002,fesc = 0.75) are denoted by dashed, solid and dotted lines, respectively. The sensitivity curves of the advanced LIGO H1L1, LISA, and BBO detectors are denoted by green, orange, and purple, respectively (Thrane & Romano 2013), assuming T = 1 yr of observations. |
6. Discussions and conclusions
We have constructed the star formation history for Pop III and Pop II via the collapse function of dark matter halos. These SFRs, calculated by the collapse fraction function, are self-consistent with the observations of reionization (the reionization optical depth measured by WMAP and Planck, reionization redshift in range from 5 to 10) and the NIRB (the total luminosity 1 ~ 10 nWm-2 sr-1). At first, Pop III stars form from pristine baryonic gas in dark matter halos. As a result of the rising metal enrichment in the Universe, more and more Pop II stars are formed in metal-enriched region. There are two main channels of the metal pollution: the supernova-driven protogalactic outflows (Ferrara et al. 2000; Furlanetto & Loeb 2005) and the genetic channel (Schneider et al. 2006b; Trenti & Stiavelli 2009). The former assumes that the new dark matter halos are formed in the IGM that is enriched with the metals dispersed by the first SNe and stellar winds, and the latter suggests that the new galaxies inherit metals from the lower mass progenitor galaxies. After the metal-element enriching to a critical threshold, the Pop I/II stars form gradually. Therefore, the SFRs of these populations depend on the hydrogen reionization fraction and pristine fraction, which are shown in Eqs. (38)−(40). Our results show that the metal enrichment is dominated by the genetic channel throughout a wide redshift range, leading to the earlier increase of the SFR of Pop II stars, which agrees with the result of Trenti & Stiavelli (2009). However, the upper limit of the metallicity of the metal-enriched region might be higher than that of the galaxies polluted via the genetic channel due to the inhomogeneous metal pollution of the supernova-driven protogalactic outflows.
For the case of the supernova-driven protogalactic outflow, we made the more reasonable assumption that the SN winds would stall when their pressures are equal to the pressure of the IGM, which is different from previous papers (Furlanetto & Loeb 2005; Greif & Bromm 2006), which calculated the process of the propagation and distribution of metals by assuming that the SN wind propagated for half of the age of the Universe via the Sedov solution (Furlanetto & Loeb 2005). The Sedov solution is not well approximated after the SN winds have been stalled by the IGM, however. Our result shows that the IGM is enriched via SN outflows during z = 4 ~ 10.
We studied the NIRB and SFRs of different populations simultaneously with the reionization history, which is different from Fernandez & Komatsu (2006) and Cooray et al. (2012a). In previous works, for example, Cooray et al. (2012a) and Fernandez & Zaroubi (2013), the transition of Pop III to Pop II stars is given by fp = (1 / 2) { 1 + erf [ (z − zt) /σp ] }, where fp is the fraction of Pop III stars, zt is the transition redshift, and σp is the length of the transition. The above equation describing the transition of Pop III to Pop II might be too simple. In fact, the transfer from Pop III to Pop II stars is a very complex process. Here, we considered the some main property evolutions of three stellar populations, such as the metallicity, reionization, and SFR. Finally, these properties would affect the character of the spectra of the NIRB.
As pointed out by Fernandez & Zaroubi (2013), the Lyα bump could reveal information about the Pop III era. Our results show that the Pop III would make a main contribution to the NIRB at high redshift and the spectra of the NIRB might show two bumps due to the different distributions of Pop III.1 and Pop III.2 stars. However, the predicted intensity (≲0.2 nWm-2 sr-1) of the NIRB from high-redshift (z> 6) stars is much lower than the contribution of the foreground (~10 nWm-2 sr-1), which makes measuring the signal from high-redshift stars very difficult. The contributions from low-redshift galaxies and the bright zodiacal foreground needs to be correctly subtracted. Many works have attempted to measure the excess of the NIRB without the contributions of the low-redshift galaxies and other foregrounds (Dwek & Arendt 1998; Gorjian et al. 2000; Kashlinsky & Odenwald 2000; Totani et al. 2001; Wright 2001; Kashlinsky et al. 2002, 2004, 2007b, 2012; Kashlinsky 2005; Magliocchetti et al. 2003; Salvaterra & Ferrara 2003; Cooray & Yoshida 2004; Matsumoto et al. 2005; Thompson et al. 2007a,b; Cooray et al. 2012b). On the other hand, Fernandez & Zaroubi (2013) suggested that we can detect the relative change in the intensity of the NIRB, which results from a Lyman α bump as a function of wavelength. However, there are still many ways causing such a change, such as the evolution of the escape fraction or a rapidly changing SFR as a function of redshift.
We also calculated the SBGWs from the collapse of the early stars. However, theoretically, there are several astrophysical sources contributing to the background of gravitational waves, including transient sources (e.g., compact binary coalescence, supernovae and gamma-ray bursts), long-lasting transient sources (e.g., magnetars and long gamma-ray bursts) and continuous sources (e.g., pulsars). Thus it is necessary to distinguish between different sources from the spectrum of gravitational waves. We here found that it is difficult to observe the SBGW signals from the early stars, but for f∗ ,III ≃ 0.01 and fesc ≃ 0.21, the BBO, which operates in the range 0.01 − 10 Hz, might detect lower frequency signals from Pop III.1 stars, which are at twice the sensitivity of the BBO.
Acknowledgments
We thank the anonymous referee for valuable and detailed suggestions that have allowed us to improve this manuscript significantly. This work is supported by the National Basic Research Program of China (973 Program, grant No. 2014CB845800) and the National Natural Science Foundation of China (grants 11422325, 11373022, and 11033002), the Excellent Youth Foundation of Jiangsu Province (BK20140016), and the Program for New Century Excellent Talents in University (grant No. NCET-13-0279).
References
- Abel, T., Bryan, G. L., & Norman, M. L. 2002, Science, 295, 93 [NASA ADS] [CrossRef] [PubMed] [Google Scholar]
- Barkana, R., & Loeb, A. 2000, ApJ, 539, 20 [NASA ADS] [CrossRef] [Google Scholar]
- Barkana, R., & Loeb, A. 2001, Phys. Rep., 349, 125 [NASA ADS] [CrossRef] [Google Scholar]
- Barlow, T. A., & Tytler, D. 1998, AJ, 115, 1725 [NASA ADS] [CrossRef] [Google Scholar]
- Bouwens, R. J., Illingrworth, G. P., Oesch, P. A., et al. 2010, ApJ, 708, L69 [NASA ADS] [CrossRef] [Google Scholar]
- Bouwens, R. J., Illingworth, G. D., Oesch, P. A., et al. 2012a, ApJ, 754, 83 [NASA ADS] [CrossRef] [Google Scholar]
- Bouwens, R. J., Illingworth, G. D., Oesch, P. A., et al. 2012b, ApJ, 752, L5 [NASA ADS] [CrossRef] [Google Scholar]
- Bromm, V. 2013, Rep. Prog. Phys., 76, 112901 [Google Scholar]
- Bromm, V., & Loeb, A. 2003, Nature, 425, 812 [NASA ADS] [CrossRef] [EDP Sciences] [PubMed] [Google Scholar]
- Bromm, V., & Loeb, A. 2004, New Astron., 9, 353 [NASA ADS] [CrossRef] [Google Scholar]
- Bromm, V., Coppi, P. S., & Larson, R. B. 1999, ApJ, 527, L5 [NASA ADS] [CrossRef] [PubMed] [Google Scholar]
- Bromm, V., Ferrara, A., Coppi, P. S., & Larson, R. B. 2001, MNRAS, 328, 969 [NASA ADS] [CrossRef] [Google Scholar]
- Bromm, V., Coppi, P. S., & Larson, R. B. 2002, ApJ, 564, 23 [NASA ADS] [CrossRef] [Google Scholar]
- Bromm, V., Yoshida, N., Hernquist, L., & McKee, C. F. 2009, Nature, 459, 49 [NASA ADS] [CrossRef] [PubMed] [Google Scholar]
- Buonanno, A., Sigl, G., Raffelt, G. G., Janka, H., & Muller, E. 2005, Phys. Rev. D, 72, 084001 [NASA ADS] [CrossRef] [Google Scholar]
- Carr, B. J. 1980, A&A, 89, 6 [NASA ADS] [Google Scholar]
- Cooray, A., & Yoshida, N. 2004, MNRAS, 351, L71 [NASA ADS] [CrossRef] [Google Scholar]
- Cooray, A., Bock, J. J., Keatin, B., Lange, A. E., & Matsumoto, T. 2004, ApJ, 606, 611 [NASA ADS] [CrossRef] [Google Scholar]
- Cooray, A., Gong, Y., Smidt, J., & Santos, M. G. 2012a, ApJ, 756, 92 [NASA ADS] [CrossRef] [Google Scholar]
- Cooray, A., Smidt, J., de Bernardis, F., et al. 2012b, Nature, 490, 514 [NASA ADS] [CrossRef] [Google Scholar]
- de Souza, R. S., Yoshida, N., & Ioka, K. 2011, A&A, 533, A32 [NASA ADS] [CrossRef] [EDP Sciences] [Google Scholar]
- Dwek, E., & Arendt, R. G. 1998, ApJ, 508, L9 [NASA ADS] [CrossRef] [Google Scholar]
- Fan, X., Carilli, C. L., & Keating, B. 2006, ARA&A, 44, 415 [NASA ADS] [CrossRef] [Google Scholar]
- Fernandez, E. R., & Komatsu, E. 2006, ApJ, 646, 703 [NASA ADS] [CrossRef] [Google Scholar]
- Fernandez, E. R., & Shull, J. M. 2011, ApJ, 731, 20 [NASA ADS] [CrossRef] [Google Scholar]
- Fernandez, E. R., & Zaroubi, S. 2013, MNRAS, 433, 2047 [NASA ADS] [CrossRef] [Google Scholar]
- Fernandez, E. R., Komatsu, E., Iliev, I. T., & Shapiro, P. R. 2010, ApJ, 710, 1089 [NASA ADS] [CrossRef] [Google Scholar]
- Fernandez, E. R., Iliev, I. T., Komatsu, E., & Shapiro, P. R. 2012, ApJ, 750, 20 [NASA ADS] [CrossRef] [Google Scholar]
- Fernandez, E. R., Dole, H., & Iliev, I. T. 2013, ApJ, 764, 56 [NASA ADS] [CrossRef] [Google Scholar]
- Ferrara, A. 1998, ApJ, 499, L7 [NASA ADS] [CrossRef] [Google Scholar]
- Ferrara, A., & Tolstoy, E. 2000, MNRAS, 313, 291 [NASA ADS] [CrossRef] [Google Scholar]
- Ferrara, A., Pettini, M., & Shchekinov, Y. 2000, MNRAS, 319, 539 [NASA ADS] [CrossRef] [Google Scholar]
- Franceschini, A., Rodighiero, G., & Vaccari, M. 2008, A&A, 487, 837 [NASA ADS] [CrossRef] [EDP Sciences] [Google Scholar]
- Finke, J. D., Razzaque, S., & Dermer, C. D. 2010, ApJ, 712, 238 [NASA ADS] [CrossRef] [Google Scholar]
- Furlanetto, S. R., & Loeb, A. 2005, ApJ, 634, 1 [NASA ADS] [CrossRef] [Google Scholar]
- Gilmore, R. C., Madau, P., Primack, J. R., Somerville, R. S., & Haardt, F. 2009, MNRAS, 399, 1694 [Google Scholar]
- Gilmore, R. C., Somerville, R. S., Primack, J. R., & Domínguez, A. 2012, MNRAS, 422, 3189 [NASA ADS] [CrossRef] [Google Scholar]
- Greif, T. H., & Bromm, V. 2006, MNRAS, 373, 128 [NASA ADS] [CrossRef] [Google Scholar]
- Gorjian, V., Wright, E. L., & Chary, R. R. 2000, ApJ, 536, 550 [NASA ADS] [CrossRef] [Google Scholar]
- Hauser, G., & Dwek, E. 2001, ARA&A, 39, 249 [NASA ADS] [CrossRef] [Google Scholar]
- Heger, A., & Woosley, S. E. 2002, ApJ, 567, 532 [NASA ADS] [CrossRef] [Google Scholar]
- Hinshaw, G., Larson, D., & Komatsu, E., et al. 2013, ApJS, 208, 19 [NASA ADS] [CrossRef] [Google Scholar]
- Hosokawa, T., Omukai, K., Yoshida, N., & Yorke, H. W. 2011, Science, 334, 1250 [Google Scholar]
- Hosokawa, T., Yoshida, N., Omukai, K., & Yorke, H. W. 2012, ApJ, 760, L37 [NASA ADS] [CrossRef] [Google Scholar]
- Inoue, Y., Inoue, S., Kobayashi, M. A. R., et al. 2013, ApJ, 768, 197 [NASA ADS] [CrossRef] [Google Scholar]
- Jappsen, A.-K., MacLow, M.-M., Glover, S. C. O., Klessen, R. S., & Kitsionas, S. 2009a, ApJ, 694, 1161 [NASA ADS] [CrossRef] [Google Scholar]
- Jappsen, A.-K., Klessen, R. S., Glover, S. C. O., & MacLow, M.-M. 2009b, ApJ, 696, 1065 [NASA ADS] [CrossRef] [Google Scholar]
- Johnson, J. L., & Bromm, V. 2006, MNRAS, 366, 247 [NASA ADS] [Google Scholar]
- Kashlinsky, A. 2005, Phys. Rep., 409, 361 [NASA ADS] [CrossRef] [Google Scholar]
- Kashlinsky, A., & Odenwald, S. 2000, ApJ, 528, 74 [NASA ADS] [CrossRef] [Google Scholar]
- Kashlinsky, A., Odenwald, S., Mather, J., Skrutskie, M. F., & Cutri, R. M. 2002, ApJ, 579, L53 [NASA ADS] [CrossRef] [Google Scholar]
- Kashlinsky, A., Arendt, R., Gardner, J. P., Mather, J. C., & Moseley, S. H. 2004, ApJ, 608, 1 [NASA ADS] [CrossRef] [Google Scholar]
- Kashlinsky, A., Arendt, R. G., Mather, J., & Moseley, S. H. 2005, Nature, 438, 45 [NASA ADS] [CrossRef] [PubMed] [Google Scholar]
- Kashlinsky, A., Arendt, R. G., Mather, J., & Moseley, S. H. 2007a, ApJ, 654, L1 [NASA ADS] [CrossRef] [Google Scholar]
- Kashlinsky, A., Arendt, R. G., Mather, J., & Moseley, S. H. 2007b, ApJ, 654, L5 [NASA ADS] [CrossRef] [Google Scholar]
- Kashlinsky, A., Arendt, R. G., Ashby, M. L. N., Fazio, G. G., Mather, J., & Moseley, S. H. 2012, ApJ, 753, 63 [NASA ADS] [CrossRef] [Google Scholar]
- Kistler, M. D., Yüksel, H., Beacom, J. F., Hopkins, A. M., & Wyithe, J. S. B. 2009, ApJ, 705, L104 [NASA ADS] [CrossRef] [Google Scholar]
- Kneiske, T. M., & Dole, H. 2010, A&A, 515, A19 [NASA ADS] [CrossRef] [EDP Sciences] [Google Scholar]
- Kneiske, T. M., Bretz, T., Mannheim, K., & Hartmann, D. H. 2004, A&A, 413, 807 [NASA ADS] [CrossRef] [EDP Sciences] [Google Scholar]
- Komatsu, E., Dunkley, J., Nolta, M. R., et al. 2009, ApJS, 180, 330 [NASA ADS] [CrossRef] [Google Scholar]
- Larson, R. B. 1998, MNRAS, 301, 569 [NASA ADS] [CrossRef] [Google Scholar]
- Lejeune, T., & Schaerer, D. 2001, A&A, 336, 538 [NASA ADS] [CrossRef] [EDP Sciences] [Google Scholar]
- Mackey, J., Bromm, V., & Hernquist, L. 2003, ApJ, 586, 1 [NASA ADS] [CrossRef] [Google Scholar]
- MacLow, M.-M., & Ferrara, A. 1999, ApJ, 513, 142 [NASA ADS] [CrossRef] [Google Scholar]
- Madau, P., & Silk, J. 2005, MNRAS, 359, L37 [NASA ADS] [Google Scholar]
- Madau, P., Pozzetti, L., & Dickinson, M. 1998, ApJ, 498, 106 [NASA ADS] [CrossRef] [Google Scholar]
- Madau, P., Ferrara, A., & Rees, M. J. 2001, ApJ, 555, 92 [NASA ADS] [CrossRef] [Google Scholar]
- Marassi, S., Schneider, R., & Ferrari, V. 2009, MNRAS, 398, 293 [NASA ADS] [CrossRef] [Google Scholar]
- Magliocchetti, M., Salvaterra, R., & Ferrara, A. 2003, MNRAS, 342, L25 [NASA ADS] [CrossRef] [Google Scholar]
- Matsumoto, T., Matsuura, S., Murakami, H., et al. 2005, ApJ, 626, 31 [NASA ADS] [CrossRef] [Google Scholar]
- Mũnoz, J. A., & Loeb, A. 2011, ApJ, 729, 99 [NASA ADS] [CrossRef] [Google Scholar]
- Oey, Y. M. S., & Clarke, C. J. 1997, MNRAS, 289, 570 [NASA ADS] [CrossRef] [Google Scholar]
- Ohkubo, T., Nomoto, K., Umeda, H., Yoshida, N., & Tsuruta, S. 2009, ApJ, 706, 1184 [NASA ADS] [CrossRef] [Google Scholar]
- Omukai, K., & Palla, F. 2001, ApJ, 561, L55 [NASA ADS] [CrossRef] [Google Scholar]
- Omukai, K., & Palla, F. 2003, ApJ, 589, 677 [NASA ADS] [CrossRef] [Google Scholar]
- Pereira, E. S., & Miranda, O. D. 2010, MNRAS, 401, 1924 [NASA ADS] [CrossRef] [Google Scholar]
- Planck Collaboration XIII. 2015, A&A, submitted [arXiv:1502.01589] [Google Scholar]
- Portegies Zwart, S. F., McMillan, S. L. W., & Gieles, M. 2010, ARA&A, 48, 431 [NASA ADS] [CrossRef] [Google Scholar]
- Press, W. H., & Schechter, P. 1974, ApJ, 187, 425 [NASA ADS] [CrossRef] [Google Scholar]
- Robertson, B. E., Ellis, R. S., Dunlop, J. S., McLure, R. J., & Stark, D. P. 2010, Nature, 468, 49 [NASA ADS] [CrossRef] [PubMed] [Google Scholar]
- Salpeter, E. E. 1955, ApJ, 121, 161 [Google Scholar]
- Salvaterra, R., & Ferrara, A. 2003, MNRAS, 339, 973 [Google Scholar]
- Salvaterra, R., & Ferrara, A. 2006, MNRAS, 367, L11 [NASA ADS] [CrossRef] [Google Scholar]
- Sandick, P., Olive, K. A., Daigne, F., & Vangioni, E. 2006, Phys. Rev. D, 73, 104024 [NASA ADS] [CrossRef] [Google Scholar]
- Santos, M. R., Bromm, V., & Kamionkowski, M. 2002, MNRAS, 336, 1082 [NASA ADS] [CrossRef] [Google Scholar]
- Schaerer, D. 2002, A&A, 382, 28 [NASA ADS] [CrossRef] [EDP Sciences] [Google Scholar]
- Schenker, M. A., Robertson, B. E., Ellis, R. S., et al. 2013, ApJ, 768, 196 [NASA ADS] [CrossRef] [Google Scholar]
- Schneider, R., Ferrara, A., Ciardi, B., Ferrari, V., & Matarrese, S. 2000, MNRAS, 317, 385 [NASA ADS] [CrossRef] [Google Scholar]
- Schneider, R., Ferrara, A., Natarajan, P., & Omukai, K. 2002, ApJ, 571, 30 [NASA ADS] [CrossRef] [Google Scholar]
- Schneider, R., Omukai, K., Inoue, A. K., & Ferrara, A. 2006a, MNRAS, 369, 1437 [NASA ADS] [CrossRef] [Google Scholar]
- Schneider, R., Salvaterra, R., Ferrara, A., & Ciardi, B. 2006b, MNRAS, 369, 825 [NASA ADS] [CrossRef] [Google Scholar]
- Stacy, A., Greif, T. H., & Bromm, V. 2012, MNRAS, 422, 290 [NASA ADS] [CrossRef] [Google Scholar]
- Stark, R. F., & Piran, T. 1985, Phys. Rev. Lett., 55, 8 [Google Scholar]
- Stecker, F. W., Malkan, M. A., & Scully, S. T. 2006, ApJ, 648, 774 [NASA ADS] [CrossRef] [Google Scholar]
- Suwa, Y., Takiwaki, T., Kotake, K., & Sato, K. 2007, ApJ, 665, L43 [NASA ADS] [CrossRef] [Google Scholar]
- Tegmark, M., Silk, J., Rees, M. J., et al. 1997, ApJ, 474, 1 [NASA ADS] [CrossRef] [Google Scholar]
- Thompson, R. I., Eisenstein, D., Fan, X., Rieke, M., & Kennicutt, R. C. 2007a, ApJ, 657, 669 [NASA ADS] [CrossRef] [Google Scholar]
- Thompson, R. I., Eisenstein, D., Fan, X., Rieke, M., & Kennicutt, R. C. 2007b, ApJ, 666, 658 [NASA ADS] [CrossRef] [Google Scholar]
- Thorne, K. P. 1987, in Three Hundred Years of Gravitation, eds. S. W. Hawking, & W. Israel (Cambridge University Press) [Google Scholar]
- Thrane, E., & Romano, J. D. 2013, Phys. Rev. D, 88, 124032 [NASA ADS] [CrossRef] [Google Scholar]
- Totani, T., Yoshii, Y., Iwamuro, F., Maihara, T., & Motohara, K. 2001, ApJ, 550, L137 [NASA ADS] [CrossRef] [Google Scholar]
- Trenti, M., & Stiavelli, M. 2009, ApJ, 694, 879 [NASA ADS] [CrossRef] [Google Scholar]
- Voit, G. M. 1996, ApJ, 465, 548 [NASA ADS] [CrossRef] [Google Scholar]
- Wyithe, J. S. B., & Loeb, A. 2006, Nature, 441, 322 [NASA ADS] [CrossRef] [Google Scholar]
- Wang, F. Y. 2013, A&A, 556, A90 [NASA ADS] [CrossRef] [EDP Sciences] [Google Scholar]
- Wang, F. Y., & Dai, Z. G. 2009, MNRAS, 400, L10 [NASA ADS] [Google Scholar]
- Wang, L., Mao, J., Xiang, S., & Yuan, Y. F. 2009, A&A, 494, 817 [NASA ADS] [CrossRef] [EDP Sciences] [Google Scholar]
- Weaver, R., McCray, R., Castor, J., Shapiro, P., & Moore, R. 1977, ApJ, 218, 377 [NASA ADS] [CrossRef] [Google Scholar]
- Wright, E. L. 2001, ApJ, 553, 538 [Google Scholar]
- Yoshida, N., Abel, T., Hernquist, L., & Sugiyama, N. 2003, ApJ, 592, 645 [NASA ADS] [CrossRef] [Google Scholar]
- Yoshida, N, Oh, S. P., Kitayama, T., & Hernquist, L. 2007, ApJ, 663, 687 [NASA ADS] [CrossRef] [Google Scholar]
- Yu, Y. W., Cheng, K. S., Chu, M. C., & Yeung, S. 2012, JCAP, 7, 23 [NASA ADS] [CrossRef] [Google Scholar]
- Yue, B., Ferrara, A., Salvaterra, R., & Chen, X. 2013, MNRAS, 431, 383 [NASA ADS] [CrossRef] [Google Scholar]
All Figures
|
Fig. 1 Evolution of the non-metal fraction. The solid curve corresponds to the evolution of the pristine fraction ppris(z) = 1 − pe(z) and the dashed curve corresponds to the evolution of pgc(z) assuming that a dark matter halo did not inherit any metals from its progenitor. |
| In the text | |
|
Fig. 2 Three epochs of the cosmic star formation history: the blue line denotes Pop II stars, the black line denotes Pop III.1 stars, and the red line denotes Pop III.2 stars. Case A (f∗ ,III = 0.01,fesc = 0.21), case B (f∗ ,III = 0.004,fesc = 0.45), and case C (f∗ ,III = 0.002,fesc = 0.75) are denoted by dashed, solid, and dotted lines, respectively. The observed data are taken from Bouwens et al. (2012a,b) and Schenker et al. (2013). |
| In the text | |
|
Fig. 3 Hydrogen reionization fraction Qion as a function of redshift z. Case A (f∗ ,III = 0.01,fesc = 0.21), case B (f∗ ,III = 0.004,fesc = 0.45), and case C (f∗ ,III = 0.002,fesc = 0.75) are denoted by dashed, solid, and dotted lines, respectively. |
| In the text | |
|
Fig. 4 Evolution of the upper metallicity limit. The soild line denotes the upper metallicity limit in the metal-enriched region of IGM. The dashed line denotes the upper metallicity limit in the galaxies whose progenitors were polluted via the genetic channel. The dotted line denotes the critical metallicity Zcrit = 10-3.5 Z⊙. |
| In the text | |
|
Fig. 5 Spectra of the NIRB at redshift z> 6. Case A (f∗ ,III = 0.01,fesc = 0.21), case B (f∗ ,III = 0.004,fesc = 0.45), and case C (f∗ ,III = 0.002,fesc = 0.75) are denoted by dashed, solid, and dotted lines, respectively. Differently colored lines denote different contributions to the emission of the NIRB. |
| In the text | |
|
Fig. 6 Contributions of the different stellar populations to the NIRB. The blue, black, and red lines denote the NIRB contribution of Pop II, Pop III.1, and Pop III.2, respectively. Case A (f∗ ,III = 0.01,fesc = 0.21), case B (f∗ ,III = 0.004,fesc = 0.45), and case C (f∗ ,III = 0.002,fesc = 0.75) are denoted by dashed, solid and dotted lines, respectively. |
| In the text | |
|
Fig. 7 Spectrum of the gravitational waves. Pop II, Pop III.2, and Pop III.1 stars are denoted by blue, red, and black lines, respectively. Case A (f∗ ,III = 0.01,fesc = 0.21), case B (f∗ ,III = 0.004,fesc = 0.45), and case C (f∗ ,III = 0.002,fesc = 0.75) are denoted by dashed, solid and dotted lines, respectively. The sensitivity curves of the advanced LIGO H1L1, LISA, and BBO detectors are denoted by green, orange, and purple, respectively (Thrane & Romano 2013), assuming T = 1 yr of observations. |
| In the text | |
Current usage metrics show cumulative count of Article Views (full-text article views including HTML views, PDF and ePub downloads, according to the available data) and Abstracts Views on Vision4Press platform.
Data correspond to usage on the plateform after 2015. The current usage metrics is available 48-96 hours after online publication and is updated daily on week days.
Initial download of the metrics may take a while.