Fig. 7
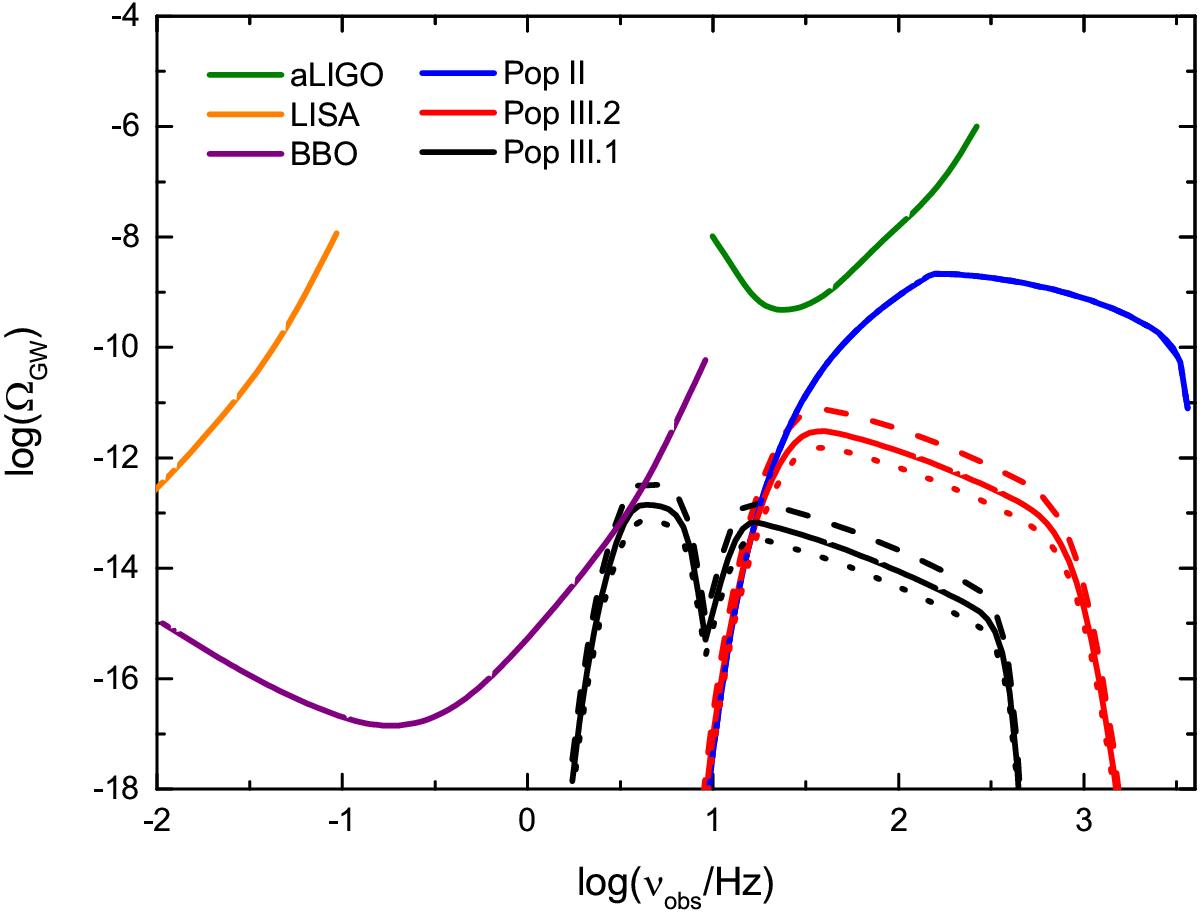
Spectrum of the gravitational waves. Pop II, Pop III.2, and Pop III.1 stars are denoted by blue, red, and black lines, respectively. Case A (f∗ ,III = 0.01,fesc = 0.21), case B (f∗ ,III = 0.004,fesc = 0.45), and case C (f∗ ,III = 0.002,fesc = 0.75) are denoted by dashed, solid and dotted lines, respectively. The sensitivity curves of the advanced LIGO H1L1, LISA, and BBO detectors are denoted by green, orange, and purple, respectively (Thrane & Romano 2013), assuming T = 1 yr of observations.
Current usage metrics show cumulative count of Article Views (full-text article views including HTML views, PDF and ePub downloads, according to the available data) and Abstracts Views on Vision4Press platform.
Data correspond to usage on the plateform after 2015. The current usage metrics is available 48-96 hours after online publication and is updated daily on week days.
Initial download of the metrics may take a while.