| Issue |
A&A
Volume 580, August 2015
|
|
|---|---|---|
| Article Number | L8 | |
| Number of page(s) | 4 | |
| Section | Letters | |
| DOI | https://doi.org/10.1051/0004-6361/201526797 | |
| Published online | 11 August 2015 | |
Planck revealed bulk motion of Centaurus A lobes
1
Dipartimento di Matematica e Fisica “E. De Giorgi”Università del
Salento,
via per Arnesano,
73100
Lecce,
Italy
e-mail:
francesco.depaolis@le.infn.it
2
INFN, Sez. di Lecce, via per Arnesano,
73100
Lecce,
Italy
3 Center for Cosmology and Astrophysics, Alikhanian National
Laboratory and and Yerevan State University, Yerevan, Armenia
4
Physik-Institut, Universität Zürich, Winterthurerstrasse 190, 8057
Zürich,
Switzerland
5
School of Natural Sciences, National University of Sciences and
Technology, Islamabad, Pakistan
6
Department of Physics, University of Trento and TIFPA/INFN 38123 Povo,
Trento,
Italy, 38123
Povo,
Italy
Received: 20 June 2015
Accepted: 20 July 2015
Planck data towards the active galaxy Centaurus A are analyzed in the 70, 100 and 143 GHz bands. We find a temperature asymmetry of the northern radio lobe with respect to the southern one that clearly extends at least up to 5° from the Cen A center and diminishes towards the outer regions of the lobes. That transparent parameter – the temperature asymmetry – thus has to carry a principal information, i.e. indication on the line-of-sight bulk motion of the lobes, while the increase of that asymmetry at smaller radii reveals the differential dynamics of the lobes as expected at ejections from the center.
Key words: galaxies: general / galaxies: individual: Centaurus A / galaxies: halos
© ESO, 2015
1. Introduction
Centaurus A (and its parent galaxy NGC 5128) is a radio galaxy and represents the closest AGN to us, at a distance of 3.8 ± 0.1 Mpc (Harris et al. 2010). Its jet is clearly visible both in radio and X-rays1 and since its discovery (Bolton 1948) Cen A has been extensively studied over the entire range of the electromagnetic spectrum (for a review see Israel 1998) with a sensitivity and spatial resolution that is impossible for other active galaxies. It is an extended, morphologically complex (a detailed description of the radio morphology may be found, e.g., in Burns et al. 1983; Meier et al. 1989) and fairly symmetric source exhibiting two giant lobes: the northern (GLN) and southern lobe (GLS), spanning in declination between approximately − 38° and − 48° (the coordinates of the Cen A center are RA (J2000) = 13h25m27.6152s, Dec (J2000) = − 43°0.1′08.805″). We note that an angle of about 10° on the sky means a physical size at the Cen A distance of ≃600 kpc in projection and that the redshift of Cen A is z = 0.01825, corresponding to a recession velocity of about 540 km s-1.
The elliptical (S0) galaxy NGC 5128 is an example of the family of ellipticals that have an absorbing band of gas and dust projected across the stellar body. The center of this system harbors a supermassive black hole with mass about 107−108 M⊙ (see, e.g., Silge et al. 2005; Marconi et al. 2006; Neumayer 2010), which powers two jets, two inner lobes (with size about a few arcmin each), and the two outer giant lobes. The GLN and the northern jet are likely tilted toward the observer and the GLN is thought to be closer to us than the GLS. Indeed, the jets appear clearly in the radio band and are obviously shooting out of Centaurus A, with the radio emission becoming more diffuse at greater distances from the center of the galaxy (Neff et al. 2015). The jets consist of a plasma state, i.e., a high-temperature stream of matter. The jets are also clearly observed in X-rays (see, e.g., Karovska et al. 2002, and references therein). The most prominent feature is the jet extending for about 8 kpc toward the northeast (upper left in the sky), while a less prominent jet extends toward the southwest. The apparent brightness difference between the jets and the proper motion asymmetries of both the jets and the inner lobes (Tingay et al. 2001) are thought to be due to the viewing geometry: the first jet is moving toward us, while the second is moving away (see, e.g., Burns et al. 1983; Israel 1998). This was also suggested by the Faraday depolarization analysis of the southern inner lobe (Clarke et al. 1992).
Motivated by the discussion above and by the unique tool that is provided by data in the microwave region of the electromagnetic spectrum to probe the large-scale temperature asymmetries toward nearby astronomical systems, in this Letter we study the Cen A system using Planck data and following the same approach adopted in De Paolis et al. (2011, 2014) for the M 31 galaxy.
2. Planck data analysis and results
We have considered Planck 2015 release data (Planck Collaboration I 2015) in the bands at 70 GHz detected by the LFI instrument, and in the bands at 100 and 143 GHz detected by the HFI instrument (for a review on Planck results and instruments characteristics we refer to e.g. Burigana et al. 2013). The resolution in these Planck bands are 13′, 9.6′, and 7.1′ (in terms of full width at half maximum) at 70, 100, and 143 GHz, respectively, and Nside = 2048 for cosmic microwave background (CMB) temperature (Planck Collaboration XVI 2015). The sensitivity, angular resolution, and frequency coverage of Planck make it a powerful instrument for cosmology as well as Galactic and extragalactic astrophysics (Planck Collaboration I 2015). To reveal and study the Cen A giant lobes GLN and GLS in microwaves we divided the Cen A sky field in two parts as shown in Fig. 1, removing the innermost part (about 20′) of Cen A, which corresponds to the NGC 5128 galaxy and the innermost radio lobes.
The mean temperature excess Tm in μK in each region was obtained in each Planck band at 70, 100, and 143 GHz with the corresponding standard error2.
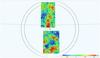 |
Fig. 1 Planck fields toward Cen A galaxy in which our analysis is performed are shown. The radius of the outer circle is of 5° about the NGC 5128 center (with Galactic coordinates l = 309.52°, b = 19.42°). The northern field (with 10792 pixels), corresponding to the GLN radio lobe, has Galactic coordinates 308.65° ≤ l ≤ 311.03 and 19.64° ≤ b ≤ 23.92°, while those of the southern field (which has 11011 pixels), corresponding to the GLS, are 307.98° ≤ l ≤ 310.64 and 15.58° ≤ b ≤ 19.14°. |
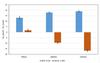 |
Fig. 2 Excess temperature in μK (in blue) of the northern Cen A lobe with respect to the southern lobe are given in the 70 GHz, 100 GHz, and 143 GHz Planck data. In brown we give the temperature excess of 360 control regions equally spaced at one degree distance to each other in Galactic longitude and at the same latitude as NGC 5128. The standard errors are also shown. |
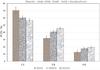 |
Fig. 3 Excess temperature in μK (with the standard errors) of the northern Cen A lobe with respect to the southern lobe are given in the 70 GHz, 100 GHz, and 143 GHz Planck data up 1.5° (≃92 kpc), 2.8° (≃171 kpc) and 4.0° (≃245 kpc) from the galaxy center. |
The results obtained for the temperature difference between the GLN and the GLS temperature in each of the three Planck bands are shown in Fig. 2. As one can see (in blue), the GLN region is hotter than the GLS region by about 13 μK at 70 GHz, 17 μK at 100 GHz and 20 μK at 143 GHz (in blue in the histogram). This results, most likely, from a Doppler-induced effect related to the bulk velocity of the jet powering the Cen A radio lobes and/or to their rotation with respect to an axis directed along the east-west direction.
To test whether the temperature asymmetry we see is real or can be explained as a random fluctuation of the CMB signal (which is very patchy), we consider 360 control field regions with the same shape as the GLN and GLS regions and at the same latitude, but at 1° longitude from each other. For each region, we determined the excess temperature profile and calculated the average profile and corresponding standard deviation. The results obtained are shown in brown in the histogram in Fig. 2. As one can see, the temperature asymmetry in the 360 control fields at 100 and 143 GHz is the opposite of that toward Cen A with the southern field generally hotter than the northern field (in the 70 GHz band the temperature asymmetry of the control fields is substantially smaller with respect to that toward the Cen A lobes). This trend for the 360 control fields is easily understandable, since the Galactic latitude of the southern lobes is 14°–19° (the center of Cen A is at latitude b = 19.473°), and at these latitudes the foregrounds due to our Galactic disk is non-negligible. Indeed, since the Cen A giant lobes happen to be aligned in the sky almost orthogonal to the Milky Way, the southern lobe has to be more contaminated by the disk’s radiation than the northern lobe. We also stress that the procedure we followed to test the observed effect, that is, considering the 360 control regions, is more reliable than simulating the CMB sky maps in each band considered. While the latter methodology of generating sky maps to estimate the error bars is mandatory in dealing with the whole sky (as in cosmological studies), in our case we are only considering somewhat small regions of the Planck sky maps and the adopted procedure is more reliable since it avoids the simulation ambiguities.
In Fig. 3 the analysis of the temperature asymmetry between the GLN and GLS of Cen A within three different galactocentric radii (1.5°, 2.8°, and 4.0°, corresponding to about 92 kpc, 171 kpc, and 245 kpc, respectively) is presented. It is clear that the temperature asymmetry diminishes as increasing the field region area. The radial dependence of the temperature asymmetry in the three Planck bands considered might be indicative of different emission mechanisms in the microwaves at different galactocentric distances, even if the quality of the present data cannot allow us to draw a definitive conclusion in this respect.
3. Conclusions
As discussed in the previous section, we have considered Planck 2015 release data in the bands at 70, 100, and 143 GHz, and detected a temperature asymmetry between the GLN and the GLS of the Cen A system. No detection of the Cen A giant lobes has previously been obtained in the microwave regime at frequencies higher than 60 GHz (Hardcastle et al. 2009). In particular, the GLN appears substantially hotter than the GLS up to a galactocentric distance of about 5°. The temperature asymmetry is present in all the bands considered and decreases from the innermost region (i.e., about 70 μK at 70 GHz within 1.5° from the Cen A center) to about 14 μK at 70 GHz within 4° from the galaxy center. What we find seems to confirm what is known from radio observations about the emission direction and motion of the Cen A jet and inner northern and southern lobes.
Since the Cen A giant lobes happen to be aligned in the sky almost orthogonal to the Galactic disk, as mentioned, the southern lobe has to be more contaminated by the disk’s radiation than the northern lobe, giving an effect opposite to that observed toward the Cen A lobes. This fact is reflected in the behavior of the mean temperature asymmetry, including the band dependence, of the 360 control regions. Hence, in view of Galactic contamination, the genuine Cen A temperature contrast has to be even stronger. Moreover, since we are not dealing with the absolute, but only with the mean temperature differences, the role of the various noise sources is vanishing. This is similar to the case of the CMB dipole, where the temperature difference indicates the motion of the observer.
In general, the observation of the Cen A temperature asymmetry may be explained by one (or more) of the following astrophysical emission mechanisms: (i) free-free emission; (ii) synchrotron emission; (iii) anomalous microwave emission (AME) from dust grains; (iv) the kinetic Sunyaev-Zel’dovich (SZ) effect, and (v) cold gas clouds populating the outer regions of Cen A (as first proposed, in the context of the M 31 halo, by De Paolis et al. 1995). A detailed study of what each of these five possible causes might contribute, using all the Planck bands to constrain the model parameters and the relative weight of these five models, will be published elsewhere. Here, we only note that effects (i)–(iii) are strongly wavelength dependent at microwave frequencies; see, e.g., Bennett (2003), Planck Collaboration XII (2013). However, mechanisms (iv) and (v) are almost independent of the observation band in the microwave regime. The AME (item iii) has been observed in various interstellar environments, in particular, in the diffuse ISM (Miville-Deschênes et al. 2008) and in dark clouds (Watson et al. 2005), and might also play a role in Galactic halo environments, provided dust grains are present3.
As a matter of fact, and irrespective of the physical emission mechanisms, the detected mean temperature asymmetry has to indicate the line-of-sight motion of the lobes. In the viewing geometry, a GLN that is hotter than the GLS would be caused by the direction of the powering jets, as also suggested by observations in other wavelengths (see, e.g., the discussion in the Introduction), and a Doppler induced effect due to the rotation of the giant radio lobes with respect to an axis directed along the east-west direction would contribute an effect similar to that observed toward the halo of the M 31 galaxy (De Paolis et al. 2011, 2014). Although the resolution of this issue is not the aim of the present Letter, we shall give some possible hints in the following. The rotation of NGC 5128 and its halo has been investigated by studying the velocity distribution of more than 400 planetary nebulae within a galactocentric distance of about 20′ (≃20 kpc). In particular, Hui et al. (1995) found that the NGC 5128 rotation axis is offset from its photometric minor axis by about 39°. It was also found that the planetary nebulae ordered motions become more important with respect to their random motions at larger galactocentric radii, with the rotation component reaching about 100 km s-1 and 50 km s-1 along the photometric major and minor axes, respectively.
The kinematics of the globular clusters around Cen A gives a similar indication, in particular with the metal rich globular clusters showing both major and minor axis rotation (Hui et al. 1995). This was also confirmed by a more recent analysis by Woodley et al. (2010), who considered a sample of 605 globular clusters extending up to a galactocentric distance of about 45′. It was found that the metal rich globular clusters are rotating with an ordered speed of 43 km s-1, while the metal poor globular clusters have a very mild rotation signature of ≃26 km s-1. We independently analyzed the radial velocity measured in the globular cluster sample in Woodley et al. (2010) and Peng et al. (2004). After removing the innermost globular clusters (within a galactocentric radius of about 4′), we found that those in the northern lobe (with declination δ ≥ −42.57°) have radial velocity 470 ± 143 km s-1, while those in the southern lobe (with δ ≤ −43.04°) have radial velocity 580 ± 148 km s-1. This seems to indicate that there is a regular rotation component at least of the innermost side of the Cen A lobes.
We would also like to mention that this kind of mean temperature asymmetry method first applied to study the M 31 galaxy (De Paolis et al. 2011, 2014), applied here to the giant radio lobes of Cen A, can become a conventional tool for studying of internal motions, especially toward nearby galaxies, in the microwaves. As for the case of the SZ effect or, e.g., for the Kolmogorov stochasticity parameter (Gurzadyan et al. 2009, 2014, and references therein), software for an automatic analysis by correlating galaxy surveys and CMB data may be developed.
The detected Cen A temperature asymmetry and especially its increase at small radii outline the picture of continuous ejections from a center that is rotating, and upon the increase of the size of the lobes, the effect of differential rotation becomes noticeable. Moreover, as one can see from Fig. 3, the temperature asymmetry within 1.5° tends to decreases from the 70 GHz band to the 143 GHz band, while it goes in the opposite directions at outer radii. This trend, if confirmed, seems to indicate that the dominant emission mechanism at CMB frequencies changes somewhere in between 1.5° and 2.8°, which is between about 92 kpc and 170 kpc.
Understanding the reason for the Cen A temperature asymmetry, that is if it is dominantly due to the ejection direction of the jets or to the rotation of the inner and outer lobes, is of particular importance since it can throw light on the formation history and timescale evolution of this system and may allow us to get closer to the solution of the many unresolved questions about Cen A’s giant radio lobes (see, e.g., Eilek 2014). To this aim, we suggest a future analysis in the radio band, at 21 cm, similar to that done by Chemin et al. (2009) and Corbelli et al. (2010) for the disk of the M 31 galaxy with the aim of tracking a radial velocity map of the outer regions of the Cen A system.
The standard error has been calculated as the standard deviation of the excess temperature distribution divided by the square root of the pixel number in each region. We have verified that within the errors, the sigma values calculated in that way are consistent with those evaluated by using the covariance matrix obtained by a best-fitting procedure with a Gaussian to the same distribution.
Acknowledgments
We acknowledge the use of Planck’s data in the Legacy Archive for Microwave Background Data Analysis (LAMBDA) and HEALPix (Górski et al. 2005) package. We thank L. Chemin for fruitful discussion. F.D.P., A.A.N., and G.I. acknowledge the support by the INFN project TAsP, and P.J. acknowledges support from the Swiss National Science Foundation.
References
- Bennett, C. L. 2003, ApJ, 148, 97 [Google Scholar]
- Bolton, J. G. 1948, Nature, 161, 141 [NASA ADS] [CrossRef] [Google Scholar]
- Burigana, C., Davies, R. D., De Bernardis, P., et al. 2013, Intern. J. Mod. Phys., 22, 1330011 [Google Scholar]
- Burns, J. O., Feigelson, E. D., & Schreier, E. J. 1983, ApJ, 273, 128 [NASA ADS] [CrossRef] [Google Scholar]
- Chemin, L., Carignan, C., & Foster, T. 2009, ApJ, 705, 1395 [NASA ADS] [CrossRef] [Google Scholar]
- Clarke, D. A., Burns, J. O., and Norman, M. L. 1992, ApJ, 395, 444 [NASA ADS] [CrossRef] [Google Scholar]
- Corbelli, E., Lorenzoni, S., Walterbor, R., et al. 2010, A&A, 511, A89 [NASA ADS] [CrossRef] [EDP Sciences] [Google Scholar]
- De Paolis, F., Ingrosso, G., Jetzer, Ph., et al. 1995, A&A, 299, 647 [NASA ADS] [Google Scholar]
- De Paolis, F., Gurzadyan, V. G., Ingrosso, G., et al. 2011, A&A, 534, L8 [NASA ADS] [CrossRef] [EDP Sciences] [Google Scholar]
- De Paolis, F., Gurzadyan, V. G., Nucita, A. A., et al. 2014, A&A, 565, L3 [NASA ADS] [CrossRef] [EDP Sciences] [Google Scholar]
- Eilek, J. A. 2014, New J. Phys., 16, 045001 [NASA ADS] [CrossRef] [Google Scholar]
- Górski, K. M., Hivon, E., Banday, A. J., et al. 2005, ApJ, 622, 759 [NASA ADS] [CrossRef] [Google Scholar]
- Gurzadyan, V. G., Allahverdyan, A. E., Ghahramanyan, T., et al. 2009, A&A, 497, 343 [NASA ADS] [CrossRef] [EDP Sciences] [Google Scholar]
- Gurzadyan, V. G., Kashin, A. L., Khachatryan, H. G., et al. 2014, A&A, 566, A135 [NASA ADS] [CrossRef] [EDP Sciences] [Google Scholar]
- Hardcastle, M., Cheung, C., Feain, I., & Stawarz, L. 2009, MNRAS, 393, 1041 [NASA ADS] [CrossRef] [Google Scholar]
- Harris, G. L. H., Rejkuba, M., & Harris, W. E. 2010, PASA, 27, 457 [NASA ADS] [CrossRef] [Google Scholar]
- Hui, X., Ford, H. C., Freeman, K. C., & Dopita, M. A. 1995, ApJ, 449, 592 [NASA ADS] [CrossRef] [Google Scholar]
- Israel, F. P. 1998, A&ARv, 8, 237 [NASA ADS] [CrossRef] [Google Scholar]
- Karovska, M., Fabbiano, G., Nicastro, F., et al. 2002, ApJ, 577, 114 [NASA ADS] [CrossRef] [Google Scholar]
- Marconi, A., Pastorini, G., Pacini, F., et al. 2006, A&A, 448, 921 [Google Scholar]
- Meier, D. L., Jauncey, D. L., Preston, R. A., et al. 1989, AJ, 98, 27 [NASA ADS] [CrossRef] [Google Scholar]
- Miville-Deschênes, M. A., Ysard, N., Lavabre, A., et al. 2008, A&A, 490, 1093 [NASA ADS] [CrossRef] [EDP Sciences] [Google Scholar]
- Neff, S. G., Eilek, J. A., & Owen, F. N. 2015, ApJ, 802, 88 [NASA ADS] [CrossRef] [Google Scholar]
- Neumayer, N. 2010, PASA, 27, 449 [NASA ADS] [CrossRef] [Google Scholar]
- Peng, E. W., Ford, H. C., Freeman, K. C., et al. 2004, ApJS, 150, 367 [NASA ADS] [CrossRef] [Google Scholar]
- Planck Collaboration XII. 2014, A&A, 571, A12 [NASA ADS] [CrossRef] [EDP Sciences] [Google Scholar]
- Planck Collaboration I. 2015, A&A, submitted [arXiv:1502.01582] [Google Scholar]
- Planck Collaboration XVI. 2015, A&A, submitted [arXiv:1506.07135] [Google Scholar]
- Silge, J. D., Gebhardt, K., Bergmann, M., & Richstone, D. 2005, AJ, 130, 406 [NASA ADS] [CrossRef] [Google Scholar]
- Tingay, S. J., Preston, R. A., & Jauncey, D. L. 2001, AJ, 122, 1697 [NASA ADS] [CrossRef] [Google Scholar]
- Watson, R. A., Rebolo, R., Rubino-Martin, J. A., et al. 2005, ApJ, 624, L89 [NASA ADS] [CrossRef] [Google Scholar]
- Woodley, K. A., Gómez, M., Harris, W. E., Geisler, D., & Harris, G. L. H. 2010, AJ, 139, 1871 [NASA ADS] [CrossRef] [Google Scholar]
All Figures
|
Fig. 1 Planck fields toward Cen A galaxy in which our analysis is performed are shown. The radius of the outer circle is of 5° about the NGC 5128 center (with Galactic coordinates l = 309.52°, b = 19.42°). The northern field (with 10792 pixels), corresponding to the GLN radio lobe, has Galactic coordinates 308.65° ≤ l ≤ 311.03 and 19.64° ≤ b ≤ 23.92°, while those of the southern field (which has 11011 pixels), corresponding to the GLS, are 307.98° ≤ l ≤ 310.64 and 15.58° ≤ b ≤ 19.14°. |
| In the text | |
|
Fig. 2 Excess temperature in μK (in blue) of the northern Cen A lobe with respect to the southern lobe are given in the 70 GHz, 100 GHz, and 143 GHz Planck data. In brown we give the temperature excess of 360 control regions equally spaced at one degree distance to each other in Galactic longitude and at the same latitude as NGC 5128. The standard errors are also shown. |
| In the text | |
|
Fig. 3 Excess temperature in μK (with the standard errors) of the northern Cen A lobe with respect to the southern lobe are given in the 70 GHz, 100 GHz, and 143 GHz Planck data up 1.5° (≃92 kpc), 2.8° (≃171 kpc) and 4.0° (≃245 kpc) from the galaxy center. |
| In the text | |
Current usage metrics show cumulative count of Article Views (full-text article views including HTML views, PDF and ePub downloads, according to the available data) and Abstracts Views on Vision4Press platform.
Data correspond to usage on the plateform after 2015. The current usage metrics is available 48-96 hours after online publication and is updated daily on week days.
Initial download of the metrics may take a while.