Fig. 2
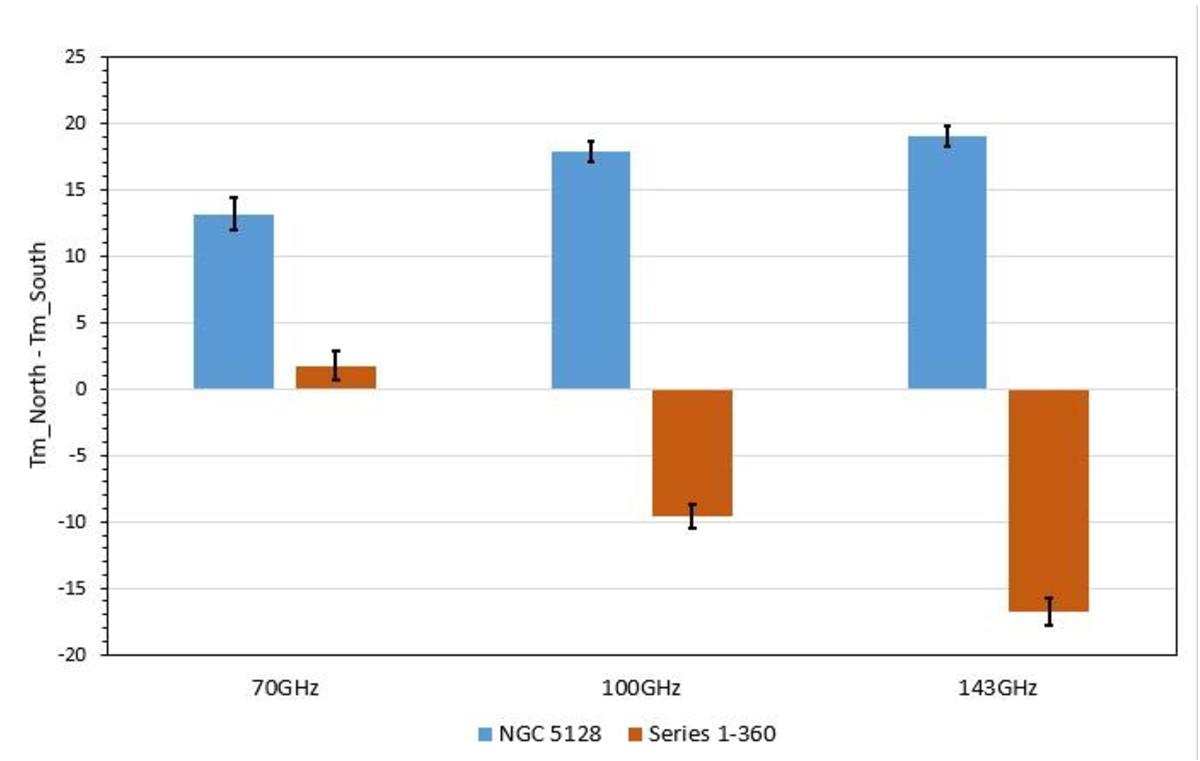
Excess temperature in μK (in blue) of the northern Cen A lobe with respect to the southern lobe are given in the 70 GHz, 100 GHz, and 143 GHz Planck data. In brown we give the temperature excess of 360 control regions equally spaced at one degree distance to each other in Galactic longitude and at the same latitude as NGC 5128. The standard errors are also shown.
Current usage metrics show cumulative count of Article Views (full-text article views including HTML views, PDF and ePub downloads, according to the available data) and Abstracts Views on Vision4Press platform.
Data correspond to usage on the plateform after 2015. The current usage metrics is available 48-96 hours after online publication and is updated daily on week days.
Initial download of the metrics may take a while.