| Issue |
A&A
Volume 580, August 2015
|
|
|---|---|---|
| Article Number | L12 | |
| Number of page(s) | 6 | |
| Section | Letters | |
| DOI | https://doi.org/10.1051/0004-6361/201424626 | |
| Published online | 14 August 2015 | |
Rotational modulation of the linear polarimetric variability of the cool dwarf TVLM 513−46546⋆
1 Instituto de Astrofísica de Canarias, Calle Vía Láctea s/n, 38205 La Laguna, Spain
e-mail: pamp@iac.es; epalle@iac.es
2 Dpt. de Astrofísica, Univ. de La Laguna, Avda. Astrofísico Francisco Sánchez s/n, 38206 La Laguna, Tenerife, Spain
3 Centro de Astrobiología (CSIC-INTA), Carretera de Ajalvir km 4, 28850 Torrejón de Ardoz, Madrid, Spain
e-mail: mosorio@cab.inta-csic.es
Received: 17 July 2014
Accepted: 24 July 2015
Aims. We aim to monitor the optical linear polarimetric signal of the magnetized, rapidly rotating M8.5 dwarf TVLM 513−46546.
Methods. R- and I-band linear polarimetry images were collected with the Andalucía Faint Object Spectrograph and Camera (ALFOSC) instrument of the 2.56-m Nordic Optical Telescope (NOT) on two consecutive nights, covering about 0.5 and four rotation cycles in the R and I filters, respectively. We also obtained simultaneous intensity curves by means of differential photometry. The typical precision of the data is ±0.46% (R), ±0.35% (I) in the linear polarization degree and ±9 mmag (R), ±1.6 mmag (I) in the differential intensity curves.
Results. Strong and variable linear polarization is detected in the R and I filters, with values of maximum polarization (p∗ = 1.30 ± 0.35 %), that are similar for both bands. The intensity and the polarimetric curves present a sinusoid-like pattern with a periodicity of ~1.98 h, which we ascribe to structures in the surface of TVLM 513−46546 synchronized with its rotation. We found that the peaks of intensity and polarimetric curves occur with a phase difference of 0.18 ± 0.01 and that the maximum of the linear polarization occurs nearly half a period (0.59 ± 0.03) after the radio pulse. We discuss different scenarios to account for the observed properties of the light curves.
Key words: polarization / stars: low-mass / stars: late-type / stars: individual: TVLM 513−46546 / scattering
Appendix A is available in electronic form at http://www.aanda.org
© ESO, 2015
1. Introduction
The M8.5 dwarf TVLM 513−46546 (TVLM 513−46; Tinney et al. 1993) is one of the most studied ultracool dwarfs in the literature. With a trigonometric distance of 10.76 ± 0.03 pc (Forbrich et al. 2013), an effective temperature (Teff) of 2175 ± 150 K, a luminosity of log (L/L⊙) = − 3.59 ± 0.02 dex (Golimowski et al. 2004), and a lack of Li at 670.8 nm (Martin et al. 1994; Reid et al. 2002), the models of Baraffe et al. (2003) constrain the mass of TVLM 513−46 to the range 0.06 − 0.08 M⊙ and its radius to 0.1 R⊙ for ages older than 0.5 Gyr. It shows Hα in emission that changes moderately with time, which suggests some chromospheric activity (Reid et al. 2002). From its high projected rotation velocity (v sin i = 60 ± 2 km s-1; Mohanty & Basri 2003) and its rotation period (1.959574 ± 0.000002 h, Wolszczan & Route 2014), the inclination of its rotation axis is found to be  deg. The detection of radio emissions reveals a multipolar magnetic field with intensities as high as 3 kG (Hallinan et al. 2006; Berger et al. 2008). This magnetic field and the detection of optical variability have led to a wide discussion of which physical scenario is the one most likely to explain its variability: magnetic spots or dust clouds (Lane et al. 2007; Littlefair et al. 2008; Berger et al. 2008; Harding et al. 2013)?
Because the identification of this scenario is ambiguous, additional observational parameters, which add new information about this object’s atmosphere, are necessary. In particular, the amount of linear polarization experienced by the light emitted and/or scattered toward a distant observer, and its variability, could be a very powerful investigative tool. In this work, we present our R- and I-band monitoring of the intensity and linear polarimetric properties for TVLM 513−46 to try to shed more light on the physical processes responsible for the optical modulation.
2. Observations
We collected R (λc = 631 nm) and I band (λc = 810 nm) linear polarimetry images from TVLM 513−46 using the ALFOSC mounted on the 2.56 m NOT on 2013 May 18 and 19. The target was monitored over ~3.5 and ~4.2 h (I band) during the first and second nights, and over ~1 h (R band) during the second night. We thus covered ~4 rotation cycles in the I filter and half a rotation cycle in the R band with a typical cadence of 6.2 and 9.6 min. Using these data, we also retrieved the R- and I-band intensity curves of TVLM 513−46 by means of differential photometry and by combining the polarimetric ordinary and extraordinary rays. The star 2MASS J15011008+2250069 (2.05 mag brighter in I and located near our target) acted as the reference/comparison source. The detailed description of the observing strategy, instrumental configuration, and data reduction is provided in Appendix A. The normalized Stokes parameters q and u, the degree of linear polarization (P), and the polarization vibration angle (Θ) were derived using the flux-ratio method and equations 1−4 from Zapatero Osorio et al. (2005). The final data have typical uncertainties as follows: ±0.46% (R) and ±0.35% (I) in P, ±9° in Θ, and ±3.4 mmag (I, first night), ±1.6 mmag (I, second night) and ±9 mmag (R) in the differential intensity curves. Figure 1 illustrates the I-band q − u plane obtained using the second observing night measurements. We focus on these data because they have better quality by a factor of two than the photometry of the first night (see also Fig.2). This allows us to study the details of the polarimetric light curve of TVLM 513−46. The data of the first observing night are presented in Fig.2 and Appendix A; they support our findings within the quoted error bars.
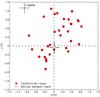 |
Fig. 1 Stokes q − u plane for the I-band measurements of TVLM 513−46 (red circles) taken during the second night of observations. Instrumental polarization is shown with a white circle. The typical uncertainties in q and u are represented in the top left corner. |
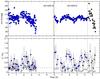 |
Fig. 2 Differential intensity (top) and debiased linear polarimetry (bottom) curves of TVLM 513−46 taken on 2013 May 18 (left) and 19 (right). The vertical dashed lines separate the I (blue circles) and the R-band data (gray circles). TVLM 513−46 is shown with solid dots. Bottom panel: reference star with white triangles and no error bars (for clarity). The horizontal dashed line stands for the upper limit on instrumental polarization. Zero time corresponds to Julian dates of 2 456 431.5734 (2013 May 18) and 2 456 432.4922 (2013 May 19). |
3. Light curves
Figure 2 (top panel) illustrates the R- and I- band differential intensity curves of TVLM 513−46 as a function of time. The photometry exhibits sinusoidal variability; a Lomb-Scargle periodogram of our curves1(Scargle 1982) shows a peak at 1.9 ± 0.4 h (Fig. A.3), which fully agrees with the period reported by other groups (Wolszczan & Route 2014, and references therein) and confirms the stable periodic variability status of TVLM 513−46. This period probably reflects the rotational modulation of TVLM 513−46. The error bar of ±0.4 h was determined as the full width at half maximum of the 1.9 h peak of the periodogram. The I-band amplitudes of the differential intensity curves are measured at ~4.9 mmag (first night) and ~3.9 mmag (second night), which are half-way between those given for filters of related wavelengths by Lane et al. (2007) and Littlefair et al. (2008). Our measurements support the changing amplitudes of the observed sinusoidal variations with time. Because the periodicity is constant, this suggests that the intensity and/or size of the feature responsible for the variations is also changing (see also Harding et al. 2013).
The bottom panel of Fig. 2 depicts the evolution of the R- and I-band linear polarimetry of TVLM 513−46. Because of the better S/N of the second night photometry, the modulation of the polarimetric light curve becomes apparent in the right panel. Values between zero and strong linear polarization of p∗ ≈ 1.30% ± 0.35% are seen at the two wavelengths of our study. As a consistency check, we also derived the linear polarimetry photometry of the reference star in the same manner as for the target. These measurements are included in Fig. 2 (bottom panel) and uniformly lie below the upper limit on the instrumental polarization, as expected for an unpolarized source. Because the reference star is located at a projected separation of ~27′′ from our dwarf, we concluded that the observed high linear polarization is intrinsic to TVLM 513−46 and is not due to an interloper cloud. Furthermore, the dwarf lies at a distance of 10.76 ± 0.03 pc (Forbrich et al. 2013) in a direction with negligible extinction by the interstellar medium. The solar vicinity (≤25 pc) shows very little linear polarization (less than 0.0004% per parsec, Piirola 1977). Only at distances ≳70 pc does interstellar polarization becomes non-negligible (Tamburini et al. 2002).
Interestingly, the maximum polarization signal of TVLM 513−46 is similar for both the R and I filters, although we caution that the R-band observations are not simultaneous with the I band and that the former data cover only a fraction of the rotation period. The Lomb-Scargle periodogram of the I-band linear polarimetry light curve shows a peak at ~2 h (Fig. A.3) with a confidence of 83%. This agrees with the periodicity previously derived from the intensity curve and with the very precise rotation periods given by Harding et al. (2013) and Wolszczan & Route (2014). A similar Lomb-Scargle analysis of the polarimetric photometry of the reference star yielded no significant peaks at around 2 h. Our data indicate that TVLM 513−46 is linearly polarized and that the intensity of the polarization changes with a periodicity compatible with the dwarf’s rotation.
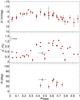 |
Fig. 3 I-band differential intensity (top), linear polarimetry (middle), and polarization vibration angle (bottom) curves folded in phase using a periodicity of 1.9798 h. In the top panel, each data point stands for the average of four individual measurements and its associated dispersion. In the bottom panel, Θ is plotted for P/σP ≥ 2.7. Two phases are presented for clarity. The green triangle stands for a J band measurement taken from Miles-Páez et al. (2013) |
The intensity and linear polarimetry light curves of the M8.5 dwarf are folded in phase using a period of 1.9798 h in Fig. 3 (and in Fig. A.4 for the data of both nights). Despite the short-time coverage of the R-band observations and their relatively large associated uncertainty, our data indicate that the intensity variations in the R and I wavelengths are correlated (Fig. A.4), as opposed to the anti-phased g and i light curves discussed by Littlefair et al. (2008). The previous J-band (1.2 μm) linear polarimetry measurement by our group (Miles-Páez et al. 2013) is also included. It was taken 3.7 months prior to the ALFOSC observations. To improve the S/N of the I-band intensity data and to equalize the time sampling of both light curves, we plot the average of four individual data points in the top panel. Within the observed scatter, the intensity and polarimetric light curves exhibit sinusoid-like variations, which we ascribe to large-scale structures in the dwarf’s surface that move with rotation. One striking property of the linear polarimetry light curve is that the maximum of the I-band linear polarization occurs after the peak of the intensity curve. By applying simple sinusoidal fits to the data, we found that both peaks are phase-shifted by 0.18 ± 0.01 or about 21 min. Wolszczan & Route (2014) reported that the radio emission bursts of TVLM 513−46 are detected 0.41 ± 0.02 of the period earlier than the peak of the intensity curve, which indicates the dipolar nature of the magnetic field and the inclination of the magnetic field with respect to the rotation axis (Berger et al. 2009). Therefore, there is a delay of nearly half a rotation (0.59 ± 0.03) between one burst in the radio emission of the M8.5 dwarf and its I-band polarization maximum.
The highest I-band linear polarization degrees take place during phases ~0.4 through ~0.8, while the intensity light curve keeps decreasing toward the minimum brightness (top and middle panels of Fig. 3). The polarization vibration angle is shown folded in phase in the bottom panel of Fig. 3. With few exceptions, all I-band measurements are consistent with the mean value of Θ = 31° ± 10°, and so we do not determine any particular pattern in the distribution of Θ, given the precision of the data. Furthermore, the I- and J-band polarization angles are compatible at the 1σ with the quoted uncertainties, which suggests the small amount of dependence of Θ on wavelength and/or the stability of the polarizing feature for at least 3.7 months.
4. Interpretation
The shape and characteristics of the polarimetric and intensity light curves of TVLM 513−46, combined with other well-known properties of the M8.5 dwarf, may provide evidence of the physical origins of its linear polarization. Because of the coincidental periodicities between the two data sets, it is likely that the polarimetric variability is related to structures that spin with the dwarf’s rotation. For example, a (cloudy or magnetic) spot on the dwarf’s surface can change the intensity curve in a periodic manner, which will also be reflected in the polarization. Next, we discuss the following linear polarization mechanisms: Magnetic Zeeman splitting, scattering processes by electrons and by dusty particles, and dichroic extinction.
TVLM 513−46 harbors a large-scale, steady magnetic field, which is responsible for the observed radio emission (Hallinan et al. 2006; Berger et al. 2008). Ménard et al. (2002) and Ménard & Delfosse (2004) studied 21 M1−L5 dwarfs located at distances of less than 32 pc, finding values of P ≲ 0.2% (R and I filters). We point out that some of the stars analyzed by these authors have magnetic fields with strengths of a few to several kG (Donati et al. 2006; Reiners & Basri 2007), similar in intensity to TVLM 513−46. Nevertheless, magnetic Zeeman broadening and splitting of individual lines due to species like FeH and CrH in very cool M and L dwarfs have been observed and modeled theoretically (e.g., Reiners & Basri 2006; Kuzmychov & Berdyugina 2013). This yields significant linear polarization as a function of the magnetic field strength at very specific wavelengths. When convolved with high rotation velocities and broad-band filters, the polarimetric signal is notoriously reduced but the net integration over broad bands may be different from zero, as pointed out by Kuzmychov & Berdyugina (2013). The I-band filter of our observations covers features due to Na i, TiO, VO, CrH, FeH, H2O, etc. in the wavelength interval 0.720−0.875 μm, some of which are magnetically sensitive; therefore, we cannot discard a small contribution of this effect to the observed polarization. However, it may contribute less than P ≈ 0.2%, as suggested by the observations of Ménard et al. (2002) and Ménard & Delfosse (2004). Since we detect very high values of linear polarization spanning over 40% of the rotation period, the Zeeman broadening and/or splitting due to a strong magnetic field is not sufficient to account for all of the observed optical linear polarization of TVLM 513−46.
In addition, the distribution of our polarimetric measurements in the q − u plane of Fig. 1 hints at polarizing mechanisms related to scattering processes. Such a distribution is reproduced by Clarke & McGale (1986), who modeled the polarimetric behavior of a globule of particles in orbit around a central unpolarized source using the Thompson scattering scenario (see their Figs. 3b and 5a). For an equator-on source and a cloud of particles located close to this region, the Stokes parameters describe a near circular pattern like that of Fig. 1 (also Fig. A.2). The q − u distribution shape changes significantly as a function of the location of the cloud across the disk of the source and the angle between the magnetic and rotational poles. The strong magnetic field of TVLM 513−46 reveals a surrounding envelope of low pressure electrons. Actually, the 100% circularly polarized radio pulses of the M8.5 dwarf are believed to be most likely caused by the electron-cyclotron maser instability (Hallinan et al. 2008), while the quiescent radio emission is probably due to gyrosynchrotron radiation. Our data are consistent with the R- and I-band linear polarization being triggered by the Thompson scattering of an assembly of free electrons in a similar manner to that which is observed in hot Be stars (e.g., Brown et al. 1978; Clarke & McGale 1986). Under this scenario, the electronic cloud must be located close to one radius of TVLM 513−46 to produce polarimetric variability synchronized with rotation. Yu et al. (2011) and Kuznetsov & Vlasov (2012) determined that the electron density is in the order of 105 cm-3 in the magnetosphere of TVLM 513−46, which is confined within two stellar radii according to Jaeger et al. (2011).
Dust, which is present in primordial and debris disks, can also act as an efficient polarizer. Infrared flux excesses provide evidence of any disks surrounding central objects. TVLM 513−46 does not appear to have clear flux excesses at 24 μm (Gautier et al. 2007), which therefore discards the existence of warm primordial and debris disks. In addition, the M8.5 dwarf has efficiently depleted lithium from its atmosphere (Reid et al. 2002), which indicates a minimum age of a few hundred Myr (also see Hallinan et al. 2008). Dust is also present in the photospheres of dwarfs cooler than Teff = 2700 K (e.g., Tsuji et al. 1996) as a result of the natural chemistry of low-temperature and high-gravity atmospheres that includes the condensation of refractory elements into liquid and solid particles. Based on a scenario of large rotation velocities (that induce oblate shapes) and/or inhomogeneous distributions of dusty clouds, Sengupta & Marley (2010) and Marley & Sengupta (2011) theoretically show that the net linear polarization of dusty dwarfs by single scattering processes can be as high as a few per cent at optical and near-infrared wavelengths. Miles-Páez et al. (2013, and references therein) provided observational proof of linear polarization detections in ultracool dwarfs. TVLM 513−46 has Teff = 2025 − 2480 K (Golimowski et al. 2004; Stephens et al. 2009) and a rapid rotation (1.96 h and v sin i = 60 km s-1); condensates (dust particles) are thus likely to be populating the upper (and coolest) atmospheric layers. If these particles are unevenly distributed across the atmosphere and/or aligned with the intense magnetic field, some linear polarimetry signal would be expected.
de Kok et al. (2011) modeled the near-infrared polarization of a rotating dwarf with a 20°× 20° dusty spot on its equator (Rayleigh scattering). They found a varying degree of polarization and vibration angle with amplitudes of ~0.6% and ~40° (λ = 1.11 μm) as the cloudy spot moves across the object’s visible disk with respect to the observer. As illustrated in Fig. 5 by de Kok et al. (2011), the degree of polarization has two maxima separated by a phase difference of 0.17 and a deep minimum in between just when the cloud lies along the line of sight. There is a hint of this feature at phase 0.5 in the middle panel of Fig. 3. Regarding Θ, the model predicts a sudden change in the angle within a phase difference of 0.055, which translates into 6.6 min in the case of the M8.5 dwarf. Our data do not have enough temporal sampling to test these predictions in p∗ and Θ. de Kok et al. (2011) also calculated the intensity curve caused by the equatorial dusty spot. It shows a mild peak at the same phase as the deep minimum between the two polarimetric maxima. Our TVLM 513−46 data do not recreate this signature since the maximum brightness of the I-band differential light curve and the deep minimum between the two maxima of the polarization curve are separated by ~0.15 of the rotation period. This phase difference might be explained by changing the geometry in which the grains are illuminated.
Finally, dichroic extinction by magnetically aligned nonspherical grains may lead to significant polarization (Davis & Greenstein 1951). This mechanism is believed to cause the interstellar polarization observed toward many stars in our Galaxy and has been used to map out the Galactic magnetic field (Mathewson & Ford 1970). In this scenario, the linear polarization of TVLM 513−46 would lie parallel to the magnetic field direction, which is 31 ± 10°. The periodic and sinusoid-like variation in p∗ would be caused by a cloud of aligned non-spherical grains rotating with the dwarf. The impact of convective motions and rapid rotation on such dusty clouds is not clear. Models of dichroic polarization particularized for ultracool dwarfs are required to explore this scenario further.
From our discussion it is clear that, with the present data, it is not possible to solve completely the origin of the observed optical linear polarization. To this end, follow-up observations taken at shorter and longer wavelengths and with a higher cadence would also be beneficial: on the one hand, the intensity of the dichroic polarization has a strong dependence on wavelength,
whereas the polarization vibration angle stays constant (Treanor 1963; Coyne 1974), and, on the other hand, linear polarization shows a moderate variation in wavelength, owing to other mechanisms. Additionally, polarimetric observations combined with other techniques to map out the presence of dusty clouds, such as the tomography of the surfaces (Crossfield et al. 2014) could be valuable tools for determining the geometry, distribution, and other properties of the clouds in the atmospheres of ultracool dwarfs, especially for those that do not harbor strong magnetic fields such as TVLM 513−46.
Online material
Appendix A: Observations and data reduction
We collected linear polarimetry images of TVLM 513−46 using the Andalucía Faint Object Spectrograph and Camera (ALFOSC) mounted on the 2.56 m Nordic Optical Telescope (NOT) on 2013 May 18 and 19. ALFOSC has a 2048 × 2048 E2V detector with a pixel size of 0.̋19. The target was monitored in the I band (λc = 810 nm) over ~3.5 and ~4.2 h during the first and second nights, and in the R band (λc = 631 nm) over ~1 h during the second night. We thus covered ~4 rotation cycles in the I band and half a cycle in the R band. Sky conditions were clear and seeing varied in the interval 1.̋1−1.̋5. Observations were carried out at air masses ranging from 1.05 through 2.34.
The linear polarimetry observing mode of ALFOSC consists of a half-wave plate and a calcite block, which provides simultaneous images of the ordinary and the extraordinary beams separated by 15′′. The total unvignetted field of view is 140′′ in diameter, which we rotated by 103° east of north to align TVLM 513−46 and a nearby, bright reference star along the y-axis of the detector, as indicated in Fig. A.1. Individual exposure times were 50 s (I, first night) and 100 s (R and I, second night) per position of the half wave plate (0°, 22.̊5, 45°, and 67.̊5). On May 18, polarimetric images were taken at two nod positions on the detector separated vertically by 10′′ for a proper sky subtraction. This nodding pattern was not applied on the following night since TVLM 513−46 is detected well above the sky contribution with a S/N of ~220 and ~300 (I band) in 50 s and 100 s individual integrations, respectively (S/N is measured at the peak of the energy distribution of the source images). One polarimetric cycle was completed every 6.2 min (I, first night) and 9.6 min (R and I, second night), including overheads. This allowed us to sample one rotation of TVLM 513−46 using a minimum of 12 and a maximum of 19 linear polarimetry measurements. Raw images were bias-subtracted and flat-field-corrected using data acquired during dawn and dusk and routines within IRAF1. We also observed non-polarized stars (GJ 838.4 and WD 1615−154, Fossati et al. 2007) and one polarized source (Hilter 997, Whittet et al. 1992) by employing the same instrumental configuration and doing so on the same observing dates as the target. This allowed us to check for the efficiency of the instrument and to set an upper limit on the instrumental polarization.
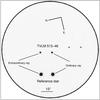 |
Fig. A.1 ALFOSC linear polarimetric I-band image of TVLM 513−46. The circle indicates the unvignetted area. |
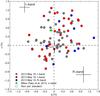 |
Fig. A.2 Stokes q − u plane for the R- and I-band measurements of TVLM 513−46, taken during first and second night of observations. Instrumental polarization is shown with a white circle. The typical uncertainties in q and u are indicated. |
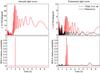 |
Fig. A.3 Top: Lomb-Scargle periodograms of the intensity (left) and polarimetric (right) light curves of TVLM 513−46 (red) and the reference star (black). Bottom: relative probabilities of the explored periods using a Bayesian formalism for the generalized Lomb-Scargle periodogram (see text). |
We derived the normalized Stokes parameters q and u, the degree of linear polarization (P), and the polarization vibration angle (Θ) using the flux-ratio method and equations 1−4 from Zapatero Osorio et al. (2005). The Stokes parameters and the angle Θ were properly corrected for the rotation of the field of view. Fluxes of all ordinary and extraordinary images were extracted by defining circular apertures ranging between 0.5 and 6 times the size of the full-width-at-half-maximum (FWHM) and using the PHOT package within IRAF. Sky annuli had inner radii ranging from 3.5 × to 6 × FWHM and widths of 1.5 × FWHM. The detailed procedure is described in Miles-Páez et al. (2013). Our final q, u, P, and Θ values result from averaging the aperture photometry in the interval 2−4 × FWHM; the errors associated with q and u are defined as the standard deviations of the measurements in the selected range of apertures; the errors in P are computed as the quadratic sum of the q and u quoted uncertainties plus the uncertainty introduced by a possible instrumental linear polarization (see below); and errors in Θ are determined following the equations given in Miles-Páez et al. (2013) and Wardle & Kronberg (1974). We caution that the expression for the Θ uncertainty is valid for P/σP ≥ 3, where σP is the error in linear polarimetry. Our linear polarimetric data of TVLM 513−46 have a typical uncertainty of ±0.46% (R) and ±0.35% (I) in P, and ±9° in Θ.
Using the observations of the zero-polarized standard stars, we checked that the instrumental polarization lies below 0.31% and 0.27% in the R- and I-bands. The polarized standard star allowed us to determine the zero point correction for the polarization vibration angle to be Θ°,R = 0.̊8 ± 2.̊8 and Θ°,I = 1.̊3 ± 3.̊0, which agrees with the values tabulated in the ALFOSC manual2. From now on, we shall use the debiased linear polarization degree, p∗, defined as  (A.1)which accounts for an overestimation of the polarization signal at low S/N or small values of P/σP(Wardle & Kronberg 1974). We set p∗ = P if σP ≥ P. In Figs.2, 3, and A.4, these polarimetric data are displayed with an associated arrow indicating that the true polarization index most likely lies between 0% and the symbol position. We note that the dispersion of consecutive Θ measurements is of the order of the uncertainty in the polarization vibration angle when P/σP> 2.7, which is close to the regime where the calculation of Θ has statistical significance (Wardle & Kronberg 1974). This provides support to our method for deriving the error bars associated with q, u, and P or p∗. The individual Stokes parameters values for the R and I filters are shown in the q − u plane of Fig. A.2.
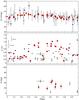 |
Fig. A.4 R and I band differential intensity (top), linear polarimetry (middle), and polarization vibration angle (bottom) curves folded in phase using a periodicity of 1.9798 h. Symbols as in Fig. A.2. In the top panel, each data point stands for the average of four individual measurements and its associated dispersion. In the bottom panel, Θ is plotted for P/σP ≥ 2.7. Two phases are presented for clarity. |
In addition to the linear polarimetric evolution, we retrieved the R- and I-band intensity curves of TVLM 513−46 by means of differential photometry. The star 2MASS J15011008+2250069 (2.05 mag brighter in I and located near our target) acted as the reference/comparison source. This is the only bright star in the ALFOSC field of view that was usable for the differential photometry technique (Fig. A.1). Because of its lower luminosity, the error bars in the differential intensity curves are dominated by the photon noise of TVLM 513−46. The typically 1.0 × FWHM-aperture fluxes of the ordinary and extraordinary images of TVLM 513−46 and its reference star were extracted with the VAPHOT package (Deeg & Doyle 2001), which works under the IRAF environment and is optimized for differential light curves. To build the intensity curves, ordinary and extraordinary fluxes were
combined per individual frame, which provides a time sampling four times higher than the cadence of the linear polarimetry data. We estimated the uncertainties in the differential light curves to be ±3.4 mmag (I band) for the first night photometry, and ±1.6 mmag (I) and ±9 mmag (R) for the second night data. We checked that the measured linear polarization degree and the differential intensity light curves do not correlate with airmass.
The Lomb-Scargle periodograms of the I band intensity and polarimetric light curves of TVLM 513−46 computed following Lomb (1976) and Scargle (1982) are illustrated in the top panels of Fig. A.3. The periodogram of the polarimetric light curve of the reference star is also included in the figure. We explored frequencies between ω = 2π/T and ω = 2No/T with a spacing of about 1 /T(Horne & Baliunas 1986), where No is the number of data points of the light curves (296 for the intensity curve, and 74 for the polarimetric curve), and T is the total time coverage of the data (26.4 h). We thus surveyed periods in the range 0.3−26.4 h using 433 and 88 independent frequencies for the intensity and polarimetric data, respectively. The confidence levels of the 2-h peaks were estimated using the false-alarm-probability (1−FAP) at 99% (intensity light curve) and 83% (polarimetry). The bottom panels of Fig. A.3 depict the relative probabilities according to the Bayesian formalism described in Mortier et al. (2015).
We used our own codes and the codes provided by the NASA exoplanet archive on: http://exoplanetarchive.ipac.caltech.edu/cgi-bin/Periodogram/nph-simpleupload
Acknowledgments
This work was based on observations made with the Nordic Optical Telescope (NOT) operated on the island of La Palma by the Nordic Optical Telescope Scientific Association (NOTSA) in the Spanish Observatorio del Roque de los Muchachos of the Instituto de Astrofísica de Canarias. This work is partly financed by the Spanish Ministry of Economics and Competitiveness through projects AYA2010-21308-C03-02, AYA2011-30147-C03-03, ESP2013-48391-C4-2-R and ESP2014-57495-C2-1-R.
References
- Baraffe, I., Chabrier, G., Barman, T. S., et al. 2003, A&A, 402, 701 [Google Scholar]
- Berger, E., Gizis, J. E., Giampapa, M. S., et al. 2008, ApJ, 673, 1080 [NASA ADS] [CrossRef] [Google Scholar]
- Berger, E., Rutledge, R. E., Phan-Bao, N., et al. 2009, ApJ, 695, 310 [NASA ADS] [CrossRef] [Google Scholar]
- Brown, J. C., McLean, I. S., & Emslie, A. G. 1978, A&A, 68, 415 [NASA ADS] [Google Scholar]
- Clarke, D., & McGale, P. A. 1986, A&A, 169, 251 [NASA ADS] [Google Scholar]
- Coyne, G. V. 1974, AJ, 79, 565 [NASA ADS] [CrossRef] [Google Scholar]
- Crossfield, I. J. M., Biller, B., Schlieder, J. E., et al. 2014, Nature, 505, 654 [NASA ADS] [CrossRef] [Google Scholar]
- Davis, Jr., L., & Greenstein, J. L. 1951, ApJ, 114, 206 [Google Scholar]
- Deeg, H. J., & Doyle, L. R. 2001, in Third Workshop on Photometry, eds. W. J. Borucki, & L. E. Lasher, 85 [Google Scholar]
- de Kok, R. J., Stam, D. M., & Karalidi, T. 2011, ApJ, 741, 59 [NASA ADS] [CrossRef] [Google Scholar]
- Donati, J.-F., Forveille, T., Collier Cameron, A., et al. 2006, Science, 311, 633 [NASA ADS] [CrossRef] [PubMed] [Google Scholar]
- Forbrich, J., Berger, E., & Reid, M. J. 2013, ApJ, 777, 70 [NASA ADS] [CrossRef] [Google Scholar]
- Fossati, L., Bagnulo, S., Mason, E., et al. 2007, in ASP Conf. Ser., 364, 503 [Google Scholar]
- Gautier, III, T. N., Rieke, G. H., Stansberry, J., et al. 2007, ApJ, 667, 527 [NASA ADS] [CrossRef] [Google Scholar]
- Golimowski, D. A., Leggett, S. K., Marley, M. S., et al. 2004, AJ, 127, 3516 [NASA ADS] [CrossRef] [Google Scholar]
- Hallinan, G., Antonova, A., Doyle, J. G., et al. 2006, ApJ, 653, 690 [NASA ADS] [CrossRef] [Google Scholar]
- Hallinan, G., Antonova, A., Doyle, J. G., et al. 2008, ApJ, 684, 644 [NASA ADS] [CrossRef] [Google Scholar]
- Harding, L. K., Hallinan, G., Boyle, R. P., et al. 2013, ApJ, 779, 101 [NASA ADS] [CrossRef] [Google Scholar]
- Horne, J. H., & Baliunas, S. L. 1986, ApJ, 302, 757 [NASA ADS] [CrossRef] [Google Scholar]
- Jaeger, T. R., Osten, R. A., Lazio, T. J., et al. 2011, AJ, 142, 189 [NASA ADS] [CrossRef] [Google Scholar]
- Kuzmychov, O., & Berdyugina, S. V. 2013, A&A, 558, A120 [NASA ADS] [CrossRef] [EDP Sciences] [Google Scholar]
- Kuznetsov, A. A., & Vlasov, V. G. 2012, A&A, 539, A141 [NASA ADS] [CrossRef] [EDP Sciences] [Google Scholar]
- Lane, C., Hallinan, G., Zavala, R. T., et al. 2007, ApJ, 668, L163 [NASA ADS] [CrossRef] [Google Scholar]
- Littlefair, S. P., Dhillon, V. S., Marsh, T. R., et al. 2008, MNRAS, 391, L88 [NASA ADS] [Google Scholar]
- Lomb, N. R. 1976, Ap&SS, 39, 447 [NASA ADS] [CrossRef] [Google Scholar]
- Marley, M. S., & Sengupta, S. 2011, MNRAS, 417, 2874 [NASA ADS] [CrossRef] [Google Scholar]
- Martin, E. L., Rebolo, R., & Magazzu, A. 1994, ApJ, 436, 262 [NASA ADS] [CrossRef] [Google Scholar]
- Mathewson, D. S., & Ford, V. L. 1970, MmRAS, 74, 139 [Google Scholar]
- Ménard, F., & Delfosse, X. 2004, in SF2A-2004, 305 [Google Scholar]
- Ménard, F., Delfosse, X., & Monin, J.-L. 2002, A&A, 396, L35 [NASA ADS] [CrossRef] [EDP Sciences] [Google Scholar]
- Miles-Páez, P. A., Zapatero Osorio, M. R., Pallé, E., et al. 2013, A&A, 556, A125 [NASA ADS] [CrossRef] [EDP Sciences] [Google Scholar]
- Mohanty, S., & Basri, G. 2003, ApJ, 583, 451 [NASA ADS] [CrossRef] [Google Scholar]
- Mortier, A., Faria, J. P., Correia, C. M., et al. 2015, A&A, 573, A101 [NASA ADS] [CrossRef] [EDP Sciences] [Google Scholar]
- Piirola, V. 1977, A&AS, 30, 213 [NASA ADS] [Google Scholar]
- Reid, I. N., Kirkpatrick, J. D., Liebert, J., et al. 2002, AJ, 124, 519 [NASA ADS] [CrossRef] [Google Scholar]
- Reiners, A., & Basri, G. 2006, ApJ, 644, 497 [NASA ADS] [CrossRef] [Google Scholar]
- Reiners, A., & Basri, G. 2007, ApJ, 656, 1121 [NASA ADS] [CrossRef] [Google Scholar]
- Scargle, J. D. 1982, ApJ, 263, 835 [NASA ADS] [CrossRef] [Google Scholar]
- Sengupta, S., & Marley, M. S. 2010, ApJ, 722, L142 [NASA ADS] [CrossRef] [Google Scholar]
- Stephens, D. C., Leggett, S. K., Cushing, M. C., et al. 2009, ApJ, 702, 154 [NASA ADS] [CrossRef] [Google Scholar]
- Tamburini, F., Ortolani, S., & Bianchini, A. 2002, A&A, 394, 675 [NASA ADS] [CrossRef] [EDP Sciences] [Google Scholar]
- Tinney, C. G., Mould, J. R., & Reid, I. N. 1993, AJ, 105, 1045 [NASA ADS] [CrossRef] [Google Scholar]
- Treanor, P. J. 1963, AJ, 68, 185 [NASA ADS] [CrossRef] [Google Scholar]
- Tsuji, T., Ohnaka, K., & Aoki, W. 1996, A&A, 305, L1 [NASA ADS] [Google Scholar]
- Wardle, J. F. C., & Kronberg, P. P. 1974, ApJ, 194, 249 [NASA ADS] [CrossRef] [Google Scholar]
- Whittet, D. C. B., Martin, P. G., Hough, J. H., et al. 1992, ApJ, 386, 562 [NASA ADS] [CrossRef] [Google Scholar]
- Wolszczan, A., & Route, M. 2014, ApJ, 788, 23 [NASA ADS] [CrossRef] [Google Scholar]
- Yu, S., Hallinan, G., Doyle, J. G., et al. 2011, A&A, 525, A39 [NASA ADS] [CrossRef] [EDP Sciences] [Google Scholar]
- Zapatero Osorio, M. R., Caballero, J. A., & Béjar, V. J. S. 2005, ApJ, 621, 445 [NASA ADS] [CrossRef] [Google Scholar]
All Figures
|
Fig. 1 Stokes q − u plane for the I-band measurements of TVLM 513−46 (red circles) taken during the second night of observations. Instrumental polarization is shown with a white circle. The typical uncertainties in q and u are represented in the top left corner. |
| In the text | |
|
Fig. 2 Differential intensity (top) and debiased linear polarimetry (bottom) curves of TVLM 513−46 taken on 2013 May 18 (left) and 19 (right). The vertical dashed lines separate the I (blue circles) and the R-band data (gray circles). TVLM 513−46 is shown with solid dots. Bottom panel: reference star with white triangles and no error bars (for clarity). The horizontal dashed line stands for the upper limit on instrumental polarization. Zero time corresponds to Julian dates of 2 456 431.5734 (2013 May 18) and 2 456 432.4922 (2013 May 19). |
| In the text | |
|
Fig. 3 I-band differential intensity (top), linear polarimetry (middle), and polarization vibration angle (bottom) curves folded in phase using a periodicity of 1.9798 h. In the top panel, each data point stands for the average of four individual measurements and its associated dispersion. In the bottom panel, Θ is plotted for P/σP ≥ 2.7. Two phases are presented for clarity. The green triangle stands for a J band measurement taken from Miles-Páez et al. (2013) |
| In the text | |
|
Fig. A.1 ALFOSC linear polarimetric I-band image of TVLM 513−46. The circle indicates the unvignetted area. |
| In the text | |
|
Fig. A.2 Stokes q − u plane for the R- and I-band measurements of TVLM 513−46, taken during first and second night of observations. Instrumental polarization is shown with a white circle. The typical uncertainties in q and u are indicated. |
| In the text | |
|
Fig. A.3 Top: Lomb-Scargle periodograms of the intensity (left) and polarimetric (right) light curves of TVLM 513−46 (red) and the reference star (black). Bottom: relative probabilities of the explored periods using a Bayesian formalism for the generalized Lomb-Scargle periodogram (see text). |
| In the text | |
|
Fig. A.4 R and I band differential intensity (top), linear polarimetry (middle), and polarization vibration angle (bottom) curves folded in phase using a periodicity of 1.9798 h. Symbols as in Fig. A.2. In the top panel, each data point stands for the average of four individual measurements and its associated dispersion. In the bottom panel, Θ is plotted for P/σP ≥ 2.7. Two phases are presented for clarity. |
| In the text | |
Current usage metrics show cumulative count of Article Views (full-text article views including HTML views, PDF and ePub downloads, according to the available data) and Abstracts Views on Vision4Press platform.
Data correspond to usage on the plateform after 2015. The current usage metrics is available 48-96 hours after online publication and is updated daily on week days.
Initial download of the metrics may take a while.