Fig. 2
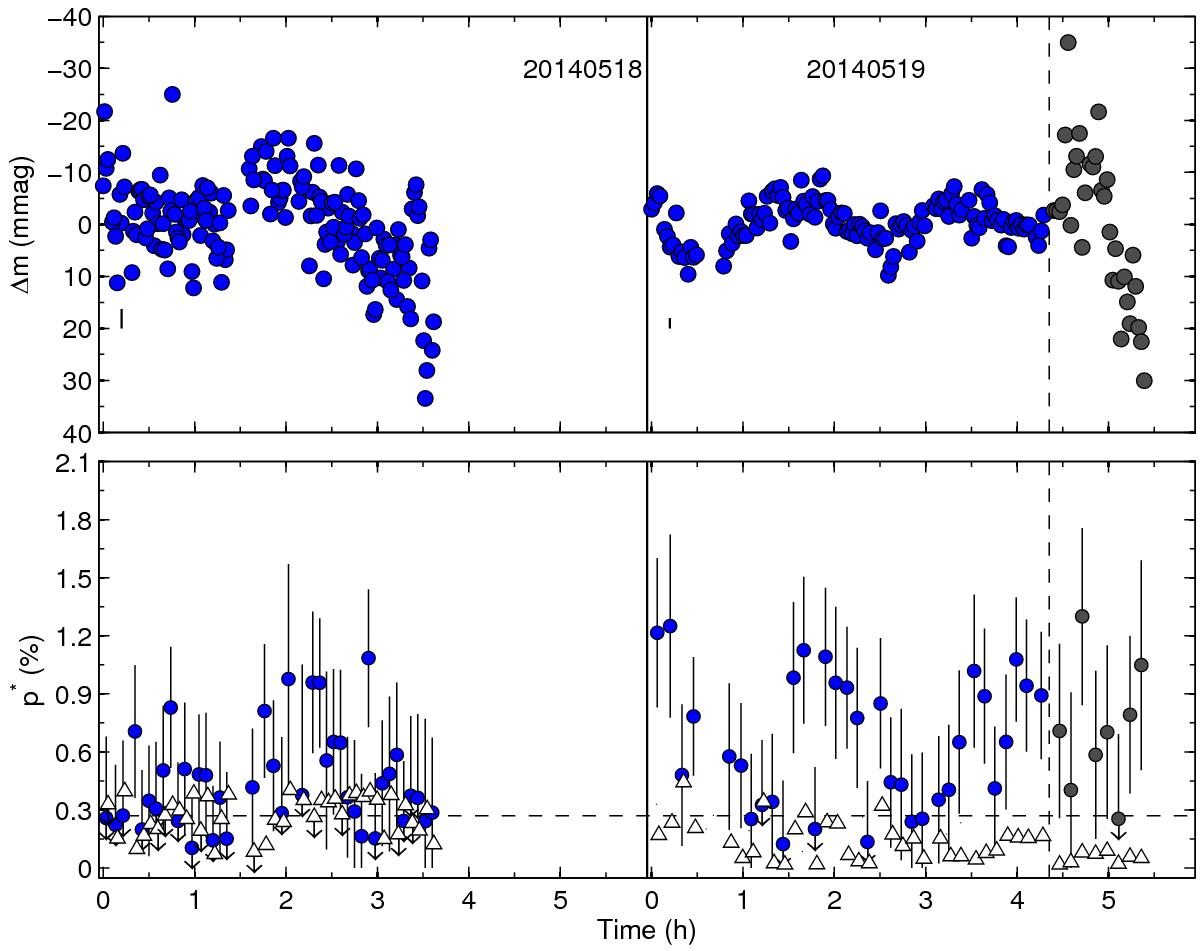
Differential intensity (top) and debiased linear polarimetry (bottom) curves of TVLM 513−46 taken on 2013 May 18 (left) and 19 (right). The vertical dashed lines separate the I (blue circles) and the R-band data (gray circles). TVLM 513−46 is shown with solid dots. Bottom panel: reference star with white triangles and no error bars (for clarity). The horizontal dashed line stands for the upper limit on instrumental polarization. Zero time corresponds to Julian dates of 2 456 431.5734 (2013 May 18) and 2 456 432.4922 (2013 May 19).
Current usage metrics show cumulative count of Article Views (full-text article views including HTML views, PDF and ePub downloads, according to the available data) and Abstracts Views on Vision4Press platform.
Data correspond to usage on the plateform after 2015. The current usage metrics is available 48-96 hours after online publication and is updated daily on week days.
Initial download of the metrics may take a while.