Fig. A.4
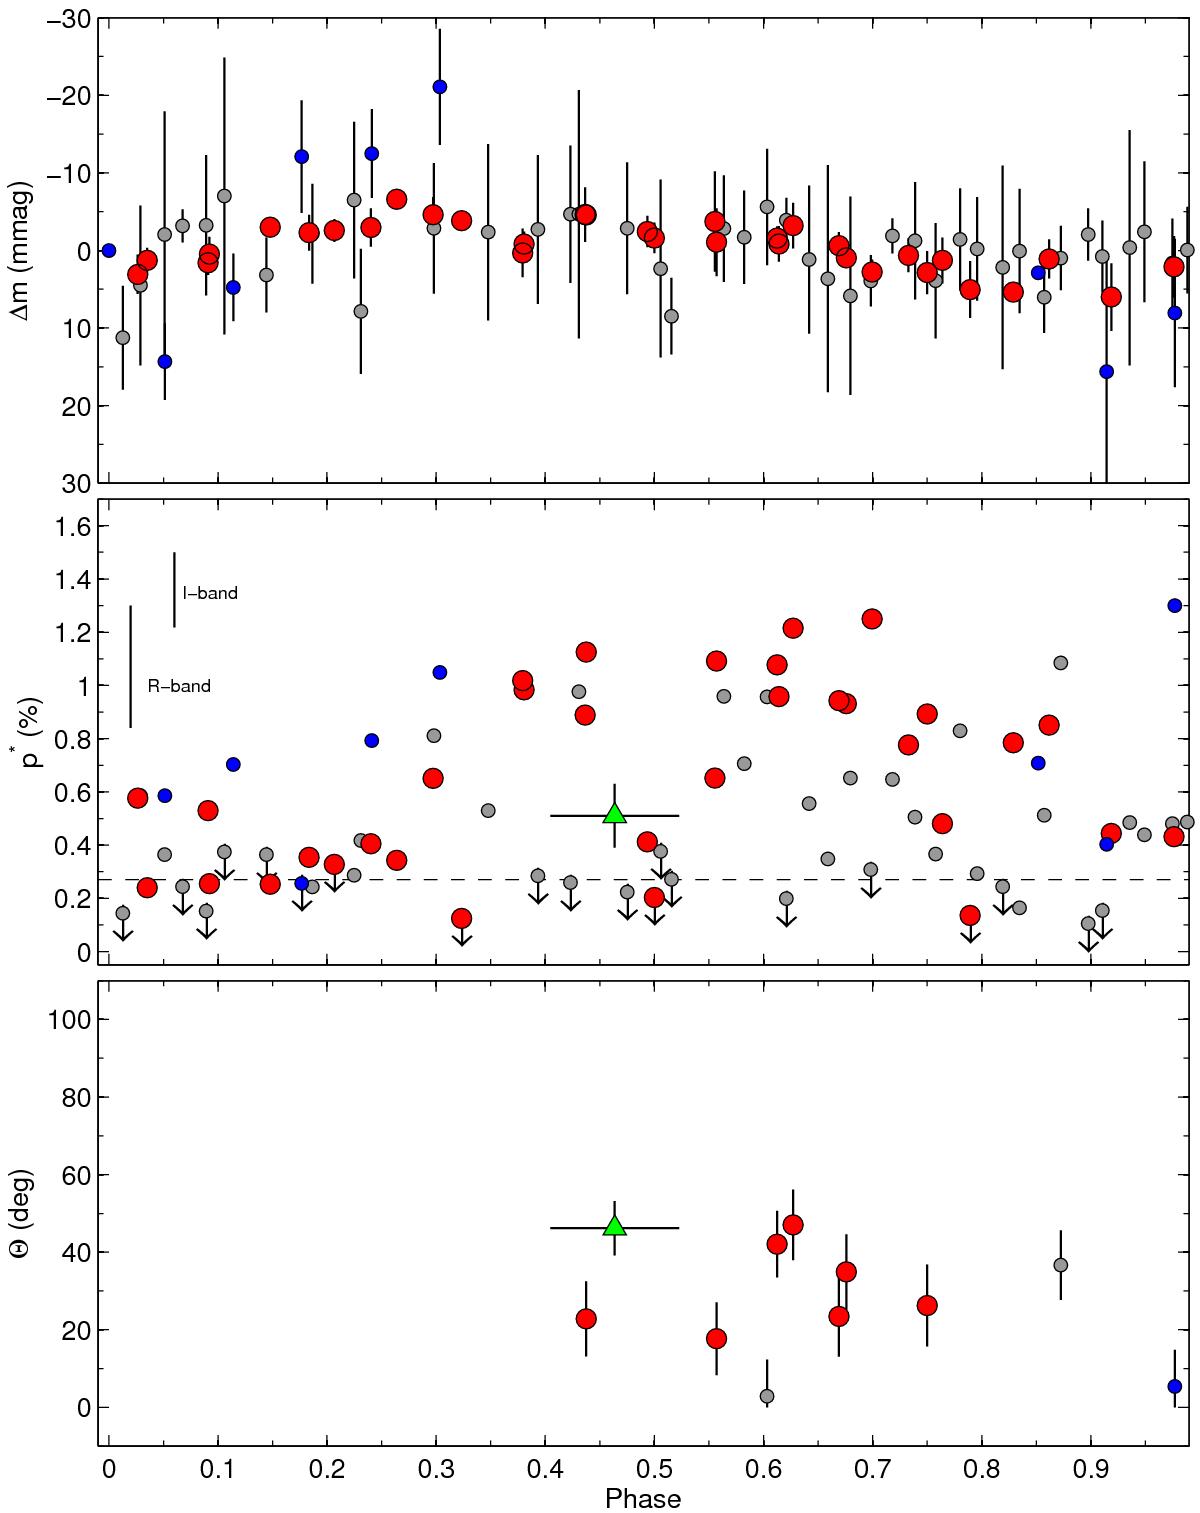
R and I band differential intensity (top), linear polarimetry (middle), and polarization vibration angle (bottom) curves folded in phase using a periodicity of 1.9798 h. Symbols as in Fig. A.2. In the top panel, each data point stands for the average of four individual measurements and its associated dispersion. In the bottom panel, Θ is plotted for P/σP ≥ 2.7. Two phases are presented for clarity.
Current usage metrics show cumulative count of Article Views (full-text article views including HTML views, PDF and ePub downloads, according to the available data) and Abstracts Views on Vision4Press platform.
Data correspond to usage on the plateform after 2015. The current usage metrics is available 48-96 hours after online publication and is updated daily on week days.
Initial download of the metrics may take a while.