| Issue |
A&A
Volume 580, August 2015
|
|
|---|---|---|
| Article Number | A25 | |
| Number of page(s) | 8 | |
| Section | The Sun | |
| DOI | https://doi.org/10.1051/0004-6361/201423389 | |
| Published online | 22 July 2015 | |
Abnormal rotation rates of sunspots and durations of associated flares
Indian Institute of Astrophysics, 560034
Bangalore, India
e-mail: This email address is being protected from spambots. You need JavaScript enabled to view it.
Received:
9
January
2014
Accepted:
26
May
2015
Abstract
Context. Short-duration and long-duration flares are important in terms of their association with coronal heating and coronal mass ejections, respectively. Sunspot motions in the photosphere have been known to be associated with flare occurrences.
Aims. We study the association between the abnormal rotation rates (longitudinal displacement in a given latitude in contrast with the rotation of spots around their umbral centre) of sunspots and flare duration.
Methods. We compute the rotation rates of sunspots for different days during their evolution. We consider rotation rates that are in excess of one standard deviation as abnormal rotation rates. Also, the duration of time between the initial and final stages of the flares are computed.
Results. Using Kodaikanal Observatory white light picture and GOES soft X-ray flare data, we find that a good association with a high significance exists between abnormal rotation rates of sunspots and flare durations. In contrast, we find that duration of flare is independent of sunspot area.
Conclusions. The present study suggests that sub-surface dynamics plays a dominant role in determining the duration and rate of dissipation of energy during flares.
Key words: sunspots / Sun: rotation / Sun: flares
© ESO, 2015
1. Introduction
Flares are often divided into two classes: impulsive flares and long-duration flares. Impulsive flares are short-duration flares in which the rise to peak flux emission is rapid. Skylab studies (Sheeley et al. 1983, and the references therein) discuss the concept of two distinct classes of X-ray flares: long-duration flares with coronal mass ejections (CME) association and short-duration flares with no CME association. Cane et al. (1986) classifies flares with greater than 10% of the peak intensity, which last for less than one hour, as short-duration events, and flares that last for more than one hour, as long-duration events. Szajko et al. (2013) consider flares greater than or equal to 0.3 h as long-duration events and those lasting less than 0.3 h as short-duration events. Cheng et al. (2011) have shown that the duration of flares not associated with CMEs vary between 9−40 min and flares with associated CMEs vary between 83−188 min. Though their sample size is rather modest, their study shows an unmistakable departure in the flare duration between flares associated with CMEs with those not associated with CMEs.
However, there is no consensus on the division of flares as short and long duration. Sheeley et al. (1983) conclude that the CME probability increases monotonically with the X-ray flare duration. Hence, it is clear that, irrespective of the classification issues, flares of different durations are important in terms of their association with different phenomena. Impulsive flares and flares without CMEs are important for their role in coronal heating (Hudson 1991; Yashiro et al. 2006). In a study by Szajko et al. (2013), which considered 20 events, the authors note that all CMEs are associated with long-duration flares with majority of flares lasting longer than five hours. The long-duration flare associated CMEs are accelerated until the height is greater than 5Rs (where Rs is one solar radius), which is a higher value than in typical impulsive CMEs (Bak-Steslicka et al. 2011). Several studies have shown that radio emission is mostly associated with CMEs that have higher speeds (Gopalswamy et al. 2005; Suryanarayana 2012; Szajko et al. 2013), which highlight the importance of long-duration flares. Chamberlin et al. (2012) have shown that the total radiated output of flare depends more on the flare duration than the typical GOES X-ray peak magnitude classification.
A study by Bein et al. (2012) notes that the time difference between the peak time of the flare soft X-ray (SXR) flux and the peak time of the CME acceleration is smaller than five minutes, which indicates a feedback relationship between the CME acceleration and the energy release in the associated flare. The long -duration flares are characterised by post flare loops and a double-ribbon structure (Rust et al. 1980). This type of structure is also an indication of the reconnecting field lines (Anzer & Pneuman 1982). At the same time, there is a strong view that filament or prominence eruptions, flares, and CMEs are the consequence of the dynamic evolution of the coronal magnetic field (Cheng et al. 2010, and references therein). Though there is a preponderance of CME association with long-duration flares, the association of a significant fraction of short-duration flares with CMEs raises questions on the phenomenon of magnetic reconnection as the only basis for long-duration flares. Also, there exists a lack of statistical evidence to explain the reconnection and feedback mechanism as well as its physical basis (Sheeley et al. 1983).
The mechanism that triggers a flare is increasingly known to be due to reconnection processes. However, the process leading to energy build-up that contributes to flare duration seems to lie in the photosphere and sub-photosphere, as indicated in several studies (Hiremath 2006; Hiremath & Suryanarayana 2003). Zirin & Lazaref (1975) reported the occurrence of a series of flares in association with the motion of a large new p spot with a speed of over 1000 km h-1. A few flares that lasted between 60 to 90 min have been reported in association with this motion. McIntosh (1969) showed that the separation of some sunspots decreased prior to a large proton flare and increased after the flare. Yan et al. (2012) studied the flare occurrence in association with the rapid decrease in the distance between the two small sunspots on October 21, 2003 in which the speeds of spots were about 4500 km h-1 and 3920 km h-1, for the positive and negative polarity spots, respectively. Jiang et al. (2012) reported a spot motion of 3348 km h-1 in association with a flare of 22 min duration and a halo CME. A similar result was published in a study using substantial sunspot and flare data from Kodaikanal Observatory, which examined the association of the minimum separation between the bipolar sunspots and flare occurrences (Hiremath et al. 2005). The fact that high numerical flare productivity was observed in association with high abnormal rotation rates (ARR) of sunspots, leading to the inference that the instability experienced by the foot points of flux tubes below the photosphere (Hiremath & Suryanarayana 2003; Hiremath 2006) led to high flare productivity as well (Suryanarayana 2010). In this context, we note that the majority of spots that have leading and following parts are bipolar (Zirin 1988). Also, from a study of the magnetograms, Hiremath & Lovely (2007) showed that the majority of the spot groups first observed on the surface are bipolar.
An extensive analysis of the rotation of sunspots to the tune of 10 deg day-1 associated with a flare and CME was published by Török et al. (2013). The flare duration was 38 min, which is a reasonably long-duration flare. This pertains to the rotation of the spots around their umbral centre. Hence, to remove any ambiguity, we distinguish the terms sunspot rotation and the abnormal rotation rate as follows. The rotation of sunspots around the umbral centre constitutes the sunspot rotation (Tian & Alexander 2006). In contrast, the abnormal rotation rate represents the abnormal longitudinal displacement of a spot in a given latitude during its evolutionary passage across the solar disk (Hiremath & Suryanarayana 2003).
While the above studies underscore the association between the rotation of sunspots or sunspot groups to the occurrence of flares, in our previous study (Hiremath & Suryanarayana 2003) we presented a relationship between the occurrences of abnormal rotation rates of sunspots and flares. Therefore, at this stage it is useful to pay attention to the issue as to whether the rotation of a sunspot around its own axis occurs while the sunspot experiences the translational motion. The answer appears to be true at least in some cases. Vemareddy et al. (2012) showed that sunspots exhibit both translational and rotational motions. Similarly, rotational, and translational motions of sunspots were reported by Kumar et al. (2012). However, according to Miller (1971), the rotation of spots by itself does not appear to be a predominant factor in flare production, and the relative motion of the large spots is much more important. Thus it appears that the occurrence of flares may be associated with both the rotation of the sunspot around its own axis as well as the abnormal rotation rates. Although we do not attempt to answer, it is certainly interesting to ask the question as to whether abnormal rotation rates of sunspots drive the rotation of sunspots around their own axis, or vice versa, or if both are a result of the flux tubes experiencing the instability just below the surface where the rotational gradient exists (Hiremath 2013, and references therein).
Zhang & Dere (2006) and Cheng et al. (2010) showed that long-duration flares may result from continual or extended magnetic reconnection driven by a positive feedback between the CME eruption and a fast magnetic reconnection inflow; this positive feedback does not exist in flares without associated CMEs. However, many long-duration flares without CME eruption are reported. Therefore, it is not clear what drives long-duration flares with no associated CMEs. Also, it is not clear whether this phenomenon can be observed with every flare associated with a CME as well as whether the magnitude of the phenomena is quantifiable to correlate with the duration of the flare. A clear picture may emerge when the phenomena is examined with a large sample of comparable duration flare events both with and without CMEs.
Mass motions of the plasma associated with a two ribbon flare to the tune of 2 to 5 km s-1 was reported by Bagare (1985) in association with a long-duration flare of 52 min. This leads us to think that sunspot motions and chromospheric mass motions could be a result of the sub-photospheric instabilities that ultimately trigger flares. According to Machado & Linsky (1975), the photospheric heating is often observed during flares and the energy is comparable with that of chromospheric and coronal flares. This implies that the energy release in solar flares may be associated with flux tubes experiencing instability below the photosphere (Hiremath & Suryanarayana 2003; Hiremath 2006). Hence, a correspondence may exists between the speed of flux tubes approaching each other (Hiremath et al. 2005) and flare duration. In this regard, considering the helioseismic inferences, it has been concluded that spots experience instability beneath the surface (Hiremath 2002, and the references therein).
From the work of Martin (1980), it is clear that sufficient statistical analyses are lacking that account for various changes in the dynamics of sunspots to flare characteristics. A study about the abnormal rotation rate of sunspots, and its association with the occurrence of flares (Hiremath & Suryanarayana 2003), is an effort towards the same. However, it remains an open question as to whether the flare duration is also associated with the magnitude of sunspot motion. Keeping this view in mind, we examine the association between the occurrence of abnormal rotation rates of sunspots and flare duration. The paper is organized as follows: in Sect. 2, data adopted for the study and method of analysis are presented. In Sect. 3 we present the results. Sections 4 and 5 deal with the discussion and conclusions, respectively.
2. Data and analysis
2.1. Data and methodology
We use the sunspot data from Kodaikanal observatory white light pictures and GOES SXR flares from the solar geophysical data archive for the period January−April, 2000. It may be noted that the year 2000 was the sunspot maximum period, so the availability of numerous active regions in a short span has dictated our choice of only four months data. The catalogue of sunspot data from Kodaikanal Observatory consists of the heliographic coordinates, the area of the spot, etc. The catalogue provides the information on the daily position (heliographic latitude and longitude) and areas of sunspots obtained from the Kodaikanal Observatory white light images. The spot area is given in units of millionths of hemisphere (mhs). From a collection of 101 sunspot pairs, we identify 43 sunspot pairs for our analysis, as the remaining 58 groups last for two days or less, and hence, abnormal rotation rates cannot be computed.
Using the method given below, we compute rotation rates of sunspots. Following the previous studies (Hiremath & Suryanarayana 2003; Hiremath 2006), we define the rotation rate Ωi of the bipolar sunspots as follows: 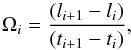 (1)where li is the heliographic longitude from the central meridian for each day, ti is the time of observation, i = 1,2,3,...n, and n is the age of the spot group. We considered data for the region limited to 0° to 40° latitudes in both hemispheres, and also within 65° in eastern and western longitudes from the central meridian to reduce the effect due to foreshortening in measurements.
Using Eq. (1), for each sunspot in a pair, we separately compute the daily rotation rates Ωi, mean rotation rate  , and standard deviation σ. If the absolute value of the difference between the rotation rate Ωi and the mean of the rotation rate is greater than one σ, we consider the corresponding rotation rate at that date as the abnormal rotation rate δΩ of the spot. Thus,
  constitutes the non-abnormal rotation rate (NARR). Admittedly, the distinction between ARR and NARR is somewhat arbitrary. However, in the present data, we found no SXR flare associated with NARR. Hence, the choice of 1σ standard deviation provides a reasonable cut-off for SXR flares.
For all of the spots, the mean rotation rate varies between 12.30−15.52 deg/day and the standard deviation varies between 0.101−0.919 deg/day. As an example, if the mean rotation rate is 15.52 deg/day in a latitude and the standard deviation is 0.919 deg/day, then the rotation rate outside the range 14.601−16.439 deg/day on any day is regarded as abnormal rotation rate. On the other hand, if the rotation rate for any day is varying within the range 14.601−16.439 deg/day, the sunspot is considered to have experienced non-abnormal rotation rate. In this example, if the rotation rate on a certain day is 16.5 deg/day, then the rotation rate is abnormal and the magnitude of abnormal rotation rate is 0.98 deg/day.
2.2. Estimation of errors in positional measurements
Before the era of digital photography, there are no estimation of errors in either heliographic coordinates (latitude and longitude) or area measurements. In fact, the sunspot data of Kodaikanal Observatory we used does not provide the errors in either sunspot heliographic coordinates or area values. This fact is also true for sunspot data of the well-known Greenwich Photo-heliographic Results from which many controversial results, such as the cycle variation of rotation rates or meridional circulation, are used to explain the origin of the solar cycle from the so-called flux transport dynamo mechanism. This despite the fact that these mechanisms are questionable (Hiremath 2008, 2010).
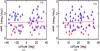 |
Fig. 1 Occurrence of abnormal rotation rates as a function of latitude (north-south separately in Fig. 1a and north-south combined in Fig. 1b). The southern latitude is represented by negative values. A red continuous line represents the linear least-squares fit of the form ARR = (1.335 ± 0.007) + (0.002 ± 0.001)LAT and ARR = (1.263 ± 0.023) + (0.004 ± 0.001)LAT (where ARR and LAT are the abnormal rotation rates and latitude of sunspots) for Figs. 1a and b, respectively. The diamond symbol in red represents NARR points in both the figures. The correlation coefficient and its significance for the least-squares fits are 0.04 and 99.90% for Fig. 1a and 0.06 and 99.99% for Fig. 1b, respectively. |
Prior to the era of digital photography, most of the solar observatories in the world used to estimate the average position between two grids in which sunspot is inscribed within a square box, by overlaying Stonyhurst charts (with spherical grids) manually. With this method of position (either latitude or longitude) measurements, the error in measurement of longitude can be characterised by the angle, θ, subtended by the sunspot.
We assume that the ideal sunspot has an intensity profile that can reasonably be described by a symmetric curve, however, an actual sunspot deviates from the ideal and exhibits some amount of asymmetry. We make the assumption that the deviation of the actual centre of the sunspot compared to the ideal centre is given by a normal distribution with a standard deviation σl chosen so that ±3σl covers the entire angular width, θ, of the sunspot. Hence,  This is rearranged to give the error on the position as
  The width of the sunspot is approximated from the area A of the sunspot by making the assumption that the sunspot has a circular shape, and so
  where r is the radius of the sunspot, and so the width, W of the sunspot is given by
 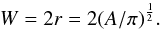 Since the measured area of sunspot is in units of millionth’s of a hemisphere, it should be multiplied by one millionth of hemisphere (
 , where Rs is the radius of sun) to obtain the area, i.e.,
  where Am is the measured area of sunspot. This gives
 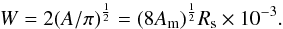 The angle θr subtended by the sunspot is given by
  but this is in radians. Converting to degrees (to agree with the longitudinal measurements)
 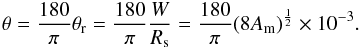 So the error on latitudinal position is
 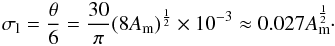 This means that the error on sunspot position varies with its area and that sunspots with larger areas also have larger uncertainties in their longitudinal measurements.
2.3. Estimation of errors in abnormal rotation rate
The equation for the rotation rate Ωi is given by 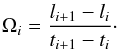 The exposure time of Kodaikanal images is 0.001 s (Sivaraman & Gupta 1993) and hence the error in time is very small in comparison to the error in longitude, and so can be reasonably neglected. The formula is now of the form f = ax − by, which has the propagated error
 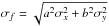 (see Eq. (3.20) in Bevington & Robinson 2003). Hence, the error for the rotation rate is given by
 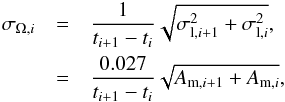 where Am,i is the measured area of the sunspot at time ti.
The abnormal rotation rate is given by  As the process of averaging the rotation rate reduces the error on the average, the error on a single measurement dominates that of the average, and so the error on the abnormal rotation rate can be approximated by the error on an individual rotation rate, i.e.,
2.4. The effect of differential rotation
As the sun rotates differentially, it is interesting to note whether the magnitude of abnormal rotation rate depends upon the latitude. In Fig. 1a, we illustrate the magnitudes of abnormal rotation rates as a function of north and south latitudes, whereas for different latitudes in Fig. 1b, we illustrate the combined occurrence of magnitude of abnormal rotation rates for both the hemispheres. Both figures show that the occurrence of ARR does not depend upon the latitude.
Abnormal rotation rates of sunspots and durations of associated flares.
2.5. Solar flare data
The SXR data is collected from the solar geophysical data archive (SGD). A total of 50 SXR flares and 13 Hα flares have been used. The SXR flares are linked to sunspots on the basis of the date, time, and coordinates of flare region. The flare data consists of the active region number (NOAA), the heliographic coordinates, the start, peak, end times, and different class of flares. We obtain duration of associated SXR flare by subtracting the start time of a given flare from its end time. There are substantial number of flares listed in the SGD, which contain no active region number and co-ordinates. From a comparison of the SGD listing of SXR and Hα flares, it is apparent that active region numbers and heliographic coordinates of SXR flares relate to the Hα flares.
For the 43 pairs of sunspots, we find an association of 32 pairs of sunspots with both SXR and Hα flares and six pairs with Hα flares alone. Hence, 50 ARRs from 32 pairs of sunspots and 13 NARRs from six pairs of sunspots account for the present study. The remaining five sunspot pairs have no associated flares that have matching heliographic coordinates. This may be because even if there were SXR flares reported in that period, comparable Hα flares were not available. In fact, during the lifespan of the five groups, there were many SXR flares listed in the SGD but they did not have any information about the position and active region number. Therefore, it is likely that these five sunspot pairs might also be associated with flares either in other energy ranges or with SXR flares for which the position is unidentified.
In the present study, we use the estimated duration of SXR flares for the following reason. The onset of SXR flare precedes the first flare brightening in Hα, and also the SXR flux peaks after the maximum intensity in Hα occurs. Further, part of X-ray emission corresponds to a bridge between the two Hα emission areas located on the opposite side of a neutral line of longitudinal magnetic field. This indicates that the basic shape of flares is a loop or a system of loops, of which only the loop feet are visible in Hα line while the loop top is too hot to produce Hα emission. Furthermore, the Hα flare, which is a chromospheric event, represents the height of about 8000 km s above the base of chromosphere, whereas the SXR flare accounts for large heights in corona (Thomas & Teske 1971). Thus, we use primarily SXR flares as they better reflect the actual flare duration than Hα flares.
3. Results
As described in the previous section, for each spot during its evolution, abnormal rotation rates are computed and we note the corresponding flares that occur between the preceding and following day of the ARR. We present typical occurrences of abnormal rotation rates for seven pairs of sunspots and flares in Table 1. The columns in Table 1 are: (i) Kodaikanal (KKL) sunspot group number; (ii) corresponding NOAA number; (iii) year of observation; (iv) month of observation; (v) date of observation; (vi) ARR; (vii) error in ARR; (viii) flare class and (ix) duration of flares.
Occurrence of abnormal rotation rates of individual spots of a bipolar pair is often associated with the minimum longitudinal separation between the two spots. To check this observed phenomena with the present data, the typical daily longitudinal separation between a pair of sunspots in AR8824 is computed and presented in Fig. 2. with abnormal rotation rates and associated flares. A similar trend as in the previous studies (Hiremath et al. 2005; Hiremath 2006) is also observed in the present example. These results confirm the results of previous studies that abnormal rotation rates of individual spots in a pair is often associated with minimum separation between bipolar spots. Further, sunspots that experience abnormal rotation rates are also associated with minimum longitudinal separation and occurrence of flares on that day.
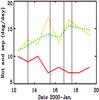 |
Fig. 2 Graph illustrating the occurrence dates of abnormal rotation rates, flares, and minimum separation of the leading and trailing sunspots in AR8824 (Kodaikanal Number 21448). The dashed line in green, dash-dotted line in yellow and the continuous line in red represent the rotation rates of leading and following spots and minimum separation, respectively. The vertical lines represent flare occurrences on those dates. |
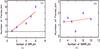 |
Fig. 3 Binned data of number of abnormal rotation rates and number of flares is illustrated in Fig. 3a. The red continuous line is a linear least squares fit of the form nFbin = (−1.489 ± 0.561) + (1.292 ± 0.151)nARRbin (where nFbin and the nARRbin are the number of flares and the number of abnormal rotation rates respectively). Binned data of number of non-abnormal rotation rates and number of flares is illustrated in Fig. 3b. The red continuous line is a linear least squares fit of the form nFbin = (1.136 ± 0.264) + (0.051 ± 0.048)nNARRbin (where nFbin and nNARRbin are the number of flares and the number of binned non-abnormal rotation rates respectively). The correlation coefficient and its significance for the least square fits are 0.95 and 99.74% respectively for Fig. 3a and, 0.25 and 93.2% for Fig. 3b, respectively. |
To examine the association between the occurrence of abnormal rotation rates of sunspots and the occurrence of flares, we plot, in Fig. 3a, the number of flares that occurred against the occurrence number of abnormal rotation rates of all the spot groups. There is a strong association between the occurrence of abnormal rotation rates and the occurrence of flares. For example, for every six abnormal rotation rates, a corresponding eight flares occurred. Also, a good correlation with a high significance bears testimony to a distinct association between the occurrence of abnormal rotation rates experienced by a given spot during its lifespan and the occurrence of flares. Similarly, Fig. 3b illustrates the occurrence number of non-abnormal rotation rates and the occurrence number of flares. In contrast, there is a pronounced lack of proportionality of flare occurrences with the increase in the non-abnormal rotation rates of different spots. For error bars in each data point of Figs. 3a and b, the occurrence number of abnormal rotation rates and non-abnormal rotation rates are binned in the interval of 1−2, 2−3, etc., and in each bin, the occurrence number “n” of flares are collected, the respective averages, standard deviations σb , and the error bars σb/ in each bin are computed.
Since, the occurrence of flares is strongly associated with the occurrence of abnormal rotation rates of sunspots, it is interesting to know whether an association exists between magnitudes of abnormal rotation rates and flare durations.
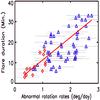 |
Fig. 4 Scatter plot illustrating the magnitude of abnormal rotation rates of sunspots and duration of associated flares. The red continuous line is a linear least-squares fit of the form τ = (1.984 ± 0.332) + (9.075 ± 0.191)δΩ, where τ and δΩ are the duration of flares and magnitude of abnormal rotation rates of the spots, respectively. The diamond symbol in red represents NARR points. The correlation coefficient and its significance are 0.74 and 99.99%, respectively. |
As the errors in the durations of X-ray flares are not available, we compute these as follows. The flare energy curve consists of one-minute intervals of the X-ray flux. The start and end times of the flare are derived from one-minute average X-ray measurements from GOES, hence, an inherent scale error of σt = 0.5 min exists, so we have start time t0 ± 0.5 minutes and end times t1 ± 0.5 min. Thus, the duration d = t1 − t0 has an error 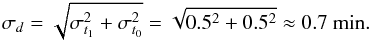 A scatter plot illustrating the variation in magnitudes of abnormal rotation rates δΩ of sunspots and the flare durations τ is presented in Fig. 4. This figure shows that, with a high significance (99.99%), an association exists between the magnitudes of abnormal rotation rates of sunspots and the durations of SXR flares. Our conclusion from this illustration is that there is a strong association between the magnitude of ARR and flare duration.
As noted earlier (Sect. 2), the distinction between the ARR and NARR is rather arbitrary. As we found no SXR flare in association with NARR events, we searched for the same in Hα flares in the SGD catalogue on the date of occurrence of the NARR. The Hα flare durations are shown as additional points in the Fig. 4 (diamond symbols in red) associated with respective NARR events, which are in the range of 0 to 1 deg/day. The same data set is also represented as red symbols in Figs. 1 and 5, respectively. The combined data (ARR and NARR) emphasizes the association between the deviation of rotation rates of sunspots from their mean rotation rates and flare durations.
To verify if any association exists between the areas of spots and abnormal rotation rates and also between the areas of spots and the flare duration, we plot the abnormal rotation rates and flare durations against the sunspot areas in Fig. 5. We find that no significant association exists either between the sunspot areas and magnitude of abnormal rotation rates or between the sunspot areas and flare durations. Since the error in the measurement of sunspot area cannot be estimated accurately, we assumed the same to be approximately equal to one unit at the smallest significant digit of the area of a given spot.
4. Discussion
Several physical mechanisms have been proposed to explain the genesis of flares. It is believed that the energy is stored in the corona as magnetic energy, which is released as a flare within a short span of time. The annihilation of the magnetic field results in the abrupt release of flare energy. The annihilation of the magnetic field, however, is possible only with reconnection of field lines, which can be expected only in a metastable configuration, such as twisted fields and sheared fields. The magnetic energy of an active region, which produces a large flare is estimated to be about 1033 erg. The instability may occur in a single twisted flux tube if the effects of electric currents are considered. Since the magnetic field is assumed to be force-free, the currents go along the tube. A measurement of the longitudinal and transverse components of the magnetic field structure, reveals that vertical currents of the order of 1011 A exists in the neighbourhood of sunspots. In a rope of ~5000 km diameter, which corresponds to the size of the bright flare patches, the current should exceed 2 × 10¹¹ A. The photospheric motions can drive strong coronal currents responsible for storing magnetic energy. The energy may be released very quickly if currents are interrupted. However, the mechanism of this current dissipation is yet to be understood. This is obvious because the field annihilation mechanism is incompatible since many flares occur in a simple dipole configuration (Švestka 1975, and the references therein).
A study by Stenflo (1969) shows that the kinetic energy of the rotational motion of sunspots can be transferred to electromagnetic energy in filamentary currents. This study further indicates that the time needed for preconditioning the solar atmosphere for a flare varies within wide limits. For small flares, timescales of the variation of current dissipation may be of the order of minutes; for large flares, timescales may be of the order of hours or days.
Present consensus is that magnetic reconnection in a very compact region with oppositely directed magnetic flux is believed to result in annihilation of the field, leading to release of flare energy that accelerates particles to high energy (Hiremath 2009, and references therein). In this compact region, because of the low Reynolds number, the dissipative process dominates whereas outside the reconnection region the electric field is non-dissipative because of the high Reynolds number.
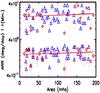 |
Fig. 5 Scatter plot illustrating the durations of flares τ (upper panel) and the magnitude of abnormal rotation rates ARR (lower panel) versus the area A of the sunspots. In both the panels, the red continuous line represents linear least-squares fit of the form τ = (16.153 ± 0.244) + (0.014 ± 0.001)A (upper panel) and δΩ = (1.579 ± 0.018) + (0.001 ± 0.000)A (lower panel). The diamond symbol in red represents NARR points. Correlation co-efficient and its significance for the least-squares fit are 0.12 and 99.99% (upper panel) and 0.14 and 99.99% (lower panel), respectively. |
While these issues highlight the different physical mechanisms explaining the localized energy dissipation processes, the causative factors for these phenomena are yet to be identified. Most of these studies believe that flare energy released is because of the magnetic reconnection in the corona, although there are no unambiguous observational evidences. On the other hand, contribution to the energy build-up because of a variation of magnetic field structure and subsurface dynamics of the sunspots cannot be ruled out. While various reconnection processes, including the emerging flux, are the likely candidates for triggering energy release processes in flares, the contributory factor to the actual energy build-up process appears to come from photospheric and subphotospheric dynamics (Hiremath 2006).
Therefore an alternative view to the phenomena of energy build-up that leads to flare occurrences, in general, and flare duration, in particular, is presented below. The increase and decrease in the areas of sunspots is understood in terms of whether the spots originate in the region of positive or negative rotational gradient (Hiremath & Lovely 2010; Hiremath 2013, and references therein) just beneath the surface. This implies that the change in the areas of the sunspots is a rather gradual process along with the passage of the foot points through the width of rotational gradient beneath the surface. However, the occurrence of abnormal rotation rates of sunspots is a result that could be due to the flux tubes experiencing instability just below the surface where rotational gradient exists around the region of 0.935Rs (Hiremath & Suryanarayana 2003; Suryanarayana 2010). This explains the result, presented in Fig. 5, that areas of the sunspots do not have a major role in causing abnormal rotation rates as well as the variation of flare duration. This result also agrees with the results by Hiremath et al. (2006) that among different quantities that vary, such as the areas, abnormal rotation rates, longitudinal extents, and number of small spots produced, the abnormal rotation rates during sunspot’s evolutionary phases is the predominant factor that triggers the flares. In fact, McIntosh (1970) has noted that even small sunspot groups may be associated with major flares if their spot motions are especially large and lead to an increasing gradient across the neutral line.
A possible scenario to explain the strong association between ARR and flare duration is as follows. While ascending from the deep interior towards the surface, the flux tubes approaching each other beneath the surface result in compression and pumping of the plasma to coronal heights where it dissipates in the form of flares. This implies that there is proportionality between the compression speed of the plasma due to abnormal longitudinal displacement of the sunspots below the surface and the rate of dissipation of energy and hence the duration of the flares. However, a detailed understanding of the processes involved is beyond the scope of the present work.
5. Conclusion
Using sunspot and SXR flare data from Kodaikanal Observatory and the archive of solar geophysical data, respectively, we studied the association between the occurrence of abnormal rotation rates of sunspots and flare duration. We find that with a high significance, a strong association exist between the magnitude of abnormal rotation rates of sunspots and flare duration. In conclusion, it appears that the duration of dissipation of energy during a flare is dictated by the dynamics and energy involved in relative motions of magnetic features against the dominance of local convective processes.
Acknowledgments
We are thankful to the observers of the Kodaikanal observatory for meticulously contributing to the archive of Kodaikanal white light images. The flare data has been accessed from the archive of the solar geophysical data (ftp://ftp.ngdc.noaa.gov/STP/SOLAR_DATA/SGD_PDFversion/). We are grateful to the anonymous referee for the useful comments that improved the manuscript substantially. We also thank the editor Dr. Hardi Peter for suggesting an important aspect of interpretation.
References
- Anzer, U., & Pneuman, G. W. 1982, Sol. Phys., 79, A129 [NASA ADS] [CrossRef] [Google Scholar]
- Bagare, S. P. 1985, BASI, 13, 394 [NASA ADS] [Google Scholar]
- Bak-Steslicka, U., Kolomanski, S., & Mrozek, T. 2011, CEAB, 35, 135 [NASA ADS] [Google Scholar]
- Bein, B. M., Berkebile-Stoiser, S., Veronig, A. M., Temmer, M., & Vršnak, B. 2012, ApJ, 755 [Google Scholar]
- Bevington, P. R., & Robinson, D. K. 2003, Data Reduction And Error Analysis for the Physical Sciences, 3rd edn. (McGraw Hill), 42 [Google Scholar]
- Cane, H. V., McGuire, R. E., & von Rosenvinge, T. T. 1986, ApJ, 301, 448 [NASA ADS] [CrossRef] [Google Scholar]
- Chamberlin, P. C., Milligan, R. O., & Woods, T. N. 2012, Sol. Phys., 279, 23 [NASA ADS] [CrossRef] [Google Scholar]
- Cheng, X., Ding, M. D., & Zhang, J. 2010, ApJ, 712, 1302 [NASA ADS] [CrossRef] [Google Scholar]
- Cheng, X., Zhang, J., Ding, M. D., Guo, Y., & Su, J. T. 2011, ApJ, 732, 87 [NASA ADS] [CrossRef] [Google Scholar]
- Gopalswamy, N., Yashiro, S., Liu, Y., et al. 2005, J. Geophys. Res., 110, A09S15 [Google Scholar]
- Hiremath, K. M. 2002, A&A, 386, 674 [NASA ADS] [CrossRef] [EDP Sciences] [Google Scholar]
- Hiremath, K. M. 2006, JA&A, 27, 277 [NASA ADS] [Google Scholar]
- Hiremath, K. M. 2008, Ap&SS, 314, 45 [NASA ADS] [CrossRef] [Google Scholar]
- Hiremath, K. M. 2009, ArXiv e-prints [arXiv:0909.2147] [Google Scholar]
- Hiremath, K. M. 2010, Sun and Geosphere, 5, 17 [NASA ADS] [Google Scholar]
- Hiremath, K. M. 2013, New trends in Atomic and Molecular Physics (Springer Series on Atomic, Optical and Plasma Physics), 76 [Google Scholar]
- Hiremath, K. M., & Lovely, M. R. 2007, ApJ, 667, 585 [NASA ADS] [CrossRef] [Google Scholar]
- Hiremath, K. M., & Lovely, M. R. 2010, ArXiv e-prints [arXiv:1012.5706v1] [Google Scholar]
- Hiremath, K. M., & Suryanarayana, G. S. 2003, A&A, L497 [Google Scholar]
- Hiremath, K. M., Suryanarayana, G. S., & Lovely, M. R. 2005, A&A, 437, 297 [NASA ADS] [CrossRef] [EDP Sciences] [Google Scholar]
- Hiremath, K. M., Lovely, M. R., & Kariyappa, R. 2006, JA&A, 27, 333 [NASA ADS] [Google Scholar]
- Hudson, H. S. 1991, Sol. Phys., 133, 357 [Google Scholar]
- Jiang, Y., Zheng, R., Yang, J., et al. 2012, ApJ, 744, 50 [NASA ADS] [CrossRef] [Google Scholar]
- Kumar, P., Park, S., Cho, K.-S., & Bong, S.-C. 2013, Sol. Phys., 282, 503 [NASA ADS] [CrossRef] [Google Scholar]
- Machado, M. E., & Linsky, J. L. 1975, Sol. Phys., 42, 395 [NASA ADS] [CrossRef] [Google Scholar]
- Martin, S. F. 1980, Sol. Phys., 68, 217 [NASA ADS] [CrossRef] [Google Scholar]
- McIntosh, P. S. 1969, Upper Atmosphere Geophysics Report, UAG5, World Data Center A [Google Scholar]
- McIntosh, P. S. 1970, in Ionospheric Forecasting, ed. V. Agy, GARD Conf. Proc., 49, 81 [Google Scholar]
- Miller, R. 1971, Sol. Phys., 16, 373 [NASA ADS] [CrossRef] [Google Scholar]
- Rust, D. M., Hildner, E., Hrsen, R. T., et al. 1980, in Solar Flares, A Monograph from Skylab Workshop II, ed. P. A. Sturrock (Boulder: Colorado Associated University Press), 273 [Google Scholar]
- Sheeley, N. R., JR., Howard, R. A., Koomen, M. J., & Michels, D. J. 1983, ApJ, 272, 349 [NASA ADS] [CrossRef] [Google Scholar]
- Sivaraman, K. R., & Gupta, S. S. 1993, Sol. Phys., 146, 27 [NASA ADS] [CrossRef] [Google Scholar]
- Stenflo, J. O. 1969, Sol. Phys., 8, 115 [NASA ADS] [CrossRef] [Google Scholar]
- Suryanarayana, G. S. 2010, New Astron., 15, 313 [NASA ADS] [CrossRef] [Google Scholar]
- Suryanarayana, G. S. 2012, New Astron., 17, 117 [NASA ADS] [CrossRef] [Google Scholar]
- Švestka, Z. 1975, In Solar Flares: Geophysics and Astrophysics Monographs, ed. B. M. M. McCormak (Holland/USA: D. Reidel Publishing Company), 8, 310 [Google Scholar]
- Szajko, N. S., Cristiani, G., Mandrini, C. H., & Dal Lago, A. 2013, Adv. Space Res., 51, 1842 [NASA ADS] [CrossRef] [Google Scholar]
- Thomas, R. J., & Teske, R. G. 1971, Sol. Phys., 16, 431 [Google Scholar]
- Tian, L., & Alexander, D. 2006, Sol. Phys., 233, 29 [NASA ADS] [CrossRef] [Google Scholar]
- Török, T., Temmer, M., Valori, G., et al. 2013, Sol. Phys., 286, 453 [NASA ADS] [CrossRef] [Google Scholar]
- Vemareddy, P., Ambastha, A., & Maurya, R. A. 2012, ApJ, 761, 60 [NASA ADS] [CrossRef] [Google Scholar]
- Yan, X. L., Qu, Z. Q., & Kong, D. F. 2012, AJ, 143, 56 [NASA ADS] [CrossRef] [Google Scholar]
- Yashiro, S., Akiyama, S., Gopalswamy, N., & Howard, R. A. 2006, ApJ, 650, L143 [Google Scholar]
- Zhang, J., & Dere, K. P. 2006, ApJ, 649, 1100 [Google Scholar]
- Zirin, H. 1988, in Astrophysics of the Sun (Cambridge University Press), 314 [Google Scholar]
- Zirin, H., & Lazaref, B. 1975, Sol. Phys., 41, 425 [NASA ADS] [CrossRef] [Google Scholar]
All Tables
All Figures
|
Fig. 1 Occurrence of abnormal rotation rates as a function of latitude (north-south separately in Fig. 1a and north-south combined in Fig. 1b). The southern latitude is represented by negative values. A red continuous line represents the linear least-squares fit of the form ARR = (1.335 ± 0.007) + (0.002 ± 0.001)LAT and ARR = (1.263 ± 0.023) + (0.004 ± 0.001)LAT (where ARR and LAT are the abnormal rotation rates and latitude of sunspots) for Figs. 1a and b, respectively. The diamond symbol in red represents NARR points in both the figures. The correlation coefficient and its significance for the least-squares fits are 0.04 and 99.90% for Fig. 1a and 0.06 and 99.99% for Fig. 1b, respectively. |
| In the text | |
|
Fig. 2 Graph illustrating the occurrence dates of abnormal rotation rates, flares, and minimum separation of the leading and trailing sunspots in AR8824 (Kodaikanal Number 21448). The dashed line in green, dash-dotted line in yellow and the continuous line in red represent the rotation rates of leading and following spots and minimum separation, respectively. The vertical lines represent flare occurrences on those dates. |
| In the text | |
|
Fig. 3 Binned data of number of abnormal rotation rates and number of flares is illustrated in Fig. 3a. The red continuous line is a linear least squares fit of the form nFbin = (−1.489 ± 0.561) + (1.292 ± 0.151)nARRbin (where nFbin and the nARRbin are the number of flares and the number of abnormal rotation rates respectively). Binned data of number of non-abnormal rotation rates and number of flares is illustrated in Fig. 3b. The red continuous line is a linear least squares fit of the form nFbin = (1.136 ± 0.264) + (0.051 ± 0.048)nNARRbin (where nFbin and nNARRbin are the number of flares and the number of binned non-abnormal rotation rates respectively). The correlation coefficient and its significance for the least square fits are 0.95 and 99.74% respectively for Fig. 3a and, 0.25 and 93.2% for Fig. 3b, respectively. |
| In the text | |
|
Fig. 4 Scatter plot illustrating the magnitude of abnormal rotation rates of sunspots and duration of associated flares. The red continuous line is a linear least-squares fit of the form τ = (1.984 ± 0.332) + (9.075 ± 0.191)δΩ, where τ and δΩ are the duration of flares and magnitude of abnormal rotation rates of the spots, respectively. The diamond symbol in red represents NARR points. The correlation coefficient and its significance are 0.74 and 99.99%, respectively. |
| In the text | |
|
Fig. 5 Scatter plot illustrating the durations of flares τ (upper panel) and the magnitude of abnormal rotation rates ARR (lower panel) versus the area A of the sunspots. In both the panels, the red continuous line represents linear least-squares fit of the form τ = (16.153 ± 0.244) + (0.014 ± 0.001)A (upper panel) and δΩ = (1.579 ± 0.018) + (0.001 ± 0.000)A (lower panel). The diamond symbol in red represents NARR points. Correlation co-efficient and its significance for the least-squares fit are 0.12 and 99.99% (upper panel) and 0.14 and 99.99% (lower panel), respectively. |
| In the text | |
Current usage metrics show cumulative count of Article Views (full-text article views including HTML views, PDF and ePub downloads, according to the available data) and Abstracts Views on Vision4Press platform.
Data correspond to usage on the plateform after 2015. The current usage metrics is available 48-96 hours after online publication and is updated daily on week days.
Initial download of the metrics may take a while.