Fig. 1
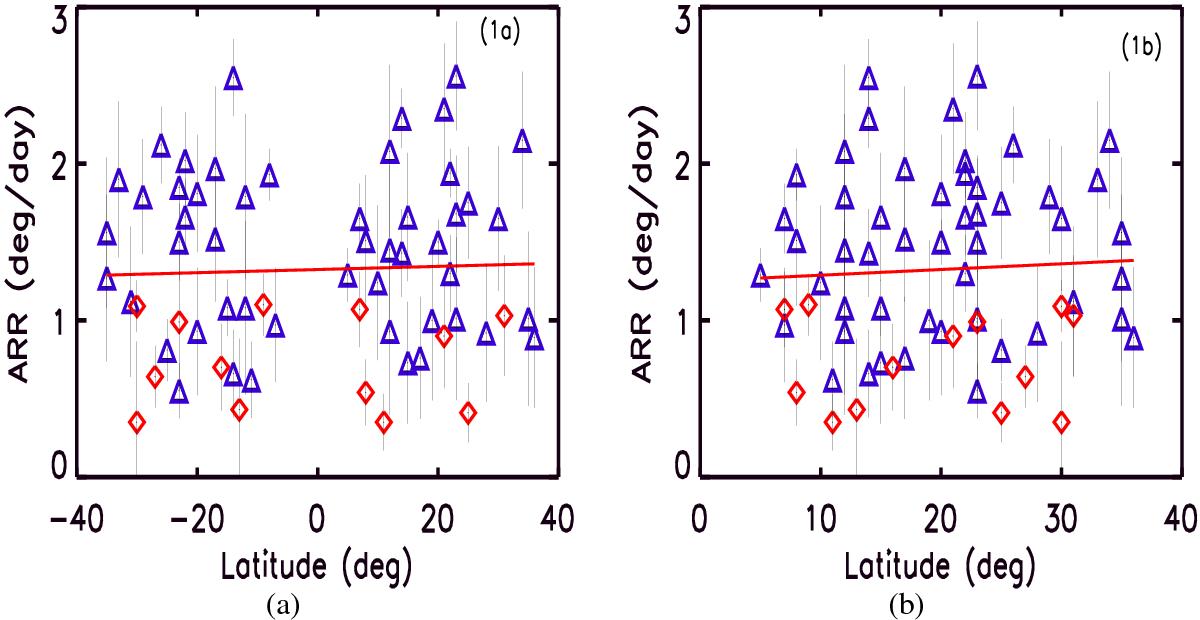
Occurrence of abnormal rotation rates as a function of latitude (north-south separately in Fig. 1a and north-south combined in Fig. 1b). The southern latitude is represented by negative values. A red continuous line represents the linear least-squares fit of the form ARR = (1.335 ± 0.007) + (0.002 ± 0.001)LAT and ARR = (1.263 ± 0.023) + (0.004 ± 0.001)LAT (where ARR and LAT are the abnormal rotation rates and latitude of sunspots) for Figs. 1a and b, respectively. The diamond symbol in red represents NARR points in both the figures. The correlation coefficient and its significance for the least-squares fits are 0.04 and 99.90% for Fig. 1a and 0.06 and 99.99% for Fig. 1b, respectively.
Current usage metrics show cumulative count of Article Views (full-text article views including HTML views, PDF and ePub downloads, according to the available data) and Abstracts Views on Vision4Press platform.
Data correspond to usage on the plateform after 2015. The current usage metrics is available 48-96 hours after online publication and is updated daily on week days.
Initial download of the metrics may take a while.