Fig. 5
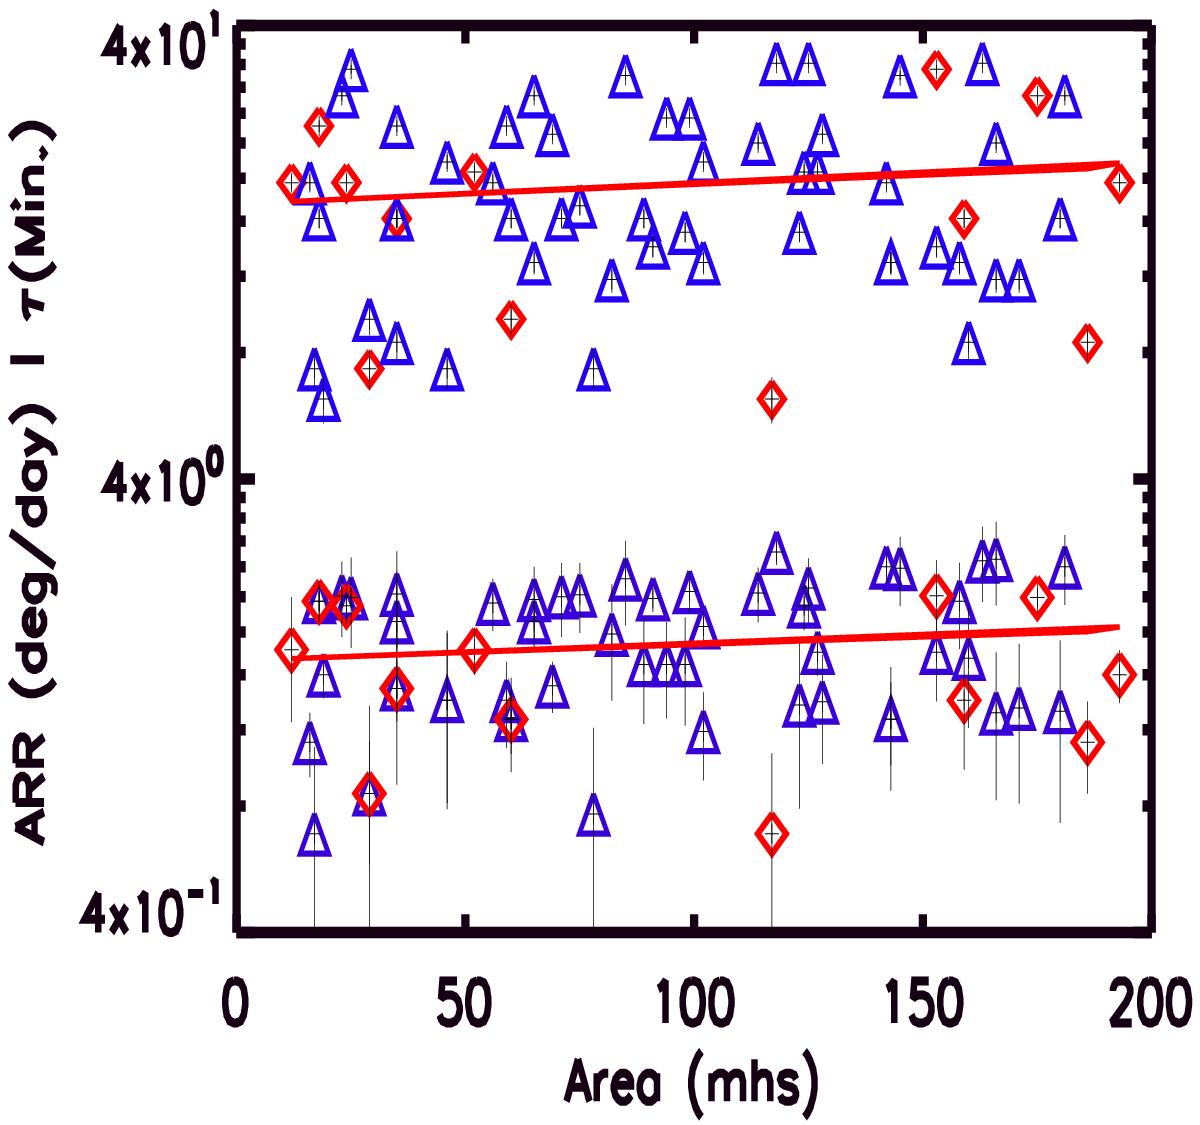
Scatter plot illustrating the durations of flares τ (upper panel) and the magnitude of abnormal rotation rates ARR (lower panel) versus the area A of the sunspots. In both the panels, the red continuous line represents linear least-squares fit of the form τ = (16.153 ± 0.244) + (0.014 ± 0.001)A (upper panel) and δΩ = (1.579 ± 0.018) + (0.001 ± 0.000)A (lower panel). The diamond symbol in red represents NARR points. Correlation co-efficient and its significance for the least-squares fit are 0.12 and 99.99% (upper panel) and 0.14 and 99.99% (lower panel), respectively.
Current usage metrics show cumulative count of Article Views (full-text article views including HTML views, PDF and ePub downloads, according to the available data) and Abstracts Views on Vision4Press platform.
Data correspond to usage on the plateform after 2015. The current usage metrics is available 48-96 hours after online publication and is updated daily on week days.
Initial download of the metrics may take a while.