Fig. 3
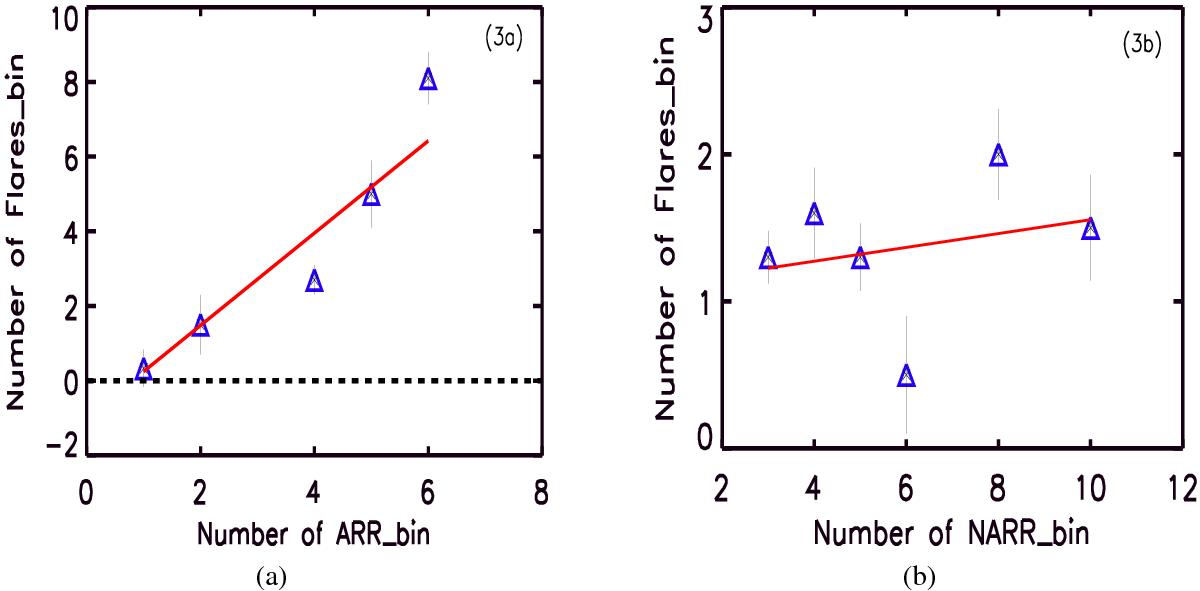
Binned data of number of abnormal rotation rates and number of flares is illustrated in Fig. 3a. The red continuous line is a linear least squares fit of the form nFbin = (−1.489 ± 0.561) + (1.292 ± 0.151)nARRbin (where nFbin and the nARRbin are the number of flares and the number of abnormal rotation rates respectively). Binned data of number of non-abnormal rotation rates and number of flares is illustrated in Fig. 3b. The red continuous line is a linear least squares fit of the form nFbin = (1.136 ± 0.264) + (0.051 ± 0.048)nNARRbin (where nFbin and nNARRbin are the number of flares and the number of binned non-abnormal rotation rates respectively). The correlation coefficient and its significance for the least square fits are 0.95 and 99.74% respectively for Fig. 3a and, 0.25 and 93.2% for Fig. 3b, respectively.
Current usage metrics show cumulative count of Article Views (full-text article views including HTML views, PDF and ePub downloads, according to the available data) and Abstracts Views on Vision4Press platform.
Data correspond to usage on the plateform after 2015. The current usage metrics is available 48-96 hours after online publication and is updated daily on week days.
Initial download of the metrics may take a while.