| Issue |
A&A
Volume 578, June 2015
|
|
|---|---|---|
| Article Number | A31 | |
| Number of page(s) | 16 | |
| Section | Interstellar and circumstellar matter | |
| DOI | https://doi.org/10.1051/0004-6361/201525705 | |
| Published online | 28 May 2015 | |
Sensitive survey for 13CO, CN, H2CO, and SO in the disks of T Tauri and Herbig Ae stars
II. Stars in ρ Ophiuchi and upper Scorpius⋆,⋆⋆
1 Univ. Bordeaux, LAB, UMR 5804, 33270 Floirac, France
e-mail: This email address is being protected from spambots. You need JavaScript enabled to view it.
2 CNRS, LAB, UMR 5804, 33270 Floirac, France
3 Department of Physics and Astronomy, Stony Brook University, Stony Brook, NY 11794-3800, USA
4 Observatoire Astronomique de Strasbourg, Université de Strasbourg, CNRS, UMR 7550, 11 rue de l’Université, 67000 Strasbourg, France
5 IRAM, 300 rue de la piscine, 38406 Saint Martin d’Hères, France
Received: 21 January 2015
Accepted: 30 March 2015
Abstract
Aims. We attempt to determine the molecular composition of disks around young low-mass stars in the ρ Oph region and to compare our results with a similar study performed in the Taurus-Auriga region.
Methods. We used the IRAM 30 m telescope to perform a sensitive search for CN N = 2−1 in 29 T Tauri stars located in the ρ Oph and upper Scorpius regions. 13CO J = 2−1 is observed simultaneously to provide an indication of the level of confusion with the surrounding molecular cloud. The bandpass also contains two transitions of ortho-H2CO, one of SO, and the C17O J = 2−1 line, which provides complementary information on the nature of the emission.
Results. Contamination by molecular cloud in 13CO and even C17O is ubiquitous. The CN detection rate appears to be lower than for the Taurus region, with only four sources being detected (three are attributable to disks). H2CO emission is found more frequently, but appears in general to be due to the surrounding cloud. The weaker emission than in Taurus may suggest that the average disk size in the ρ Oph region is smaller than in the Taurus cloud. Chemical modeling shows that the somewhat higher expected disk temperatures in ρ Oph play a direct role in decreasing the CN abundance. Warmer dust temperatures contribute to convert CN into less volatile forms.
Conclusions. In such a young region, CN is no longer a simple, sensitive tracer of disks, and observations with other tracers and at high enough resolution with ALMA are required to probe the gas disk population.
Key words: circumstellar matter / protoplanetary disks / radio lines: stars
Based on observations carried out with the IRAM 30-m telescope. IRAM is supported by INSU/CNRS (France), MPG (Germany) and IGN (Spain).
Appendix A is available in electronic form at http://www.aanda.org
© ESO, 2015
1. Introduction
Star formation occurs in clusters that are embedded in collapsing molecular clouds (Lada & Lada 2003). The different stellar populations and properties, such as age, mass or density, can have effects on the circumstellar disk evolution, which strongly depends on the environment. In regions of high stellar density, disks can be more easily photoevaporated by the intense UV radiation (Johnstone et al. 1998). This means that the evolution of disks in the vicinity of massive stars will differ from the evolution of isolated disks (see, e.g., Mann et al. 2014). The disk structure and chemistry can therefore vary from region to region.
Source sample.
Circumstellar disks are the sites where planets form and their gas and dust provide the raw materials for planet building. Constraining the chemical evolution of protoplanetary disks therefore is a major challenge in understanding the planet formation process. Molecular-line emission is an important tool for deriving the disk characteristics (Dartois et al. 2003; Qi et al. 2006). Because H2, the most abundant molecule, cannot be observed, we rely on lower abundance tracers, principally simple molecules, to derive those characteristics. In a previous study of ~45 stars in the Taurus region, we showed that CN N = 2−1 is a good tracer of disks because it is readily detectable in at least 50% of the observed sources (Guilloteau et al. 2013, hereafter Paper I). Contamination by molecular clouds was minimal in this line; it was found in fewer than 10% of the cases, but some sources exhibited strong lines that most likely originate from outflows rather than circumstellar disks.
However, the Taurus-Auriga area is a region of isolated star formation, and the previous result may not be applicable for other star-forming regions, either because of stellar density or more simply, because of age. We extend here our study to the ρ Oph star-forming region, which is both younger and denser than the Taurus region. We report a search for CN, ortho-H2CO, SO, 13CO, and C17O emissions in 22 young stars located in the ρ Oph region and 7 stars in the upper Scorpius area. We attempt to compare these results with previous observations performed in the Taurus region (Paper I), and more particularly, the CN content in these star-forming regions.
The paper is organized as follows. The observations and data analysis are described in Sect. 2. We present the results and the source analysis in Sect. 3. In Sect. 4 we discuss the difference in molecular composition observed between the Taurus region and that of ρ Oph. We conclude in Sect. 5. Appendix A displays all the observed spectra.
2. Observations and data analysis
2.1. Source sample
Table 1 lists the 30 stars involved in this study. HD 163296, an isolated HAe star, was used for calibration purposes. Our main objective was to search for potential targets for the stellar mass determination, to test models of early stellar evolution. Hence, our sample is biased toward late spectral types.
The overall sample covers a wide range of spectral types (from M4 to A1), luminosities (from 0.2 to 12 L⊙), and 1.3 mm continuum flux densities (from < 4 to ~ 800 mJy), but is not complete with respect to these quantities. No specific account of extinction and location with respect to molecular clouds was made when we selected the sources. Sources with outflows were deliberately included. The distribution of sources is displayed in Fig. 1, which shows the location of the studied sources overlaid on an extinction map. Of these 30 stars, 22 are located in the ρ Oph star-forming region, for which a reliable distance, 120 pc1, based on VLBI astrometry (Loinard et al. 2008a) or optical extinction (Knude & Hog 1998), is available. The distances to the other 8 stars might lie in the range 120 to 170 pc (Loinard et al. 2008b; de Geus et al. 1989): we assume 160 pc hereafter. We report our observations of these stars, but cannot reliably analyze them in terms of stellar luminosity and mass.
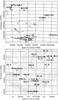 |
Fig. 1 Extinction maps of the ρ-Oph star-forming region (based on the 2MASS PSC Dobashi et al. 2013), contours from 1 to 18 mag in steps of 1 mag. The bottom map is a zoom on the area in which most sources are located (black square in the top map). Asterisks are sources with CN detection. |
2.2. Observations
Observations were carried out with the IRAM 30 m radiotelescope on October 12−13, 2012, and from August 8−14, 2013. The weather conditions were quite varied, with water vapor content changing from 3 mm on good nights to 6−7 mm on others. Given the low elevation of the sources (mostly below 25°), this resulted in single-sideband system temperatures ranging from 350 K to about 1000 K, with averaged values between 400 K and 600 K for most sources. However, pointing conditions were good.
A few strong lines of SO, SO2, and SO+ found in one of the sources allowed us to check the sideband rejection, which was found to be around 13 dB. All observations were made at relatively low but constant elevation. We thus did not apply any gain-elevation curve correction and used a simple uniform conversion factor from antenna temperature ( ) to flux density of JK = 9 Jy/K. A comparison with previous observations on HD 163296 (Paper I) suggests that our calibration is accurate within 10%.
The observations were performed in symmetric wobbler-switching mode, with the two references ± 60′′ away at the same elevation. The weather conditions were stable enough to provide flat baselines.
As the system temperature varied much from day to day, we observed the sample of 30 sources (see Table 1) for integration times varying between 1 and 8 h. The resulting sensitivity at the nominal resolution of δV ≃ 0.26 km s-1 is given in Table 1 (rms column). For a typical line width of ΔV = 3 km s-1, the corresponding 1σ error on the integrated line flux can be obtained by multiplying this number by  Jy km s-1/K. Our survey depth is thus ranging between 0.18 to 0.65 Jy km s-1, with a typical value of 0.3 Jy km s-1.
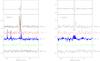 |
Fig. 2 Lines toward CRBR 85 and the Flying Saucer. Top panel: 13CO J = 2−1 spectrum. Bottom panel, from top to bottom: 13CO J = 2−1, C17O J = 2−1, CN N = 2−1, the average of both o-H2CO transitions, and SO 54−43, shifted in intensity by multiples of 0.15 K to avoid overlap. The intensity scale is the antenna temperature ( |

2.3. Data analysis
We applied the same analysis procedure as in Paper I, removing linear baselines in a window ±60 km s-1 wide around each spectral line, and fitting Gaussian profiles to detect lines, with proper account for the hyperfine structure of CN and C17O.
The two transitions of ortho-H2CO differ only by the small K splitting, with the 211.2 GHz line on average 20% stronger than the 225.2 GHz line. We computed an average H2CO spectrum and line intensity using this ratio.
3. Results
As described in Paper I, line emission from these objects can come a priori from four distinct regions: molecular cloud(s) along the line of sight, the circumstellar disk, a molecular outflow, and (especially for the youngest objects) a remnant envelope. A molecular cloud will exhibit narrow lines, and because of our observing technique, which differenciates the emission from that ± 1′ away, may appear in emission or absorption. Disks should lead to symmetric, in general double-peaked, line profiles, and line widths ∝ sini (with typical values 2−4 km s-1, face-on objects being rare). Contribution from outflows, envelopes, or molecular clouds may vary considerably and may be difficult to distinguish from disk emission, so that our results can be dominated by contamination.
Figure 2 shows the spectra toward the two illustrative sources CRBR 85 and the Flying Saucer, an edge-on disk at the periphery of ρ Oph (Grosso et al. 2003). Spectra for all other sources are presented in Appendix A.
The 13CO results are completely dominated by contamination. Only four sources show no obvious sign of contamination: AS 205, J1603-1751, DoAr 44, and V1146 Sco. No disk component can be fit to the observed profiles, except for the already known case of the isolated HAe star HD 163296.
Even in C17O J = 2−1, contamination exists, with negative signals in IRS 41, IRS 49, El 20, SR 21, El 24, El 27, and WSB 60, and strong emission toward CRBR 85, LFAM 1, YW 16c, and GSS 26. We have a weak detection in HD 1632926 (see below).
On the other hand, CN emission is extremely rare. The only emissions that can be attributed to disks are from HD 163296, AS 209, the Flying Saucer (see Fig. 2), and perhaps GSS 26. Our line flux for AS 209 is slightly lower than that reported from SMA observations by Öberg et al. (2011), probably as a result of contamination, and we also detect the second group of hyperfine components that was below the sensitivity threshold for the SMA. We have clear evidence of cloud contamination in DoAR 24E, LFAM 1, because of negative features, and in CRBR 85. In the latter case (Fig. 2), the spectrum is the superposition of a very narrow component, with highly anomalous hyperfine ratios, and a broader component that may be due to an underlying disk. The case of IRS 41 remains unclear: there is some CN emission (1.1 ± 0.3 Jy km s-1), but relatively narrow, ~0.9 km s-1, and at a velocity where C17O shows residual contamination. Line parameters for the detected sources are indicated in Table 2.
For H2CO, contamination also seems to be rather widespread: negative signals are observed in El 20, SR 21, SR 4, El 27, DoAr 24E, and LFAM 1. Positive signals are detected in GSS 26, WSB 60, El 24, YLW 16c, and CRBR 85. This is a ratio of 11 to 29 sources.
SO is rare: there is strong emission in LFAM 1, and a strong negative signal in IRS 41, but nothing elsewhere.
Detected CN emission.
3.1. Specific objects
HD 163296.
Although only included here as a calibration source, we note that we have a 5σ detection of C17O, with a total line flux of 4.3 ± 0.9 Jy km s-1. The CN and 13CO line fluxes are consistent with previous measurements, indicating good calibration.
GSS 26.
This is one of the possible new disk detections in CN. The line width, however, is very narrow, 0.75 ± 0.12 km s-1, and is in fact consistent with that derived from H2CO lines, 0.63 ± 0.06 km s-1, although the systemic velocity differs slightly (3.81 ± 0.06 vs. 3.43 ± 0.03 km s-1). Either this is a disk seen nearly face-on, or the detected lines are residual contamination by the surroundings, as may be suggested by the rather strong C17O emission.
CRBR 85.
The spectra of CRBR 85 (also known as CRBR 2422.8-3423, see Comeron et al. 1993; Pontoppidan et al. 2005), clearly show two components: a very narrow component (ΔV ~ 0.5 km s-1) superimposed on a broader emission (ΔV ~ 1.5−2 km s-1). The narrow component exhibits very unusual hyperfine ratios for CN N = 2−1, which, if interpreted as saturation, would indicate very high opacities. However, they are most likely the result of our differential observation technique in a cloud extending over 2 arcmin that is nearly opaque in the strongest hyperfine components, as for CW Tau in Paper I.
The broad component may be attributable to disk or envelope emission. As CRBR 85 is a highly inclined, embedded object, the limited linewidth indicates a very low mass star if this emission comes from a disk. The other possibility is emission from a larger distance, that is, from the envelope. The low line flux would then indicate low excitation, since the detection of weak hyperfine components indicates substantial opacity. Note, however, that the main group of hyperfine components may be seriously affected by absorption or contamination due to the narrow component, which would result in higher apparent opacities than in reality.
LFAM 1.
Also known as GSS 30 IRS 3, this is a strong radio source with emission at 6 cm (Leous et al. 1991). This source is classified as a Class I source (Bontemps et al. 2001). The spectra in this direction are very unusual. We have strong emission from SO and SO2, but also the ion SO+, as well as several isotopologues of SO and SO2. H2CO is quite bright, and CN shows a negative feature that indicates contamination by a molecular cloud. S-bearing molecules are in general enhanced in shocks. In fact, SO+ is a clear indicator of shock chemistry (Turner 1992), predicted to be abundant in dissociative shocks (Neufeld & Dalgarno 1989), and has recently been detected in the jet-driven outflow of L1157 (Podio et al. 2014). The unusual spectrum of LFAM 1 therefore probably indicates an outflow from a very young object. Another possibility is some contribution from an outflow driven by GSS 30 IRS 1 because LFAM 1 is located 15′′ to the northeast of this Class I source, on the edge of its extended V-shaped nebula (see Fig. 8 of Allen et al. 2002), typical of a large outflow cavity.
YLW 16c.
This source is the only one clearly showing the double-peaked spectrum expected from Keplerian rotation in one molecule, here in H2CO. However, the H2CO/CN ratio is high. In Paper I, we only had strong H2CO emission and/or high H2CO/CN ratio from sources with outflows, or relatively massive stars, while YLW 16c is of spectral type M1.
4. Discussion
4.1. ρ Ophiuchi and Taurus: two different regions
The properties of sources in ρ Oph look very different from those in Taurus-Auriga: only two potential disk detections in CN (GSS 26, Flying Saucer), plus perhaps CRBR 85 and one source in SO (LFAM 1) out of 22 sources. In Taurus, there are 21 disks detected in CN (this number excludes the sources that also have SO emission of unknown origin) out of 46 sources, and 8 sources emitting in SO out of 41.
Our survey depth ranges between 0.18 to 0.65 Jy km s-1, with a median value of 0.32 Jy km s-1, a mean of 0.36, and a dispersion of 0.17. Rescaled to the same distance (i.e., corrected by a factor (120/140)2), the Taurus observations of Paper I reached a median sensitivity of 0.20 Jy km s-1 (mean 0.25) with a dispersion of 0.17. There is thus a typical factor of 1.5 in sensitivity.
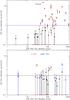 |
Fig. 3 CN line intensities vs 1.3 mm continuum flux. Red dots highlight detected sources in ρ Oph and Taurus, while blue is for sources in upper Scorpius. All fluxes have been rescaled to a distance of 120 pc. |
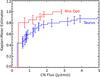 |
Fig. 4 Cumulative flux density distribution for CN emission in Taurus (blue line) and ρ Oph (red line), constructed using the Kaplan-Meier estimator to include upper limits and scaled to a common distance (d = 120 pc). The sample size are 46 stars for Taurus (Paper I) and 22 stars for ρ Oph. |
However, this does not appear to be the cause of the large apparent difference in detection statistics between the two regions. Figure 3 shows the CN line intensity vs. the 1.3 mm continuum flux (rescaled to a common distance of 120 pc) for both regions. Red indicates that CN has been detected. The Taurus region exhibited a high disk detection rate (>50%), whereas only three or four sources have been detected in the ρ Oph region. Furthermore, the population of bright disks found in Taurus has not been detected in our ρ Oph study.
We also performed a more detailed study of the CN flux density distribution in both regions. We applied a statistical treatment to our data that takes upper limits into account. We used the Kaplan-Meier estimator, which provides a maximum likelihood distribution for a randomly censored dataset. A part of our data being limited (upper limits), this estimator allows us to estimate the fraction of sources for which the flux is below (or above) a given value. The details about this method can be found in Feigelson & Nelson (1985). This estimator only requires that the censoring be random, which is the case in our samples since we have considered sources lying at different distances. We computed the Kaplan-Meier estimator for detections and nondetections (upper limits) for both samples. The results are displayed in Fig. 4. The distributions show the probability that a given source in our sample has a CN flux higher than the abscissa value. The difference between the two samples is large: for the Taurus region, the median value for the flux is ~0.8 Jy km s-1, whereas this value is about twice lower for the ρ Oph sample. Only 20% of the sources have a flux higher than 1 Jy km s-1 in ρ Oph, whereas the sources in Taurus are much brighter since 40% of the sources have a flux higher than 1 Jy km s-1.
4.2. Possible cause of these differences
The CN disk detection rate clearly is much lower in the ρ Oph region than in the Taurus region. Furthermore, we observed a lack of bright sources in ρ Oph. We discuss in this section some hypotheses that might explain the differences between the two regions.
Different stellar properties (sample bias)?
As discussed in Sect. 2.1, the two samples were not built using the same criteria. Unlike the Taurus sample, which included a variety of stars from spectral type M4 to A0, our ρ Oph sample mostly includes stars in the M2-K3 range and has no warm star (only one G5 and one G3). However, CN is most easily detected precisely in this M2-K3 range in Taurus sources (Paper I). If we restrict the Taurus sample to these spectral types, the difference between ρ Oph and Taurus is even more striking.
Contamination?
Might contamination be the only cause of the difference? While it is obviously stronger in this region, this looks very unlikely. Contamination by clouds is best traced by H2CO and C17O, which always show very narrow lines. Such narrow lines would not have prevented a detection of the wider lines coming from Keplerian disks in CN.
Smaller disks?
In Paper I, we suggested that CN surface densities were essentially constant (except in the warmer sources). Under this assumption, which was substantiated by chemical modelling (Chapillon et al. 2012), the CN line flux provides a nearly direct measure of the disk size. The apparent radii derived from the line flux under this simple hypothesis agreed well with interferometric determination in Taurus. With the same assumptions, the measured flux densities indicate here that we have detected three disks with outer radii 500−600 au (GSS 26, AS 209, and the Flying Saucer), have 3σ upper limits around 500 au for three other sources (WL 18, SR 24S and IRS 51), and that most sources are smaller than 320 au, with only one putative disk at 450 au, IRS 41.
The smaller size observed here may be due to the source ages, disks in ρ Oph being younger and therefore having less time to spread by viscous effects. Making this statement quantitative is difficult, however, because the age difference between ρ Oph (age < 1 Myr Luhman & Rieke 1999) and Taurus (~ 1 Myr, but with sources up to a few Myr Luhman et al. 2003) is not well known. In the framework of self-similar viscously spreading disks (Lynden-Bell & Pringle 1974), the disk radius evolves with time as T1/(2−γ), where γ is the radial exponent of the viscosity and T = 1 + t∗/ts, t∗ being the disk age and ts the viscous timescale. The classical α disk prescription yields γ = 3/2−q , where q is the radial exponent of the temperature law, thus γ ~ 1 as q ~ 0.5 for typical disks (see, e.g., Guilloteau et al. 2011, for derivations). Viscous timescales are unfortunately poorly known. Given all uncertainties, it is possible that viscous spreading in disks located in the Taurus region produces disk sizes larger by 1.2 to 2 times than those in ρ Oph. Even a limited size difference might be sufficient to explain the observed distribution: according to Fig. 4, 80% of the sample sources have a flux below 1 Jy km s-1 in ρ Oph, while for Taurus this is obtained for 2−3 Jy km s-1, which means that radii differing by 1.4−1.7 could bring the two distributions to agree reasonably well. ρ Oph would still lack the brighter sources found in Taurus, but these are presumably outflows, not disks.
The smaller size might also be a result of initial conditions linked to the more crowded environment in ρ Oph, an effect that is known to affect the size of the protostellar envelopes (Motte et al. 1998). The missing protostellar material at large distances is the one with the highest angular momentum, which means that disks may be born smaller in ρ Oph.
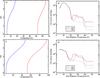 |
Fig. 5 Panel a): two extreme temperature profiles at 300 au for a weak temperature gradient, and corresponding CN column density as a function of the disk midplane temperature for three different ages: 1, 2, and 5 Myr are shown in panel b). Panels c), d): as a), b), but for a strong temperature gradient. |
Different CN chemistry?
The intrinsic differences in disk properties between ρ Oph and Taurus can affect the CN chemistry and invalidate the assumption of similar CN surface densities, however. Because ρ Oph is younger, the stars are brighter: from evolutionary tracks, a factor of about 2−3 in luminosities for stars between 1 and 3 Myr is expected. This in turn should lead to a factor (2−3)1/4 = 1.2−1.3 in disk temperature at the same radius. Moreover, disks are not at chemical equilibrium, therefore age matters. In the next section, we present the results we obtained with our chemical model that evaluates the importance of these effects.
4.3. Impact of the chemistry
We used the Nautilus gas-grain model described in Semenov et al. (2010) and Reboussin et al. (2014). Nautilus computes the abundance of species as a function of time in the gas phase and at the surface of the grains. The chemical network contains 8624 reactions: 6844 are pure gas-phase reactions, 1780 are grain-surface and gas-grain interactions. The gas-phase network used for this work is the same as described in Reboussin et al. (2014). The full network is available on the KIDA (KInetic Database for Astrochemistry) website2. The dust grains are represented by spherical particles with a radius of 0.1 μm and are made of amorphous olivine. The gas and dust temperatures were assumed to be the same, and we used a dust-to-gas mass ratio of 0.01. To obtain the initial chemical composition of the disk, we first computed the chemical composition of the parent molecular cloud. We ran Nautilus during 106 yr for typical dense cloud conditions: a gas density of 2 × 104 cm-3, a temperature of 10 K, a visual extinction of 10, a cosmic ray ionization rate of 1.3 × 10⁻¹⁷ s-1, and a C/O ratio of 0.5. The elemental abundances used for this work are listed in Reboussin et al. (2014, see Table 1 of their paper), except for the oxygen elemental abundance, for which we considered the value 3.3 × 10⁻⁴ (a low-depletion case). For the disk physical parameters, we used the parametric disk model described in Hersant et al. (2009) except for the vertical temperature profile, which is based on Williams & Best (2014). The model corresponds to a disk mass of 0.03 M⊙ with a 1/r1.5 surface density profile out to r = 700 au. The disk mid-plane temperature was used as a free parameter. The abundances of chemical species in the disk were calculated up to 5 × 10⁶ yr.
Figure 5 shows the CN column densities as a function of the disk midplane temperature at a radius of 300 au, at three different disk ages and for two different temperature profiles (small or strong vertical gradient). Overall, the CN column density decreases as the temperature increases and even reaches values well below any detectable levels (down to a few 1011 cm-2) at temperatures above 40 K in the disk midplane. With the 30 m radiotelescope, our detection limit is around 3 × 1012 cm-2 for a disk of 400 au radius for a detection level of 1 Jy km s-1. This value does not vary much with the temperature. The temperature dependence is complex and non-monotonic because the dominant reaction routes for CN change with temperature. The gas-phase CN abundance is mostly affected by grain-surface chemistry: at higher temperatures, the diffusion of the species at the surface of the grain is much more efficient, which contributes to convert molecules on grains into less volatile forms. As this conversion process is relatively slow, the temperature dependence is more pronounced at later ages. The difference between the two temperature profiles is quite small at high temperatures, but for very low temperatures (below 15 K), the CN column density is lower when we use a strong temperature gradient. These results agree with the observations obtained in Paper I, in which CN was undetectable in most warm sources. As mentioned before, all these simulations were performed considering the same temperature for the gas and dust. Models in which these two quantities differ indicate that the decisive factor for CN chemistry is the dust temperature. Figure 5 also shows that the 20−30% higher temperature of disks in ρ Oph is sufficient to affect the CN surface density by a factor of a few, except for very low temperatures (below 10 K). Similar differences exist as a function of disk ages for disk temperatures above 15 K.
5. Conclusions
We have performed a sensitive survey of 29 young stars in the ρ Oph and upper Scorpius regions in CN, ortho-H2CO, SO, 13CO, and C17O rotational lines near 206−228 GHz with the IRAM 30 m telescope. Compared to a similar study performed for the isolated star formation region Taurus-Auriga, the detection rate of CN is much lower in the ρ Oph region.
This result may indicate that disks in the ρ Oph region are on average smaller than those in the Taurus-Auriga complex, perhaps because they have not spread out sufficiently by viscous diffusion, or as a result of initial truncation of their parental protostellar condensation.
However, the CN chemistry is shown to be sensitive to disk temperature, so that a direct comparison of the disk properties would require resolving the disks out instead of relying on the good correlation between CN flux and disk radii previously found in the Taurus region. Interferometric observations are required for this purpose.
Finally, these results show that even large single-dish telescopes are severely limited in identifying disks around embedded young stars because of contamination, but also because of sensitivity. Disks smaller than about 300 au, which represent 50% of the disks in the sample studied by Guilloteau et al. (2013) in the Taurus region, are beyond the sensitivity limit of even the largest telescope operating at 1.3 mm, the IRAM 30 m. Only ALMA is sensitive enough in the southern hemisphere to detect a substantial fraction of the gas disk population.
Online material
Appendix A: Spectra for individual sources
This appendix displays the spectra toward the various sources (in the same order as listed in Table 1). For each source, the top panel shows the 13CO J = 2−1 spectrum. The bottom panel displays on a common scale from top to bottom the spectra of 13CO J = 2−1 (with fit as in top panel), C17O J = 2−1, CN N = 2−1, the average of both o-H2CO transitions, and SO 54−43, shifted in intensity by multiples of 0.15 K to avoid overlap. The intensity scale is the antenna temperature ( in K): a conversion to flux density can be obtained using a factor of 9 Jy/K.
The spectral resolution is 0.26 km s-1 in the upper panel, while the other spectra have been smoothed by a factor 1, 2, or 4 for better clarity.
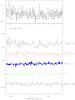 |
Fig. A.1 Lines toward V1146 Sco. |
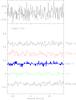 |
Fig. A.2 Lines toward J1603-1751. |
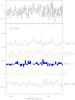 |
Fig. A.3 Lines toward AS 205A. |
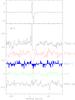 |
Fig. A.4 Lines toward SR 4. |
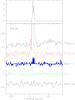 |
Fig. A.5 Lines toward GSS 26. |
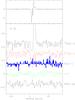 |
Fig. A.6 Lines toward EL 20. |
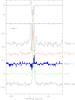 |
Fig. A.7 Lines toward LFAM 1. |
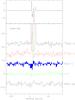 |
Fig. A.8 Lines toward DoAr 24E. |
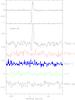 |
Fig. A.9 Lines toward DoAr 25. |
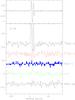 |
Fig. A.10 Lines toward EL 24. |
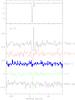 |
Fig. A.11 Lines toward EL 27. |
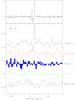 |
Fig. A.12 Lines toward WL 18. |
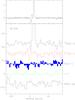 |
Fig. A.13 Lines toward SR 24S. |
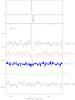 |
Fig. A.14 Lines toward SR 21. |
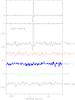 |
Fig. A.15 Lines toward J1627-2451B. |
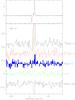 |
Fig. A.16 Lines toward IRS 41. |
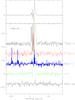 |
Fig. A.17 Lines toward CRBR 85. |
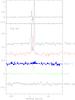 |
Fig. A.18 Lines toward YLW 16c. |
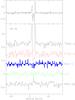 |
Fig. A.19 Lines toward IRS 49. |
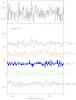 |
Fig. A.20 Lines toward DoAr 33. |
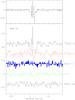 |
Fig. A.21 Lines toward WSB 52. |
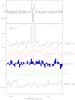 |
Fig. A.22 Lines toward IRS 51. |
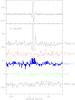 |
Fig. A.23 Lines toward Flying Saucer. |
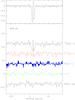 |
Fig. A.24 Lines toward WSB 60. |
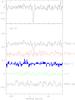 |
Fig. A.25 Lines toward SR 13. |
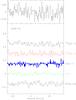 |
Fig. A.26 Lines toward DoAr 44. |
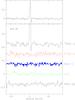 |
Fig. A.27 Lines toward RNO 90. |
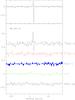 |
Fig. A.28 Lines toward Wa Oph 6. |
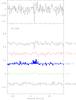 |
Fig. A.29 Lines toward AS 209. |
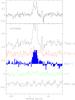 |
Fig. A.30 Lines toward HD 163296. |
However, Loinard et al. (2008b) reported for the two stars WL 5 and VSSG 14 (located near IRS 41) preliminary measurements indicating a distance of ~ 165 pc.
Acknowledgments
We acknowledge all the 30 m IRAM staff for their help during the observations. This work was supported by “Programme National de Physique Stellaire” (PNPS) and “Programme National de Physique Chimie du Milieu Interstellaire” (PCMI) from INSU/CNRS. The work of M.S. was supported in part by NSF grant AST 09-07745. This research has made use of the SIMBAD database, operated at CDS, Strasbourg, France. V.W.’s research work is funded by the ERC Starting Grant (3DICE, grant agreement 336474).
References
- Allen, L. E., Myers, P. C., Di Francesco, J., et al. 2002, ApJ, 566, 993 [NASA ADS] [CrossRef] [Google Scholar]
- Andrews, S. M., Wilner, D. J., Hughes, A. M., Qi, C., & Dullemond, C. P. 2010, ApJ, 723, 1241 [NASA ADS] [CrossRef] [Google Scholar]
- Bast, J. E., Brown, J. M., Herczeg, G. J., van Dishoeck, E. F., & Pontoppidan, K. M. 2011, A&A, 527, A119 [NASA ADS] [CrossRef] [EDP Sciences] [Google Scholar]
- Bontemps, S., André, P., Kaas, A. A., et al. 2001, A&A, 372, 173 [NASA ADS] [CrossRef] [EDP Sciences] [Google Scholar]
- Chapillon, E., Guilloteau, S., Dutrey, A., Piétu, V., & Guélin, M. 2012, A&A, 537, A60 [NASA ADS] [CrossRef] [EDP Sciences] [Google Scholar]
- Comeron, F., Rieke, G. H., Burrows, A., & Rieke, M. J. 1993, ApJ, 416, 185 [NASA ADS] [CrossRef] [Google Scholar]
- Dartois, E., Dutrey, A., & Guilloteau, S. 2003, A&A, 399, 773 [NASA ADS] [CrossRef] [EDP Sciences] [Google Scholar]
- de Geus, E. J., de Zeeuw, P. T., & Lub, J. 1989, A&A, 216, 44 [NASA ADS] [Google Scholar]
- Dobashi, K., Marshall, D. J., Shimoikura, T., & Bernard, J.-P. 2013, PASJ, 65, 31 [NASA ADS] [Google Scholar]
- Feigelson, E. D., & Nelson, P. I. 1985, ApJ, 293, 192 [NASA ADS] [CrossRef] [Google Scholar]
- Grosso, N., Alves, J., Wood, K., et al. 2003, ApJ, 586, 296 [NASA ADS] [CrossRef] [Google Scholar]
- Guilloteau, S., Dutrey, A., Piétu, V., & Boehler, Y. 2011, A&A, 529, A105 [NASA ADS] [CrossRef] [EDP Sciences] [Google Scholar]
- Guilloteau, S., Di Folco, E., Dutrey, A., et al. 2013, A&A, 549, A92 [NASA ADS] [CrossRef] [EDP Sciences] [Google Scholar]
- Hersant, F., Wakelam, V., Dutrey, A., Guilloteau, S., & Herbst, E. 2009, A&A, 493, L49 [NASA ADS] [CrossRef] [EDP Sciences] [Google Scholar]
- Johnstone, D., Hollenbach, D., & Bally, J. 1998, ApJ, 499, 758 [NASA ADS] [CrossRef] [Google Scholar]
- Knude, J., & Hog, E. 1998, A&A, 338, 897 [NASA ADS] [Google Scholar]
- Lada, C. J., & Lada, E. A. 2003, ARA&A, 41, 57 [NASA ADS] [CrossRef] [Google Scholar]
- Leous, J. A., Feigelson, E. D., Andre, P., & Montmerle, T. 1991, ApJ, 379, 683 [NASA ADS] [CrossRef] [Google Scholar]
- Loinard, L., Torres, R. M., Mioduszewski, A. J., & Rodríguez, L. F. 2008a, ApJ, 675, L29 [NASA ADS] [CrossRef] [Google Scholar]
- Loinard, L., Torres, R. M., Mioduszewski, A. J., & Rodríguez, L. F. 2008b, in IAU Symp., 248, eds. W. J. Jin, I. Platais, & M. A. C. Perryman, 186 [Google Scholar]
- Luhman, K. L., & Rieke, G. H. 1999, ApJ, 525, 440 [NASA ADS] [CrossRef] [Google Scholar]
- Luhman, K. L., Stauffer, J. R., Muench, A. A., et al. 2003, ApJ, 593, 1093 [NASA ADS] [CrossRef] [Google Scholar]
- Lynden-Bell, D., & Pringle, J. E. 1974, MNRAS, 168, 603 [NASA ADS] [CrossRef] [Google Scholar]
- Mann, R. K., Di Francesco, J., Johnstone, D., et al. 2014, ApJ, 784, 82 [NASA ADS] [CrossRef] [Google Scholar]
- Motte, F., Andre, P., & Neri, R. 1998, A&A, 336, 150 [NASA ADS] [Google Scholar]
- Neufeld, D. A., & Dalgarno, A. 1989, ApJ, 340, 869 [NASA ADS] [CrossRef] [Google Scholar]
- Öberg, K. I., Qi, C., Fogel, J. K. J., et al. 2011, ApJ, 734, 98 [NASA ADS] [CrossRef] [Google Scholar]
- Palla, F., & Stahler, S. W. 1999, ApJ, 525, 772 [NASA ADS] [CrossRef] [Google Scholar]
- Podio, L., Lefloch, B., Ceccarelli, C., Codella, C., & Bachiller, R. 2014, A&A, 565, A64 [NASA ADS] [CrossRef] [EDP Sciences] [Google Scholar]
- Pontoppidan, K. M., Dullemond, C. P., van Dishoeck, E. F., et al. 2005, ApJ, 622, 463 [NASA ADS] [CrossRef] [Google Scholar]
- Qi, C., Wilner, D. J., Calvet, N., et al. 2006, ApJ, 636, L157 [NASA ADS] [CrossRef] [Google Scholar]
- Reboussin, L., Wakelam, V., Guilloteau, S., & Hersant, F. 2014, MNRAS, 440, 3557 [NASA ADS] [CrossRef] [Google Scholar]
- Ricci, L., Testi, L., Natta, A., & Brooks, K. J. 2010, A&A, 521, A66 [NASA ADS] [CrossRef] [EDP Sciences] [Google Scholar]
- Semenov, D., Hersant, F., Wakelam, V., et al. 2010, A&A, 522, A42 [NASA ADS] [CrossRef] [EDP Sciences] [Google Scholar]
- Turner, B. E. 1992, ApJ, 396, L107 [NASA ADS] [CrossRef] [Google Scholar]
- Williams, J. P., & Best, W. M. J. 2014, ApJ, 788, 59 [NASA ADS] [CrossRef] [Google Scholar]
All Tables
All Figures
|
Fig. 1 Extinction maps of the ρ-Oph star-forming region (based on the 2MASS PSC Dobashi et al. 2013), contours from 1 to 18 mag in steps of 1 mag. The bottom map is a zoom on the area in which most sources are located (black square in the top map). Asterisks are sources with CN detection. |
| In the text | |
|
Fig. 2 Lines toward CRBR 85 and the Flying Saucer. Top panel: 13CO J = 2−1 spectrum. Bottom panel, from top to bottom: 13CO J = 2−1, C17O J = 2−1, CN N = 2−1, the average of both o-H2CO transitions, and SO 54−43, shifted in intensity by multiples of 0.15 K to avoid overlap. The intensity scale is the antenna temperature ( |
| In the text | |
|
Fig. 3 CN line intensities vs 1.3 mm continuum flux. Red dots highlight detected sources in ρ Oph and Taurus, while blue is for sources in upper Scorpius. All fluxes have been rescaled to a distance of 120 pc. |
| In the text | |
|
Fig. 4 Cumulative flux density distribution for CN emission in Taurus (blue line) and ρ Oph (red line), constructed using the Kaplan-Meier estimator to include upper limits and scaled to a common distance (d = 120 pc). The sample size are 46 stars for Taurus (Paper I) and 22 stars for ρ Oph. |
| In the text | |
|
Fig. 5 Panel a): two extreme temperature profiles at 300 au for a weak temperature gradient, and corresponding CN column density as a function of the disk midplane temperature for three different ages: 1, 2, and 5 Myr are shown in panel b). Panels c), d): as a), b), but for a strong temperature gradient. |
| In the text | |
|
Fig. A.1 Lines toward V1146 Sco. |
| In the text | |
|
Fig. A.2 Lines toward J1603-1751. |
| In the text | |
|
Fig. A.3 Lines toward AS 205A. |
| In the text | |
|
Fig. A.4 Lines toward SR 4. |
| In the text | |
|
Fig. A.5 Lines toward GSS 26. |
| In the text | |
|
Fig. A.6 Lines toward EL 20. |
| In the text | |
|
Fig. A.7 Lines toward LFAM 1. |
| In the text | |
|
Fig. A.8 Lines toward DoAr 24E. |
| In the text | |
|
Fig. A.9 Lines toward DoAr 25. |
| In the text | |
|
Fig. A.10 Lines toward EL 24. |
| In the text | |
|
Fig. A.11 Lines toward EL 27. |
| In the text | |
|
Fig. A.12 Lines toward WL 18. |
| In the text | |
|
Fig. A.13 Lines toward SR 24S. |
| In the text | |
|
Fig. A.14 Lines toward SR 21. |
| In the text | |
|
Fig. A.15 Lines toward J1627-2451B. |
| In the text | |
|
Fig. A.16 Lines toward IRS 41. |
| In the text | |
|
Fig. A.17 Lines toward CRBR 85. |
| In the text | |
|
Fig. A.18 Lines toward YLW 16c. |
| In the text | |
|
Fig. A.19 Lines toward IRS 49. |
| In the text | |
|
Fig. A.20 Lines toward DoAr 33. |
| In the text | |
|
Fig. A.21 Lines toward WSB 52. |
| In the text | |
|
Fig. A.22 Lines toward IRS 51. |
| In the text | |
|
Fig. A.23 Lines toward Flying Saucer. |
| In the text | |
|
Fig. A.24 Lines toward WSB 60. |
| In the text | |
|
Fig. A.25 Lines toward SR 13. |
| In the text | |
|
Fig. A.26 Lines toward DoAr 44. |
| In the text | |
|
Fig. A.27 Lines toward RNO 90. |
| In the text | |
|
Fig. A.28 Lines toward Wa Oph 6. |
| In the text | |
|
Fig. A.29 Lines toward AS 209. |
| In the text | |
|
Fig. A.30 Lines toward HD 163296. |
| In the text | |
Current usage metrics show cumulative count of Article Views (full-text article views including HTML views, PDF and ePub downloads, according to the available data) and Abstracts Views on Vision4Press platform.
Data correspond to usage on the plateform after 2015. The current usage metrics is available 48-96 hours after online publication and is updated daily on week days.
Initial download of the metrics may take a while.