Fig. 2
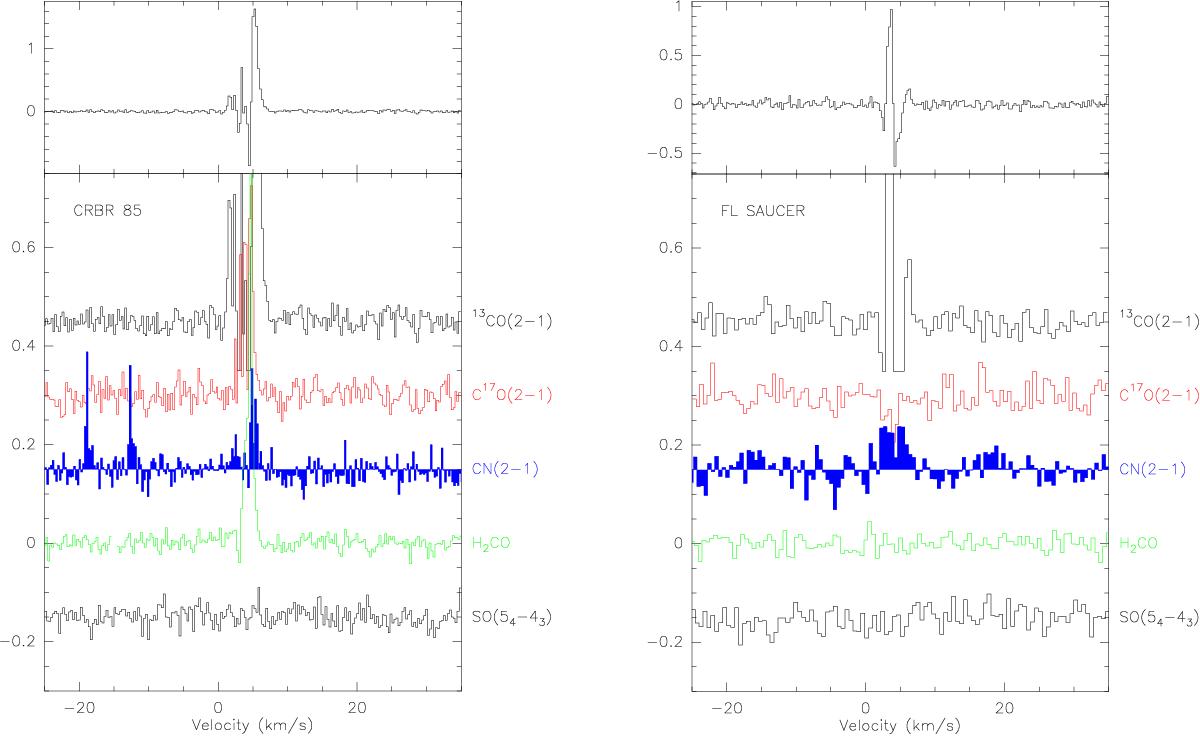
Lines toward CRBR 85 and the Flying Saucer. Top panel: 13CO J = 2−1 spectrum. Bottom panel, from top to bottom: 13CO J = 2−1, C17O J = 2−1, CN N = 2−1, the average of both o-H2CO transitions, and SO 54−43, shifted in intensity by multiples of 0.15 K to avoid overlap. The intensity scale is the antenna temperature (![]() in K): conversion to flux density can be obtained using a factor of 9 Jy/K. The spectral resolution is 0.26 km s-1. For the Flying Saucer, the bottom panel spectra has been smoothed by a factor 2 for better clarity.
in K): conversion to flux density can be obtained using a factor of 9 Jy/K. The spectral resolution is 0.26 km s-1. For the Flying Saucer, the bottom panel spectra has been smoothed by a factor 2 for better clarity.
Current usage metrics show cumulative count of Article Views (full-text article views including HTML views, PDF and ePub downloads, according to the available data) and Abstracts Views on Vision4Press platform.
Data correspond to usage on the plateform after 2015. The current usage metrics is available 48-96 hours after online publication and is updated daily on week days.
Initial download of the metrics may take a while.