Free Access
Fig. 1
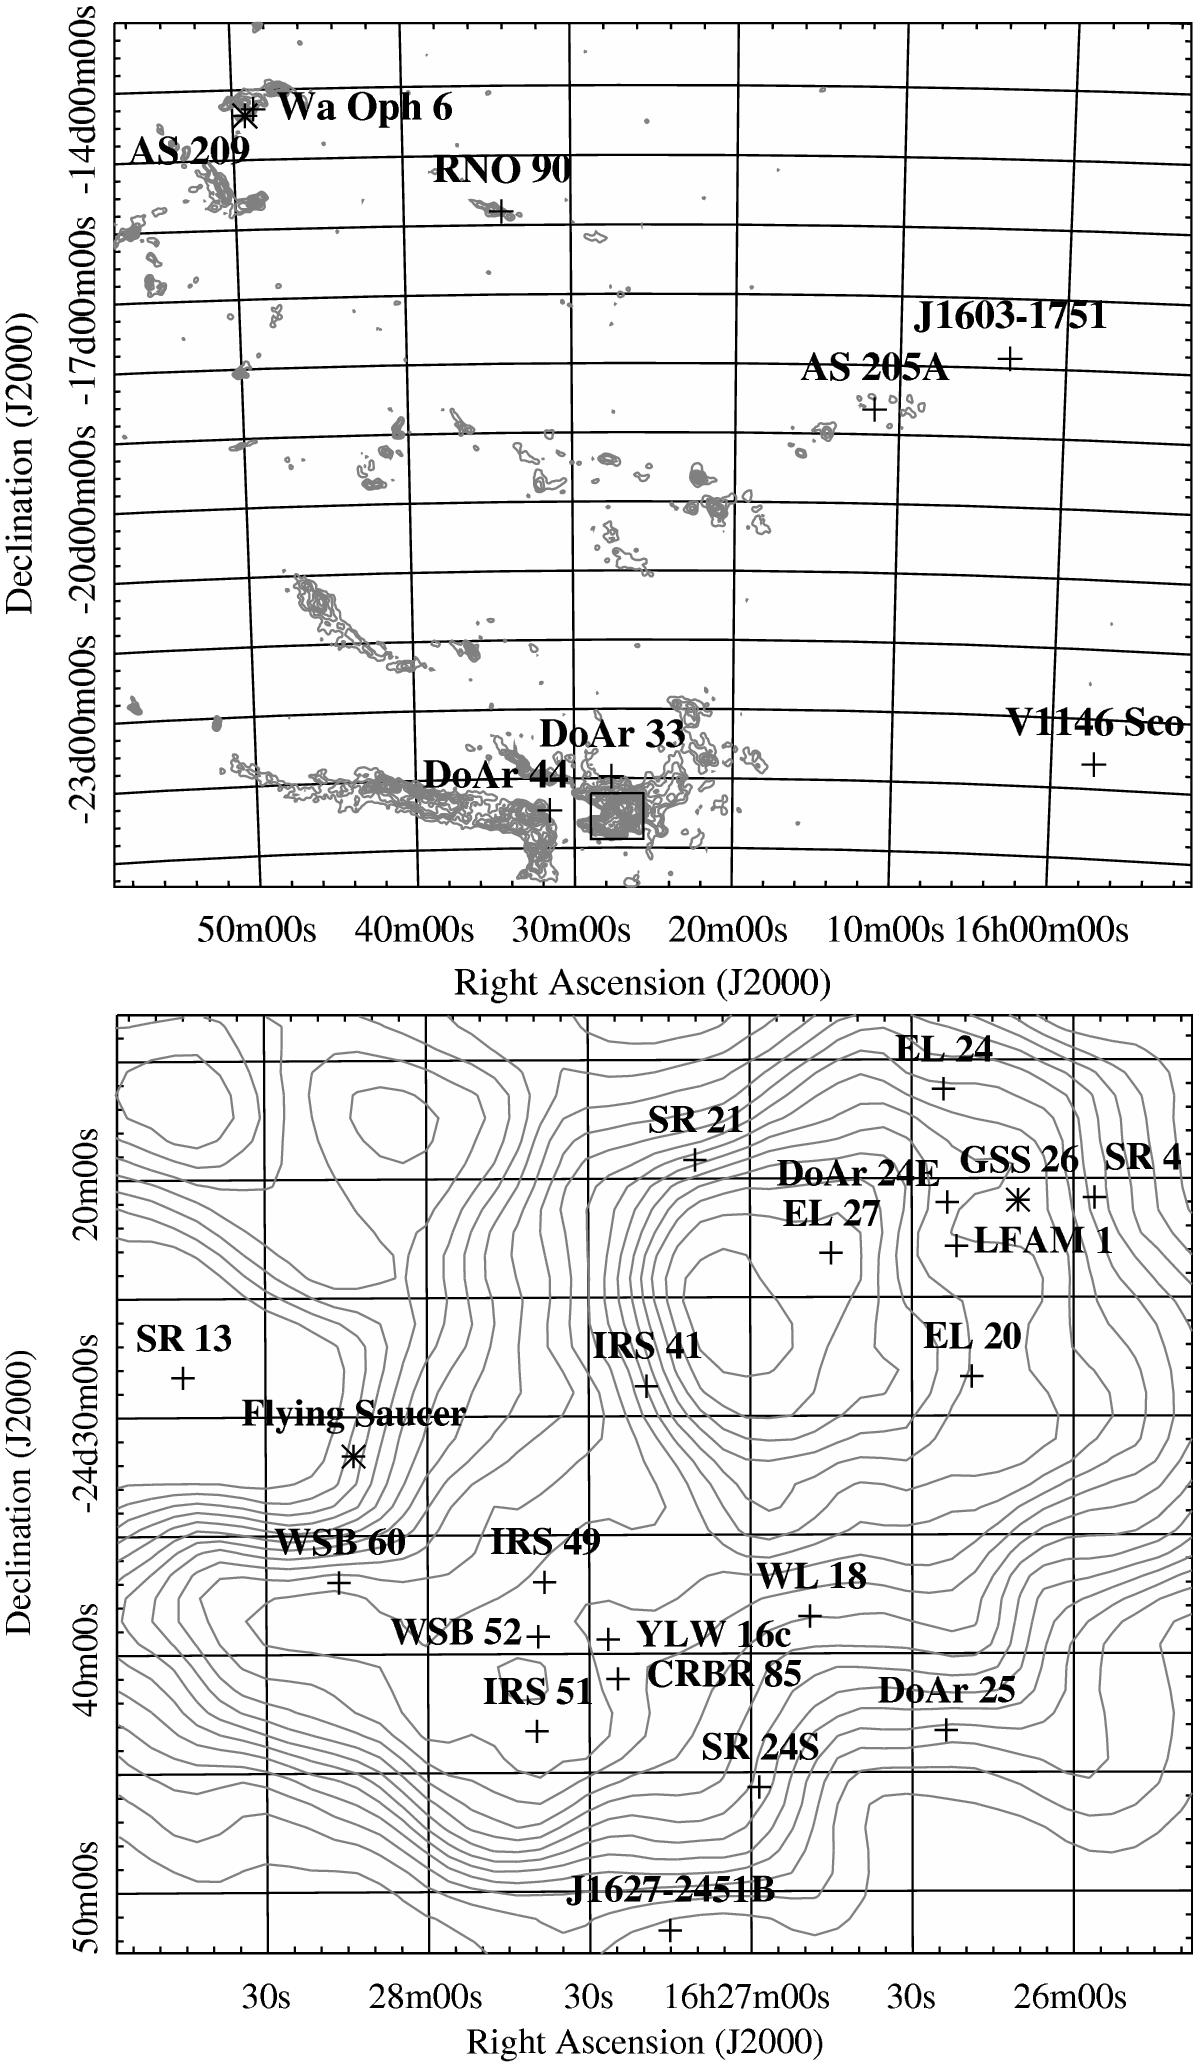
Extinction maps of the ρ-Oph star-forming region (based on the 2MASS PSC Dobashi et al. 2013), contours from 1 to 18 mag in steps of 1 mag. The bottom map is a zoom on the area in which most sources are located (black square in the top map). Asterisks are sources with CN detection.
This figure is made of several images, please see below:
Current usage metrics show cumulative count of Article Views (full-text article views including HTML views, PDF and ePub downloads, according to the available data) and Abstracts Views on Vision4Press platform.
Data correspond to usage on the plateform after 2015. The current usage metrics is available 48-96 hours after online publication and is updated daily on week days.
Initial download of the metrics may take a while.