Free Access
Fig. 3
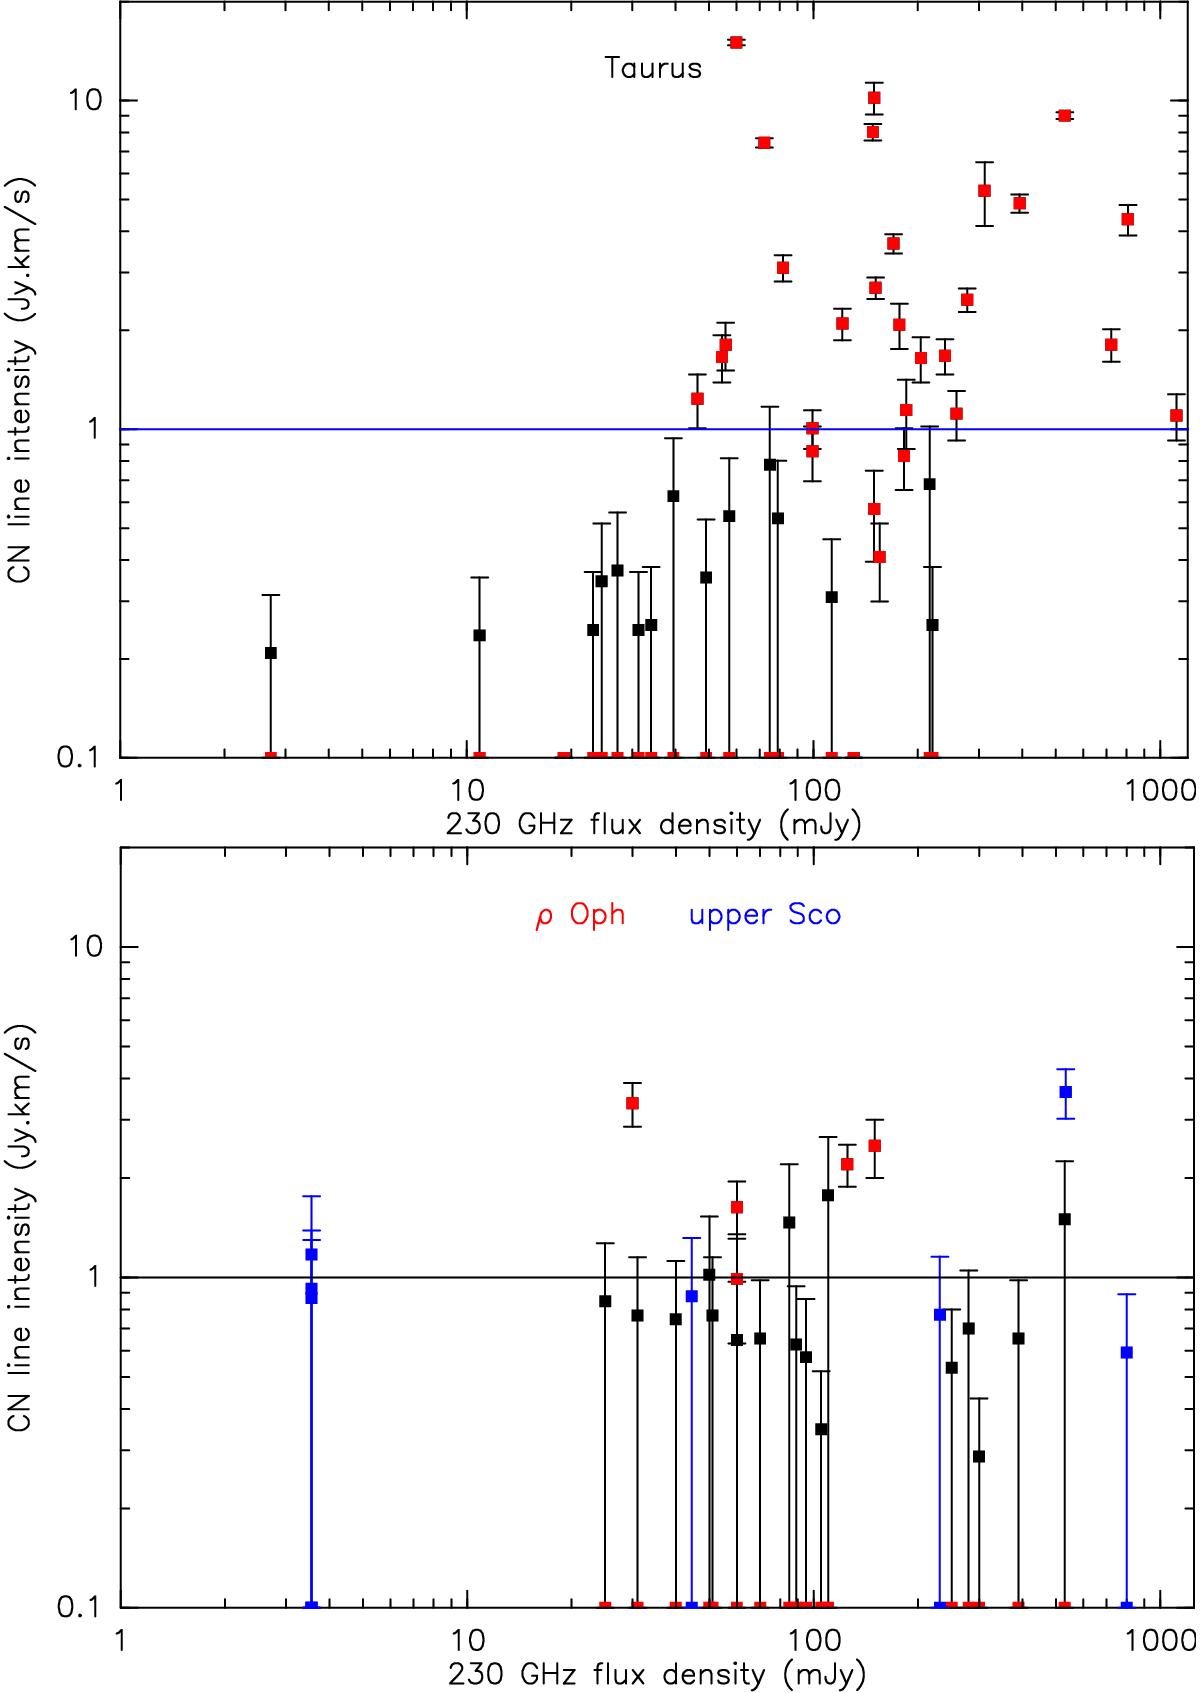
CN line intensities vs 1.3 mm continuum flux. Red dots highlight detected sources in ρ Oph and Taurus, while blue is for sources in upper Scorpius. All fluxes have been rescaled to a distance of 120 pc.
This figure is made of several images, please see below:
Current usage metrics show cumulative count of Article Views (full-text article views including HTML views, PDF and ePub downloads, according to the available data) and Abstracts Views on Vision4Press platform.
Data correspond to usage on the plateform after 2015. The current usage metrics is available 48-96 hours after online publication and is updated daily on week days.
Initial download of the metrics may take a while.