| Issue |
A&A
Volume 578, June 2015
|
|
|---|---|---|
| Article Number | A81 | |
| Number of page(s) | 14 | |
| Section | Interstellar and circumstellar matter | |
| DOI | https://doi.org/10.1051/0004-6361/201425347 | |
| Published online | 10 June 2015 | |
Chemical composition of the circumstellar disk around AB Aurigae⋆
1
Observatorio Astronómico Nacional (OAN),
Apdo 112, 28803 Alcalá de
Henares, Madrid,
Spain
e-mail: This email address is being protected from spambots. You need JavaScript enabled to view it.
; This email address is being protected from spambots. You need JavaScript enabled to view it.
2
Instituto de Ciencia de Materiales de Madrid, ICMM-CSIC,
C/ Sor Juana Inés de la Cruz
3, 28049
Cantoblanco,
Spain
e-mail: This email address is being protected from spambots. You need JavaScript enabled to view it.
3
Institut de Radioastronomie Millimétrique,
300 rue de la Piscine, 38406 Saint Martin
d’Hères,
France
4
Université de Toulouse, UPS-OMP, IRAP, 31400
Toulouse,
France
5
CNRS, IRAP, 9
Av. colonel Roche, BP
44346, 31028
Toulouse Cedex 4,
France
6
Institut de Planétologie et d’Astrophysique de Grenoble (IPAG) UMR
5274, Université UJF-Grenoble 1/CNRS-INSU, 38041
Grenoble,
France
7
UMI-FCA, CNRS/INSU, UMI,
3386,
France
8
Dept. de Astronomía, Universidad de Chile,
1058
Santiago,
Chile
Received: 17 November 2014
Accepted: 6 March 2015
Abstract
Aims. Our goal is to determine the molecular composition of the circumstellar disk around AB Aurigae (hereafter, AB Aur). AB Aur is a prototypical Herbig Ae star and the understanding of its disk chemistry is paramount for understanding the chemical evolution of the gas in warm disks.
Methods. We used the IRAM 30-m telescope to perform a sensitive search for molecular lines in AB Aur as part of the IRAM Large program ASAI (a chemical survey of Sun-like star-forming regions). These data were complemented with interferometric observations of the HCO+ 1→0 and C17O 1→0 lines using the IRAM Plateau de Bure Interferometer (PdBI). Single-dish and interferometric data were used to constrain chemical models.
Results. Throughout the survey, several lines of CO and its isotopologues, HCO+, H2CO, HCN, CN, and CS, were detected. In addition, we detected the SO 54→33 and 56→45 lines, confirming the previously tentative detection. Compared to other T Tauri and Herbig Ae disks, AB Aur presents low HCN 3→2/HCO+ 3→2 and CN 2→1/HCN 3→2 line intensity ratios, similar to other transition disks. AB Aur is the only protoplanetary disk detected in SO thus far, and its detection is consistent with interpretation of this disk being younger than those associated with T Tauri stars.
Conclusions. We modeled the line profiles using a chemical model and a radiative transfer 3D code. Our model assumes a flared disk in hydrostatic equilibrium. The best agreement with observations was obtained for a disk with a mass of 0.01 M⊙, Rin = 110 AU, Rout = 550 AU, a surface density radial index of 1.5, and an inclination of 27◦. The intensities and line profiles were reproduced within a factor of ∼2 for most lines. This agreement is reasonable considering the simplicity of our model that neglects any structure within the disk. However, the HCN 3→2 and CN 2→1 line intensities were predicted to be more intense by a factor of >10. We discuss several scenarios to explain this discrepancy.
Key words: stars: formation / stars: individual: AB Aurigae / stars: pre-main sequence / stars: variables: T Tauri, Herbig Ae/Be / circumstellar matter / protoplanetary disks
Appendix A is available in electronic form at http://www.aanda.org
© ESO, 2015
1. Introduction
Circumstellar disks are commonly observed around pre-main sequence stars (e.g., Howard et al. 2013; Strom et al. 1989). The formation of disks, together with ejecta phenomena such as outflows and jets, dissipate away the excess of angular momentum that prevents accretion from the parent cloud. The chemical composition of dust and gas contained in these disks provides information about the initial conditions in the formation of planetary systems (Dutrey et al. 2014).
The comprehension of chemistry in disks is an important step toward understanding of the formation of complex organic, even prebiotic molecules on planets. However, the disk chemistry is a very unexplored field from the observational point of view with very few molecular detections. This scarcity of molecules seems more accentuated in disks around Herbig Ae stars (Öberg et al. 2011). This is mainly due to the low molecular abundances in a gas disk that itself has a low mass content. The ultraviolet radiation from the central star photodissociates molecules in the surface layers of the disk. Deeper in the midplane, the temperatures drop, and all the detectable molecules freeze out onto dust grains. As a result, molecules can only survive in the gas phase inside a thin layer. For F and A stars with effective temperatures in the range between 6000 to 10 000 K, the UV-photons penetrate deeper into the disk than the colder M and K stars (Teff ∼ 2500–5000 K), causing the drop of the molecular detection rates. Most species detected are simple molecules, molecular radicals, and ions, such as CO, 13CO, C18O, CN, CS, C34S, C2H, HCN, H13CN, HNC, DCN, HC3N, HCO+, H13CO+, DCO+, H2D+, N2H+, c-C3H2, H2CO, H2O, and HD (e.g., Kastner et al. 1997; van Dishoeck et al. 2003; Thi et al. 2004; Qi et al. 2008; Guilloteau et al. 2006; Piétu et al. 2007; Dutrey et al. 2007).
Unfortunately, most disks remain unresolved even with the largest millimeter interferometers. A detailed study of the chemical composition of the gas in a disk requires not only high angular resolution observations in dust continuum and molecular lines, but also accurate chemical and physical models. These models help to constrain the disk structure in accordance with the observations and calculate the molecular abundance profiles. In recent years, the chemical and radiative transfer models have improved their performances, (see, e.g., Thi et al. 2013; Pinte et al. 2010; Nomura et al. 2009; Agúndez et al. 2008; Dutrey et al. 2007).
Herbig Ae/Be stars are intermediate-mass pre-main sequence sources that emit much stronger thermal UV radiation than do T Tauri stars (TTs). Therefore, their circumstellar disks are warmer and more ionized. Our target, AB Aurigae (hereafter, AB Aur) is one of the best-studied Herbig Ae stars that host a prototypical Herbig Ae disk. It has a spectral type A0-A1 (Hernández et al. 2004). It has a M⋆ ∼ 2.4M⊙, a Teff ∼ 9500 K, and it is located at a distance of 145 pc (van den Ancker et al. 1998). The disk around AB Aur shows a complex structure. It is larger (Rout ∼ 1100 AU, ≈7″), than those around TTs, and it shows spiral-arm features traced by millimeter continuum emission, at about 140 AU from the star (Piétu et al. 2005).
By modeling the 12CO and its isotopologue lines obtained from subarcsec imaging with the Plateau de Bure Interferometer (PdBI), it was found that, contrary to typical disks associated with TTs, the AB Aur disk is warm (>25 K all across the disk) and shows no evidence of CO depletion (Piétu et al. 2005). Schreyer et al. (2008) carried out a chemical study of the disk around AB Aur with the PdBI searching for the HCO+ 1→0, CS 2→1, HCN 1→0, and C2H 1→0 lines, but with only one detection, the HCO+ 1→0 line. They propose that the poor molecular content of this disk is because the UV-photons dissociate molecules. More recently, Fuente et al. (2010) have carried out a molecular search using the IRAM 30-m telescope. As a result, they detected the SO 34→23 line. SO had never been detected before in a T Tauri or Herbig Ae disk. Its detection provided further support to the interpretation of a warmer chemistry in this kind of Herbig Ae disk, even if there are some observations that suggest the possibility that the SO emission could be coming from an outflow or from an envelope rather than from the circumstellar disk (Guilloteau et al. 2013).
In this paper we investigate the molecular composition on the AB Aur disk from data obtained as part of the IRAM Large program ASAI (a chemical survey of Sun-like star-forming regions, PIs: R. Bachiller, B. Lefloch). These data were complemented with interferometric observations using the IRAM PdBI. Single-dish and interferometric data were used to constrain chemical models. A spectral survey is a powerful tool for characterizing the chemical composition of a source. It is the only way to get a complete census of all molecular species and to provide several lines of the same molecule, giving the possibility of multiline analysis and modeling.
To reach our aim, we use an updated version of the chemical model described in Agúndez et al. (2008) and the 3D radiative transfer code MCFOST (see, e.g., Pinte et al. 2006, 2009).
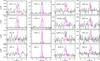 |
Fig. 1 Spectral lines detected toward AB Aur with the IRAM 30-m telescope. The transitions CO 2→1, HCO+ 1→0, SO 34 → 23, CN 1→0, and CS 3→2 were taken from Fuente et al. (2010), where cloud velocities were blanked. The HCN 3→2 is an averaged spectrum from previous observations by Fuente et al. (2010) and ASAI data. Magenta line shows the narrow C18O 1→0 line profile that traces the emission from the foreground cloud, and for visualization purposes the C18O 1→0 line (Tpeak ∼ 0.7 K) is scaled to fit in each panel. |
2. Observations
2.1. IRAM 30-m radiotelescope
We carried out a spectral survey toward AB Aur (αJ2000 =
04h 55 m
45.8 s,
 ) as part of the IRAM Large program
ASAI using the IRAM 30-m telescope at Pico Veleta (Granada, Spain). Several observing
periods were scheduled on July and February 2013 and January and Mars 2014, to cover the
1, 2, and 3 mm bands shown in Table 1. The Eight
MIxer Receivers (EMIR) and the fast Fourier Transform Spectrometers (FTS) with a spectral
resolution of 200 kHz were used for the whole project. The observing procedure was wobbler
switching with a throw of 200″
to ensure flat baselines and to avoid possible contamination from the envelope toward this
young disk. In Table 1 we show the beam efficiency, half power beam width (HPBW), spectral
resolution, and sensitivity achieved in each observed frequency band.
) as part of the IRAM Large program
ASAI using the IRAM 30-m telescope at Pico Veleta (Granada, Spain). Several observing
periods were scheduled on July and February 2013 and January and Mars 2014, to cover the
1, 2, and 3 mm bands shown in Table 1. The Eight
MIxer Receivers (EMIR) and the fast Fourier Transform Spectrometers (FTS) with a spectral
resolution of 200 kHz were used for the whole project. The observing procedure was wobbler
switching with a throw of 200″
to ensure flat baselines and to avoid possible contamination from the envelope toward this
young disk. In Table 1 we show the beam efficiency, half power beam width (HPBW), spectral
resolution, and sensitivity achieved in each observed frequency band.
The data reduction and the line identification were carried out with the package CLASS of GILDAS software (Maret et al. 2011). Three databases were used to identify the lines: (1) Cologne Database for Molecular Spectroscopy (CDMS; see Müller et al. 2005); (2) the molecular spectroscopy database of Jet Propulsion Laboratory (JPL; see Pickett et al. 1998); and (3) MADEX (Cernicharo 2012).
Observed band ranges with IRAM 30-m telescope.
2.2. Plateau de Bure interferometer
The interferometric observations were carried out in the second half of 2011 using the C and D configurations of the PdBI with six antennas. This configuration provided a beam of ≈5.41″× 4.31″ with a position angle (PA) of 129◦ at the frequency of HCO+ 1→0 (89.1885 GHz) and of ≈5.41″× 4.31″ with a PA of 139◦ at the frequency of C17O 1→0 (112.3593 GHz). During the observations, one 20 MHz bandwidth correlator unit was placed at the frequency of the HCO+ 1→0 line, providing a spectral resolution of ∼39 kHz (=0.13 km s-1). The C17O line was observed with the WideX correlator, which provides a spectral resolution of ∼2 MHz (=5.4 km s-1). We used 3C 454.3, MWC349, 3C84, 0552+398, and 0415+379 as phase and flux calibrators.
Data reduction and image synthesis were carried out using the GILDAS software. The channels free of line emission were used to estimate the continuum flux that was subtracted from the spectral maps. To improve the signal-to-noise ratio (S/N), the HCO+ image was created with a velocity resolution of 0.4 km s-1. The root-mean square (rms) of the resulting cube was ∼6 mJy/beam. In the case of C17O, we kept the original spectral resolution and produced a cube with rms of ∼2 mJy/beam.
3. Results
3.1. IRAM 30-m
In Table 2, we show the list of molecular lines detected at a level >5σ. This high S/N is required for a secure detection and for having good line profiles for our analysis. For completeness, we also include those lines previously detected by Fuente et al. (2010).
The spectra are shown in Fig. 1. The lines of CO and 13CO show the narrow line feature (Δv ∼ 0.5 km s-1) typical of the lines coming from the foreground cloud (see discussion in Fuente et al. 2010). This suggests that their integrated line emission is dominated by the cloud emission. However, all the other lines show the double peak profile characteristic of rotating disks. In Sect. 3.3 we compare the flux of the HCO+ 1→0 line listed in Table 2 with the one obtained from our interferometric map and demonstrate that the HCO+ 1→0 emission is coming from the disk. For this reason, we adopt HCO+ as a pattern for the disk emission.
The AB Aur disk presents some peculiarities. In a first eye verification of the detected lines, we realized that HCN 3→2 line in AB Aur has an intensity comparable to the less common species like H2CO. Öberg et al. (2010, 2011) carried out a disk imaging survey with SMA toward twelve sources that cover a wide range of stellar luminosities among the TT and Herbig Ae stars. They show that HCN is strong in disks: HCN 3→2 and CN 2→1 are the strongest lines after HCO+ and CO, and are twice as intense than the H2CO at 1 mm.
Detections in AB Aur disk.
Besides this, SO has never been detected in a protoplanetary disk. It is, however, very abundant in the shocks produced by bipolar outflows, (see, e.g., Bachiller & Pérez Gutiérrez 1997). In AB Aur disk, we have detected two transitions of SO, 54→43, and 56→45 in the 1 mm band, and Fuente et al. (2010) detected the SO 34→23 at 2 mm. All the SO lines present double-peak line profiles consistent with the interpretation of the emission coming from the circumstellar disk of AB Aur (see Fig. 1).
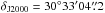
In Fig. 2 we present a comparison between the averaged spectra of H2CO and SO 1 mm lines with the line profile of HCO+ 3→2. We only averaged the lines observed in the 1 mm band with similar HPBW, which makes the comparison more reliable. The averaged spectra of both H2CO and SO match the double-peak shape in the same range of velocities as in the case of HCO+ line profile. Waiting for further confirmation with interferometric observations, we consider that the circumstellar disk is the most likely origin for the SO emission.
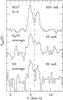 |
Fig. 2 Comparison of the averaged spectra of the SO and H2CO lines with the HCO+3→2 line profile. In the top of these panels we have the HCO+3→2 profile showing the double-peak shape that is characteristic of a rotating disk. In the middle we can see the averaged H2CO profile that keep the same double-peak feature in the same range of velocities. In the bottom the averaged SO profile is in complete agreement with the two other spectra. |
In Table 3, we show the 3σ upper limits to the column densities of some interesting species. The column densities were calculated with MADEX (Cernicharo 2012) assuming a line width of Δv ∼ 4 km s-1 and a source size of ∼14 arcsec (2000 AU at 145 pc). We adopted a molecular hydrogen density of 3.5 × 106 cm-3 for two representatives temperatures: 30 and 50 K. The first one is similar to the value derived from the 13CO observations at 200 AU by Piétu et al. (2005) and corresponds to the temperature in the midplane predicted by our model (see Sect. 5). The value of 50 K is the mass-averaged kinetic temperature derived from our model. We searched for the abundant species HNC, DCN, C2H, DCO+, N2H+, HC3N, and C3H2 that have been detected in other disks (Dutrey et al. 2014). However, we did not detect any of these species. They have weak lines whose emission could be below our sensitivity limit. The tentative detection of H2S by Fuente et al. (2010) was not confirmed. We also searched for HCS+, HCO, SiO, and CH3OH lines, which are abundant species in young protostars. They have not been detected coming from any disk or around AB Aur.
3.2. Plateau de Bure
The upper panels of Fig. 3 show the contours of the integrated-velocity intensity maps of HCO+ 1→0 (on the left) and C17O 1→0 (on the right). Both maps are integrated in the velocity range between [4, 8] km s-1. The emission coming from the disk traced by HCO+ 1→0 line is elongated and almost perpendicular to the emission traced by the collimated outflow recently reported by Rodríguez et al. (2014) (direction angle ∼70◦). Moreover, the rotation axis of HCO+ is consistent with that of the CO gas disk traced by Piétu et al. (2005) (∼50◦).
The bottom panels of Fig. 3 show the real part of the visibilities of the AB Aur
molecular emission as a function of the uv radius. Each black point is an azimuthal average
of the visibilities inside circular rings in steps of 5 m from 0 to 200 m. For the
uv
analysis, we tried to fit different models, but the data quality does not allow us to
distinguish between circular and ring disk models. Red points indicate the best fit to the
uv plot,
using a circular disk model. In the case of the uv plot of the C17O emission, we note that it is
well fitted by a circular disk model centered on αJ2000 =
04h 55 m
45.81 s,
 , with a flux density of
18 ± 3 mJy and
6 ± 0.8′′of diameter. However, for the
case of the HCO+,
the fit is not good at long baselines. Although there is much noise in the
HCO+ data, the
uv plot
suggests that there might be two components, a compact unresolved component, which is
responsible for the flattening of the uv visibility amplitude at large (>100 m) baselines, and
an extended component (resolved) with a decreasing trend of the uv visibility amplitudes
with radius at small uv radii. The flux density for this
HCO+ model was
62 ± 3 mJy, and it had the
same diameter of 5.8 ±
0.3′′. The fluctuations observed at large uv radii indicate that the
morphology of the source is complex, consistently with the complexity of the structures
revealed by previous observations of the region around AB Aur (e.g., Piétu et al. 2005; Schreyer et al.
2008; Rodríguez et al. 2014).
, with a flux density of
18 ± 3 mJy and
6 ± 0.8′′of diameter. However, for the
case of the HCO+,
the fit is not good at long baselines. Although there is much noise in the
HCO+ data, the
uv plot
suggests that there might be two components, a compact unresolved component, which is
responsible for the flattening of the uv visibility amplitude at large (>100 m) baselines, and
an extended component (resolved) with a decreasing trend of the uv visibility amplitudes
with radius at small uv radii. The flux density for this
HCO+ model was
62 ± 3 mJy, and it had the
same diameter of 5.8 ±
0.3′′. The fluctuations observed at large uv radii indicate that the
morphology of the source is complex, consistently with the complexity of the structures
revealed by previous observations of the region around AB Aur (e.g., Piétu et al. 2005; Schreyer et al.
2008; Rodríguez et al. 2014).
Non-detections in AB Aur disk.
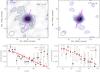 |
Fig. 3 Upper panels: HCO+ 1→0 (left) and C17O 1→0 (right) integrated velocity maps obtained with the PdBI from 4 to 8 km s-1. Blue contours levels are percentages of the maximum (0.15 Jy beam-1 for C17O and 0.22 Jy beam-1 for HCO+) from 10 to 90 in steps of 10. The position of the central source is marked by a yellow star. The magenta arrow indicates the direction of the jet (∼70◦) reported by Rodríguez et al. (2014). The red contour represents the half maximum power contour. The ellipse in the left bottom corner indicates the synthesized beam sizes: 5.41″× 4.31″ with a position angle (PA) of 39◦ for HCO+ 1→0 and 4.58″× 3.98″ with a PA of 49◦ for the C17O. Lower panels: corresponding uv plots to the upper maps. The uv plot shows the real part of visibilities as a function of the uv distance, binned in circular rings in steps of 5 m. |
3.3. Comparison between IRAM 30-m and plateau de Bure
In Fig. 4 we show the HCO+ 1→0 and C17O 1→0 lines. The availability of PdB maps allows a comparison between interferometric and single-dish data. To make this comparison, the interferometric maps have been convolved to the single-dish beam size of the corresponding transition. For the C17O 1→0 line, the temperature measured with the PdB is about four times less intense than obtained with the IRAM-30 m telescope in the 2→1 line, which is consistent with optically thin emission. For the HCO+ 1→0 line, all the flux measured with the IRAM 30-m is recovered by the PdBI, proving that the detected emission comes from the circumstellar disk.
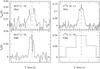 |
Fig. 4 Comparison between single-dish IRAM 30-m spectra (upper panels) and Plateau de Bure interferometric spectra (lower panels). To compare properly both sets of spectra, PdB spectra have been convolved to the single-dish beam size of the corresponding transition. For the HCO+ 1→0, the HPBW of the convolving Gaussian is 27.0″× 27.2″ and for the C17O 1→0, 9.4″× 9.2″ (to obtain the same angular resolution of the 30-m C17O 2→1 line). The conversion factor between Jy and K is 7 K = 1 mJy/beam for HCO+ 1→0 and 5 K = 1 mJy/beam for C17O 1→0. |
Looking at the HCO+ 1→0 spectra of Fig. 4, we note that the line profile is doubled peaked, which is characteristic of emission from a rotating disk. However, the line profile seen by the interferometer seems to peak at a slightly blue-shifted velocity with respect to the IRAM 30-m spectrum. We believe that this is due to the poor S/N in the PdBI spectrum, which means that the peak velocity and the other line parameters are affected by large uncertainties.
Disk list of the sample of Öberg et al. 2010, 2011, and AB Aur with their corresponding integrated line intensity ratios of the transitions; CN 2→1/HCN 3→2, HCN 3→2/HCO+ 3→2, and H2CO 303 → 202/HCO+ 3→2.
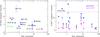 |
Fig. 5 Integrated line intensity ratios and upper and lower limits for CN 2→1/HCN 3→2 (left) and HCN 3→2/HCO+ 3→2 and H2CO 303 → 202/HCO+ 3→2 (right) transitions, as a function of the stellar luminosity. Horizontal dashed lines indicated the corresponding values for the Orion Bar (Goicoechea, priv. comm.). The letters correspond to each of the sources. (A) DM Tau; (B) V4046 Sgr; (C) AA Tau; (D) GM Aur; (E) LkCa 15; (F) IM Lup; (G) AS 209; (I) SAO 206462; (J) CQ Tau; (K) MWC 480; (L) AB Aur; (M) HD 142527. |
4. Comparison with other sources
For a complete picture of the chemistry in the AB Aur transition disk, we compared it with the sample of 12 disks observed by Öberg et al. (2010, 2011). Such disks were entirely observed with the SMA telescope, ensuring the uniformity of observational conditions in the sample. Moreover, the lines detected toward AB Aur are among the lines detected by Öberg et al. (2010, 2011) at 1 mm in the other sources, which facilitated the comparison. The sample covers a wide range of stellar luminosities among the TT and Herbig Ae stars. It consists of six disks in Taurus and six in the southern sky. Among these disks, we have several (pre-) transition disks with internal gaps: DM Tau, LkCa 15, GM Aur, V4046 Sgr, HD 142527, and SAO 206462. Table 4 lists the disk types, pT or T for pre- or transition disk respectively, and F for full disks. The CN 2→1/HCN 3→2, HCN 3→2/HCO+3→2, and the H2CO 303→202/HCO+ 3→2 integrated intensity line ratios are listed in the other columns. Carrying out a comparison between several sources is not direct, since there are many uncertainties because the position angles and inclinations affect which parts of the disk are observed, hence our picture of the chemistry. Disk masses are poorly constrained, since they are derived from dust emission, assuming the canonical interstellar dust/gas ratio value of 1/100. The actual dust/gas ratio may be variable among the sources and also be affected by coagulation and photoevaporation. The difference in disk masses may affect the relative abundances of different species.
Among the molecular species detected in AB Aur, we have HCN and CN. They are particularly interesting because they trace different physical conditions in the photodissociation regions (PDRs) and because their abundances are closely related HCN may be easily photodissociated by UV radiation from the star to yield CN (Fuente et al. 1993; Bachiller & Pérez Gutiérrez 1997; Böger & Sternberg 2005).
Both molecules, CN and HCN, share the same chemistry and are expected to come from the same region, although the CN/HCN ratio can vary (see Fig. A.1). Furthermore, the CN 2–1 and HCN 3–2 lines have similar critical densities and therefore trace regions with similar physical conditions. Assuming optically thin emission, their integrated line intensities are proportional to the number of molecules of each species. With all these assumptions, the CN 2–1/HCN 3–2 line ratio is a good tracer of the CN/HCN abundance ratio.
In Fig. 5 we show the integrated intensity line ratios and upper and lower limits for CN 2→1/HCN 3→2, HCN 3→2/ HCO+3→2, and H2CO 303→202/HCO+ 3→2 ratios. The CN/HCN ratios vary by factor 4 between the DM Tau and AB Aur. AA Tau is the only significant outlier in terms of CN/HCN flux ratio, which has a value of 2.9. The averaged value of the CN/HCN ratio in the sample is ∼1.1. This value is similar to the one measured in the Orion Bar PDR ∼0.85 (Goicoechea, priv. comm.) (see Fig. 5). CN and HCN are more abundant in the illuminated disk surface (see Fig. A.1). Chemical models show that the CN/HCN ratio is a good tracer of the incident UV field (Fuente et al. 1993; Böger & Sternberg 2005), taking values of about 1 in dark clouds and increasing to >3 in PDRs. The similarity between the CN 2–1/HCN 3–2 line ratio in AB Aur and Orion is consistent with the interpretation of CN and HCN emission coming from the PDR formed in the inner part of the disk and the illuminated disk surface.
We found a weak trend between CN 2→1/HCN 3→2 ratio and the morphology of the disk. Transition disks with high luminosities have the lowest values for CN/HCN ratios. AB Aur is located with the other transition disks, SAO 206462 and HD 142527, in the bottom right hand part of the plot (see Fig. 5).
The average CN/HCN abundance ratio is expected to depend on the total area of the illuminated disk surface and the intensity of the UV field. Assuming the same morphology for all the disks, one would expect that the CN/HCN ratio increases with the stellar luminosity. However, we find the contrary trend. We interpret that this trend might be due to the different disk morphologies. In the transition disks with large inner gaps, the emission is dominated by the outer ring, i.e., the region farthest from the central star, where the FUV flux is weaker. This effect would be increased if the disks were flatter, because the illuminated surface would be drastically reduced.
In Fig. 5 we also plot the HCN 3→2/HCO+3→2 and the H2CO 303→202/HCO+ 3→2 ratio. The averaged value of HCN/HCO+ ratio in the sample is 0.43 and for H2CO 303→202/ HCO+ 3→2 is 0.1. We did not find any trend for each of these ratios with the stellar luminosity or the disk morphology. However, we found a relation between them both. Clearly, the HCN 3→2/ HCO+3→2 ratio is higher than H2CO 303→202/HCO+ 3→2 ratio in all the cases. This is also true for the Orion Bar: their corresponding values are 0.74 for the HCN/HCO+ and 0.11 for H2CO/HCO+ (Goicoechea, priv. comm.).
5. Modelization
5.1. Physical model
For deeper insight into the chemistry of this Ae disk, we carried out several modeling tasks. Our model assumes a flared disk with the density profile in the vertical axis determined by the assumption of hydrostatic equilibrium. The density and temperature distributions are shown in Fig. A.2 The temperature and visual extinction are computed using the RADMC code (Dullemond & Dominik 2004), which solves the continuum radiative transfer throughout the disk. We use a dust model with the MRN grain size distribution (Mathis et al. 1977) made of 100% silicates. Gas kinetic temperature is higher than dust temperature in the very external layers on the disk surface, where the photoelectric effect is the main heating mechanism. However, the millimeter lines studied in this paper come from a denser and cooler region where gas and dust are expected to be thermally coupled. In our model we assumed that the gas and dust temperature are equal.
Flared disks are expected around young stars (Meeus et al. 2001). The input parameters are the disk mass (Mdisk), the inner and outer radii (Rinand Rout) and the radial index, α, of the surface density profile (Σ(R) ∝ R− α).
As an initial trial, we considered models A, B, C, and D with the parameters shown in Table 5. We adopted the disk mass of 0.02 M⊙ derived by Piétu et al. (2005) from continuum 1 mm PdB observations and allowed it to change by a factor of 2, so within its uncertainty. The values of Rinand Routare varied between the values found from 12CO and those obtained from the rare CO isotopologues and HCO+ (Piétu et al. 2005; Schreyer et al. 2008, this paper). The value of α was taken 2.15, in agreement with previous measurements by Piétu et al. (2005) and Schreyer et al. (2008).
Input parameters used for modeling the AB Aur disk.
The parameters adopted in models A, B, C, and D are based on fitting interferometric observations with a simple disk model. More recent high spatial resolution observations of CO and 13CO showed that the AB Aur disk has a complex structure, with a rotating ring that extends to 4″ (560 AU) and a spiral arm extending up to 7″ (≈1000 AU) (Tang et al. 2012; Pantin et al. 2005). Moreover, according to observations by Hashimoto et al. (2011), there are two dusty rings: one inmate compact ring (R ≈ 40 AU) with an inclination angle of approximately 40◦ relative to the plane of the sky and the outer ring with R ≈ 100 AU and an inclination angle of 27◦. Honda et al. (2010) derived a value of α close to 1 for the outer ring. Our model is too simple to account for this complex structure, but we added model E (see Table 5) to account for the lower radial spectral index measured by Honda et al. (2010).
In all the models, the stellar parameters were kept fixed to T∗ = 10 000 K, R∗ = 2.5 R⊙, M∗ = 2.4 M⊙ (Schreyer et al. 2008). and the gas-to-dust mass ratio to 100.
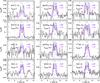 |
Fig. 6 Comparison between modeled spectra and those detected by 30-m telescope toward AB Aur disk. In colors, we have the lines profiles that correspond to the synthetic line fluxes performed by MCFOST code. The blue and magenta lines correspond to the same model with inclination angles for the disk of 27◦ and 40◦, respectively. The vertical dash line indicates the ambient cloud velocity, Vlsr = 5.9 km s-1 (Duvert et al. 1986). All the observational spectra show the double-peak shape that is characteristic of a rotating disk. All modeled lines agree with the observations within a factor of 2. HCN 3→2 and CN 2→1 present the largest differences between the predicted intensities and the observations, 30 and 17 times larger than observations, respectively. |
5.2. Chemical model
We used a simple time-dependent chemical model in which the representative chemical abundances evolve under fixed physical conditions (updated version of Agúndez et al. 2008; and Fuente et al. 2010). The chemical model includes the elements H, C, N, O, and S. As initial abundances we adopt the so-called “low metal” values (Wiebe et al. 2003), with all carbon in the form of CO, the remaining oxygen in the form of water ice, nitrogen as N2, sulfur as CS, and a ionization fraction of 1 × 10⁻⁸ (typical of dark clouds, see, e.g., Caselli et al. 1998; Agúndez & Wakelam 2013). The gas phase chemical network is an extension of the one used by Agúndez et al. (2008). We also consider adsorption onto dust grains and desorption processes, such as thermal evaporation, photodesorption, and desorption induced by cosmic rays (see, e.g., Hasegawa & Herbst 1993). The photodissociation rates of H2 and CO are computed including self-shielding effects. For the stellar FUV field we adopt the approach described in Agúndez et al. (2008), while in the case of the interstellar FUV field, we use the shielding coefficients calculated by Lee et al. (1996). The adopted H2 formation rate on the grain surface is 3 × 10-17 cm3 s-1.
Using the chemical composition computed by our model, we performed the 3D radiative transfer code MCFOST (Pinte et al. 2006, 2009) to compute the synthetic molecular emission maps. MCFOST uses the chemical abundances and kinetic temperature to compute the level populations using a Monte Carlo method. We followed an algorithm similar to the one published by Hogerheijde (2010), separating the contribution of the local and external radiation fields in each cell. The synthetic emission maps and spectra are then produced by a ray-tracing algorithm that formally integrate the source function computed by the Monte Carlo method. We iterated this procedure several times over a range of position angles from 0◦ to 40◦, relative to the plane of the sky. Finally, we convolved the resulting map with the beam of Pico de Veleta to compare with observations. The results are shown in Fig. 6 and in Figs. A.3 and A.4.
5.3. Comparison between model and observations
Our models from A to E are reasonable approximations of the AB Aur disk (see Figs. 6, A.3 and A.4). Model A corresponds to a disk with mass of 0.02 M⊙ and a large outer radius of 1100 AU. This model overestimates the observed intensities and the line widths for all transitions. In model B we used the same parameters as in model A, but we changed the outer radius to 550 AU and the disk mass to 0.01 M⊙. By decreasing and redistributing the mass in a smaller radius, we observed a decrease in the line intensities, but there is no change in the width of the profiles. In model C we increased the size of internal radius, the synthesized spectra fit the width of the lines best, and the line profiles are more similar to those of the observed spectra. Still, under the assumption of a mass of 0.01 M⊙ and when testing the same other parameters as in model A, we noted the effect of decreasing the mass in the disk in model D. The lines are still wider than observed, although the intensities are adjusted relatively well within a factor of 2 for most of the transitions.
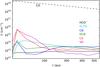 |
Fig. 7 Vertical column densities of several molecules as a function of radius at 2.5 Myr as calculated for the chemical model E. |
Finally, model E is like the previous Model C, but it changes the exponent of the radial surface density law from 2.15 to 1.5. The best results were obtained for this model, which corresponds to the values Mdisk = 0.01M⊙, Rin = 110 AU, Rout = 550 AU, and a surface density radial index α = 1.5 with an inclination angle of i = 27°. Almost all modeled lines agree with the observations within a factor of 2, and the modeled profiles successfully reproduce the double peak profiles from the disk emission. The exceptions are the HCN 3→2 that is predicted with an intensity around 30 times higher than the observed ones and the CN 2→1 with a predicted intensity that is 17 times higher. This large difference was highlighted in the eye inspection during the data analysis. We noted that HCN 3→2 and CN 2→1 were especially weak. This peculiarity in the emission is also observed as a common trend in transition disks.
We call that our chemical model does not consider surface reactions that could affect the HCN and CN chemistry. However, our model gives vertical HCN column densities of ∼1014 cm-2, in agreement with other more complex models that include surface chemistry (see, e.g., Walsh et al. 2010). Therefore, we think that the discrepancies between observations and our predictions are more likely due to the assumed morphology of the AB Aur disk.
In Fig. 7 we show the HCN and CN vertical column densities as a function of the disk radius. Both species have peaks close to the inner radius of 110 AU. Subsequently, they decrease to a minimum value around 200 AU and increase again for larger radii because of the PDR formed on the surface of the flared disk. In the case of a flat disk, the HCN and CN column densities would be lower for large radii and in better agreement with our observations. This could also be the cause of the low HCN and CN intensities in other transition disks.
In our model the SO synthesized lines agree with the observations by a factor of 2. SO emission has been detected associated to disks of young low-mass Class I protostars (Yen et al. 2014). The youth of the AB Aur disk could be key for a higher SO abundance. Moreover, the AB Aur disk is warmer than those associated with low-mass stars and, unlike to these disks, which present a standard abundance of CO without signs of heavy depletion (Piétu et al. 2005; Schreyer et al. 2008).
Initial abundances in models M0, M1, and M2.
In general, there is a discrepancy of almost a constant factor of 2 between our model predictions and observed line intensities. This factor may be due to a different gas/dust ratio from the standard value, and it could even vary within the disk. This could produce a decrease in the intensity of the lines coming from the gas-deficient region. It is definitely not the unique explanation, but taking the large uncertainties of our simple model into account, we think it is not worthwhile discussing this disagreement further. We call that the gas/dust ratio is one of the least known parameters in all the disk models.
The shortcoming of time-dependent models is that the predictions depend on the initial conditions. In the following section, we discuss the impact of such initial conditions on our results.
5.4. Dependence on initial conditions
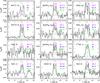 |
Fig. 8 Detected spectra toward AB Aur overlaid with the synthesized transition lines obtained with the radiative transfer code MCFOST for models M0, M1, and M2 for an angle of 27◦ for the physical parameters of model E. |
To analyze the impact of the initial condition on our model, we used a trial of initial abundances: M0 (the actual model used up to now in this work), M1 and M2. The values for each set of abundances are shown in Table 6. Model M0 corresponds to a standard solar elemental composition corrected with a depletion around 100 for Na, Si, Mg, and Fe (see Wiebe et al. 2003; Semenov et al. 2004). In this model, all the N is in the form of N2, the C in CO, the O in water ice, and all the S in CS. (We chose this option as the limit case to verify the model’s ability to form SO.) M1 and M2 initial abundances values correspond to the values of a dark cloud (nH = 2× 104 cm-3, T(K) = 10 K) at a time of 105 and 106 years, respectively.
Figure 8 shows the comparison between the observed spectra and the profiles synthesized with the radiative transfer code MCFOST for models M0, M1, and M2 and for an angle of 27◦. Models M1 and M2 show practically the same line profiles for all transitions. As an outstanding result, the CS and SO predicted line profiles do not vary with the initial conditions, supporting the robustness of our results.
In the case of CN and HCN, the predicted intensities are lower than in M0, but remain more intense than the observations. Thus, varying the initial conditions does not improve our results. This discrepancy between models and observations may be due to a different physical structure (see Sect. 5.3) or to the uncertainties in the nitrogen chemistry. For instance, the values of elemental abundances, the ortho-to-para H2 ratio, the binding energies, and time-dependent effects could affect our results (see, e.g., Le Gal et al. 2014; Schwarz & Bergin 2014). However, a detailed study of these effects is beyond the scope of this work.
Models M1 and M2 fail to predict the abundances of formaldehyde by a factor of 10, because the formaldehyde emission mainly comes from the midplane where the chemistry processes are slow and the molecular abundances are far from the equilibrium. In models M1 and M2, there is, first, a period of very early formation of molecules, followed by a time of destruction of the chemical complexity (between a few 105 and 107 yr), and then the formaldehyde abundance increases again to reach the equilibrium value at 108 yr. The steady-state abundance is more like the result of our M0 model.
Among the studied molecules, only the abundance of H2CO strongly depends on the assumed initial conditions.
6. Summary and conclusions
We present in this paper the molecular survey toward the prototypical disk around AB Aur. Our results and conclusions can be summarized as follow.
-
1.
We detected the 1→0 and 2→1 rotational transitions of 12CO and its isotopologues: 13CO, C17O, and C18O. We also detected the lines HCO+ 1→0 and 2→1, H2CO 303→202, 313→212, and 312→211, SO 54→43, 56→45, CS 3→2, HCN 1→0, 3→2, and CN 1→0 and 2→1. Based on the line profiles and on the agreement between the velocity ranges, we interpreted that the emission from all these lines comes from the disk. We therefore confirmed the previous detection of SO in AB Aur by Fuente et al. (2010).
-
2.
Some species were not detected in our survey, even if they were observed in other disks, such as HNC, DCN, C2H, DCO+, N2H+, HC3N, and C3H2. In general, these species have weaker lines whose emission could be below our sensitivity limit.
-
3.
Carrying out a comparison with other 12 disks (Öberg et al. 2010, 2011) that cover a broad luminosity range and disk evolutionary stages, we found that AB Aur presents the typical chemical signature of a transition disk. Transition disks have lower CN 2→1/HCN 3→2 ratios than full disks. Moreover, the HCN 3→2/HCO+ 3→2 and H2CO 3→2/HCO+ 3→2 ratios are similar.
We modeled the line profiles using the chemical code by Agúndez et al. (2008) and the 3D radiative transfer code MCFOST (Pinte et al. 2006, 2009). Our model assumes a flared disk in hydrostatic equilibrium with a radial surface density distribution described by α (Σ(R) ∝ R− α). The best results were obtained for a physical structure: Mdisk = 0.01M⊙, Rin = 110 AU, Rout = 550 AU, a surface density coefficient (α = 1.5), and the initial abundances M0. Almost all modeled lines, in particular SO and CS, agree with the observations within a factor of 2, and the modeled profiles successfully reproduce the double-peak profiles from the disk emission. The only exception is the HCN 3→2 that is predicted with an intensity around 30 times higher and the CN 2→1 with a predicted intensity of 17 times higher than the observed ones, respectively.
We carried out a set of modeling tasks with different initial abundances to study the influence of the initial conditions on our results. We took the limiting cases in which all the S is in CS (model M0) and all the S is in SO (model M2). We found that the initial conditions do not affect our result, supporting its robustness. The CN and HCN synthetic spectra always remain more intense than the observations, thus varying the initial conditions do not significantly improve our results. Only the H2CO abundance strongly depends on the initial conditions.
Our model cannot account for the full complexity of this transition disk and must be considered as a guide to interpreting the observations. For instance, clumpyness in the disk ring would allow UV-photons to penetrate deeper into the disk and photodissociate some molecules. A flatter disk morphology would lead to different chemical abundances. Recent observations in centimeter radio emission, carried out by Rodríguez et al. (2014), have shown that there is a collimated and ionized outflow in the inner regions of AB Aur disk. Possible shocks associated with this compact ionized outflow could modify the gas chemistry in the interaction regions. Recent ALMA observations toward another transition disk HD 142527 have traced HCO+ emission inside the cavity, and it has been interpreted as accretion flows onto the star (Casassus et al. 2013). Finally, dust properties and the gas/dust ratio in transition disks could be different from the standard values (see, e.g., van der Marel et al. 2014). Future interferometric observations would help to determine where the emission of different molecules are coming from and distinguish among all these scenarios.
Online material
Appendix A: Figures
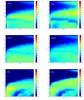 |
Fig. A.1 Molecule distribution of HCN, CN, H2CO, HCO+, SO, and CS as a function of radius r and z/r (where z is the height over the midplane) for model E. |
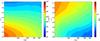 |
Fig. A.2 Distribution of H nuclei volume density (left) and temperature (right) as a function of radius r and z/r (where z is the height over the midplane) in model E. |
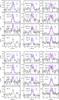 |
Fig. A.3 Top: model A, bottom: model B. Comparison between modeled spectra and those detected by 30 m telescope toward AB Aur disk. In colors we see the synthetic line profile obtain with our model. The blue and magenta lines correspond to the same model with inclination angles for the disk of 27◦ and 40◦ respectively. Vertical dash line indicate the Vlsr = 5.9 km s-1 (Duvert et al. 1986). |
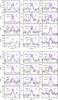 |
Fig. A.4 Top: model C; bottom: model D. |
Acknowledgments
We acknowledge the financial support of CONACyT, México, and Spanish MINECO for funding support under grants CSD2009-00038 and AYA2012-32032.
References
- Agúndez, M., &Wakelam, V. 2013, Chem. Rev., 113, 8710 [CrossRef] [PubMed] [Google Scholar]
- Agúndez, M.,Cernicharo, J., &Goicoechea, J. R. 2008, A&A, 483, 831 [NASA ADS] [CrossRef] [EDP Sciences] [Google Scholar]
- Andrews, S. M.,Wilner, D. J.,Hughes, A. M.,Qi, C., &Dullemond, C. P. 2009, ApJ, 700, 1502 [NASA ADS] [CrossRef] [Google Scholar]
- Bachiller, R., & Pérez Gutiérrez, M. 1997, ApJ, 487, L93 [NASA ADS] [CrossRef] [Google Scholar]
- Böger, G. I., &Sternberg, A. 2005, ApJ, 632, 302 [NASA ADS] [CrossRef] [Google Scholar]
- Casassus, S., van der Plas, G., Sebastian Perez, M., et al. 2013, Nature, 493, 191 [NASA ADS] [CrossRef] [Google Scholar]
- Caselli, P.,Walmsley, C. M.,Terzieva, R., &Herbst, E. 1998, ApJ, 499, 234 [Google Scholar]
- Cernicharo, J. 2012, in EAS Publ. Ser. 58, eds. C. Stehlé, C. Joblin, & L. d’Hendecourt, 251 [Google Scholar]
- DeWarf, L. E.,Sepinsky, J. F.,Guinan, E. F.,Ribas, I., &Nadalin, I. 2003, ApJ, 590, 357 [NASA ADS] [CrossRef] [EDP Sciences] [Google Scholar]
- Dullemond, C. P., &Dominik, C. 2004, A&A, 417, 159 [NASA ADS] [CrossRef] [EDP Sciences] [Google Scholar]
- Dutrey, A.,Henning, T.,Guilloteau, S., et al. 2007, A&A, 464, 615 [NASA ADS] [CrossRef] [EDP Sciences] [Google Scholar]
- Dutrey, A., Semenov, D., Chapillon, E., et al. 2014, Protostars and Planets VI, eds. H. Beuther, R. S. Klessen, C. P. Dullemond, & T. Henning (Tucson: University of Arizona Press), 317 [Google Scholar]
- Duvert, G.,Cernicharo, J., &Baudry, A. 1986, A&A, 164, 349 [NASA ADS] [Google Scholar]
- Espaillat, C., D’Alessio, P.,Hernández, J., et al. 2010, ApJ, 717, 441 [NASA ADS] [CrossRef] [Google Scholar]
- Fuente, A.,Martin-Pintado, J.,Cernicharo, J., &Bachiller, R. 1993, A&A, 276, 473 [NASA ADS] [Google Scholar]
- Fuente, A.,Cernicharo, J.,Agúndez, M., et al. 2010, A&A, 524, A19 [NASA ADS] [CrossRef] [EDP Sciences] [Google Scholar]
- García-López, R.,Natta, A.,Testi, L., &Habart, E. 2006, A&A, 459, 837 [NASA ADS] [CrossRef] [EDP Sciences] [Google Scholar]
- Guilloteau, S.,Piétu, V.,Dutrey, A., &Guélin, M. 2006, A&A, 448, L5 [NASA ADS] [CrossRef] [EDP Sciences] [Google Scholar]
- Guilloteau, S., Di Folco, E.,Dutrey, A., et al. 2013, A&A, 549, A92 [NASA ADS] [CrossRef] [EDP Sciences] [Google Scholar]
- Hasegawa, T. I., &Herbst, E. 1993, MNRAS, 261, 83 [NASA ADS] [CrossRef] [Google Scholar]
- Hashimoto, J.,Tamura, M.,Muto, T., et al. 2011, ApJ, 729, L17 [NASA ADS] [CrossRef] [Google Scholar]
- Herbig, G. H., & Bell, K. R. 1988, Third Catalog of Emission-Line Stars of the Orion Population, 3 [Google Scholar]
- Hernández, J.,Calvet, N.,Briceño, C.,Hartmann, L., &Berlind, P. 2004, AJ, 127, 1682 [NASA ADS] [CrossRef] [Google Scholar]
- Hogerheijde, M. R. 2010, in EAS Publ. Ser. 41, eds. T. Montmerle, D. Ehrenreich, & A.-M. Lagrange, 113 [Google Scholar]
- Honda, M.,Inoue, A. K.,Okamoto, Y. K., et al. 2010, ApJ, 718, L199 [NASA ADS] [CrossRef] [Google Scholar]
- Howard, C. D.,Sandell, G.,Vacca, W. D., et al. 2013, ApJ, 776, 21 [NASA ADS] [CrossRef] [Google Scholar]
- Hughes, J.,Hartigan, P.,Krautter, J., &Kelemen, J. 1994, AJ, 108, 1071 [NASA ADS] [CrossRef] [Google Scholar]
- Kastner, J. H.,Zuckerman, B.,Weintraub, D. A., &Forveille, T. 1997, Science, 277, 67 [NASA ADS] [CrossRef] [PubMed] [Google Scholar]
- LeGal, R.,Hily-Blant, P.,Faure, A., et al. 2014, A&A, 562, A83 [NASA ADS] [CrossRef] [EDP Sciences] [Google Scholar]
- Lee, H.-H., Herbst, E., Pineau des Forets, G., Roueff, E., & Le Bourlot, J. 1996, A&A, 311, 690 [NASA ADS] [Google Scholar]
- Mannings, V., &Sargent, A. I. 1997, ApJ, 490, 792 [NASA ADS] [CrossRef] [Google Scholar]
- Maret, S.,Hily-Blant, P.,Pety, J.,Bardeau, S., &Reynier, E. 2011, A&A, 526, A47 [NASA ADS] [CrossRef] [EDP Sciences] [Google Scholar]
- Mathis, J. S.,Rumpl, W., &Nordsieck, K. H. 1977, ApJ, 217, 425 [NASA ADS] [CrossRef] [Google Scholar]
- Meeus, G.,Waters, L. B. F. M.,Bouwman, J., et al. 2001, A&A, 365, 476 [NASA ADS] [CrossRef] [EDP Sciences] [Google Scholar]
- Müller, H. S. P.,Schlöder, F.,Stutzki, J., &Winnewisser, G. 2005, J. Mol. Struct., 742, 215 [NASA ADS] [CrossRef] [Google Scholar]
- Nomura, H.,Aikawa, Y.,Nakagawa, Y., &Millar, T. J. 2009, A&A, 495, 183 [NASA ADS] [CrossRef] [EDP Sciences] [Google Scholar]
- Öberg, K. I.,Qi, C.,Fogel, J. K. J., et al. 2010, ApJ, 720, 480 [NASA ADS] [CrossRef] [Google Scholar]
- Öberg, K. I.,Qi, C.,Fogel, J. K. J., et al. 2011, ApJ, 734, 98 [NASA ADS] [CrossRef] [Google Scholar]
- Pantin, E.,Bouwman, J., &Lagage, P. O. 2005, A&A, 437, 525 [NASA ADS] [CrossRef] [EDP Sciences] [Google Scholar]
- Pickett, H. M.,Poynter, R. L.,Cohen, E. A., et al. 1998, J. Quant. Spec. Radiat. Transf., 60, 883 [Google Scholar]
- Piétu, V.,Guilloteau, S., &Dutrey, A. 2005, A&A, 443, 945 [NASA ADS] [CrossRef] [EDP Sciences] [Google Scholar]
- Piétu, V.,Dutrey, A., &Guilloteau, S. 2007, A&A, 467, 163 [NASA ADS] [CrossRef] [EDP Sciences] [Google Scholar]
- Pinte, C.,Ménard, F.,Duchêne, G., &Bastien, P. 2006, A&A, 459, 797 [NASA ADS] [CrossRef] [EDP Sciences] [Google Scholar]
- Pinte, C.,Harries, T. J.,Min, M., et al. 2009, A&A, 498, 967 [NASA ADS] [CrossRef] [EDP Sciences] [Google Scholar]
- Pinte, C.,Ménard, F.,Duchěne, G., &Augereau, J. C. 2010, Highlights Astron., 15, 767 [NASA ADS] [Google Scholar]
- Prato, L.,Greene, T. P., &Simon, M. 2003, ApJ, 584, 853 [NASA ADS] [CrossRef] [Google Scholar]
- Qi, C.,Wilner, D. J.,Aikawa, Y.,Blake, G. A., &Hogerheijde, M. R. 2008, ApJ, 681, 1396 [NASA ADS] [CrossRef] [Google Scholar]
- Quast, G. R., Torres, C. A. O., de La Reza, R., da Silva, L., &Mayor, M. 2000, IAU Symp., 200, 28 [NASA ADS] [Google Scholar]
- Rodríguez, L. F.,Zapata, L. A.,Dzib, S. A., et al. 2014, ApJ, 793, L21 [NASA ADS] [CrossRef] [Google Scholar]
- Schreyer, K.,Guilloteau, S.,Semenov, D., et al. 2008, A&A, 491, 821 [NASA ADS] [CrossRef] [EDP Sciences] [Google Scholar]
- Schwarz, K. R., &Bergin, E. A. 2014, ApJ, 797, 113 [NASA ADS] [CrossRef] [Google Scholar]
- Semenov, D.,Wiebe, D., &Henning, T. 2004, A&A, 417, 93 [NASA ADS] [CrossRef] [EDP Sciences] [Google Scholar]
- Simon, M.,Dutrey, A., &Guilloteau, S. 2000, ApJ, 545, 1034 [NASA ADS] [CrossRef] [Google Scholar]
- Strom, K. M.,Strom, S. E.,Edwards, S.,Cabrit, S., &Skrutskie, M. F. 1989, AJ, 97, 1451 [NASA ADS] [CrossRef] [Google Scholar]
- Tang, Y.-W.,Guilloteau, S.,Piétu, V., et al. 2012, A&A, 547, A84 [NASA ADS] [CrossRef] [EDP Sciences] [Google Scholar]
- Thi, W.-F., van Zadelhoff, G.-J., & van Dishoeck, E. F. 2004, A&A, 425, 955 [NASA ADS] [CrossRef] [EDP Sciences] [Google Scholar]
- Thi, W. F.,Kamp, I.,Woitke, P., et al. 2013, A&A, 551, A49 [NASA ADS] [CrossRef] [EDP Sciences] [Google Scholar]
- van den Ancker, M. E., de Winter, D.,Tjin, A., &Djie, H. R. E. 1998, A&A, 330, 145 [NASA ADS] [Google Scholar]
- van der Marel, N., van Dishoeck, E. F.,Bruderer, S., & van Kempen, T. A. 2014, A&A, 563, A113 [NASA ADS] [CrossRef] [EDP Sciences] [Google Scholar]
- van Dishoeck, E. F.,Thi, W.-F., & van Zadelhoff, G.-J. 2003, A&A, 400, L1 [NASA ADS] [CrossRef] [EDP Sciences] [Google Scholar]
- Walsh, C.,Millar, T. J., &Nomura, H. 2010, ApJ, 722, 1607 [NASA ADS] [CrossRef] [Google Scholar]
- White, R. J., &Ghez, A. M. 2001, ApJ, 556, 265 [Google Scholar]
- Wiebe, D.,Semenov, D., &Henning, T. 2003, A&A, 399, 197 [NASA ADS] [CrossRef] [EDP Sciences] [Google Scholar]
- Yen, H.-W.,Takakuwa, S.,Ohashi, N., et al. 2014, ApJ, 793, 1 [NASA ADS] [CrossRef] [Google Scholar]
All Tables
Disk list of the sample of Öberg et al. 2010, 2011, and AB Aur with their corresponding integrated line intensity ratios of the transitions; CN 2→1/HCN 3→2, HCN 3→2/HCO+ 3→2, and H2CO 303 → 202/HCO+ 3→2.
All Figures
|
Fig. 1 Spectral lines detected toward AB Aur with the IRAM 30-m telescope. The transitions CO 2→1, HCO+ 1→0, SO 34 → 23, CN 1→0, and CS 3→2 were taken from Fuente et al. (2010), where cloud velocities were blanked. The HCN 3→2 is an averaged spectrum from previous observations by Fuente et al. (2010) and ASAI data. Magenta line shows the narrow C18O 1→0 line profile that traces the emission from the foreground cloud, and for visualization purposes the C18O 1→0 line (Tpeak ∼ 0.7 K) is scaled to fit in each panel. |
| In the text | |
|
Fig. 2 Comparison of the averaged spectra of the SO and H2CO lines with the HCO+3→2 line profile. In the top of these panels we have the HCO+3→2 profile showing the double-peak shape that is characteristic of a rotating disk. In the middle we can see the averaged H2CO profile that keep the same double-peak feature in the same range of velocities. In the bottom the averaged SO profile is in complete agreement with the two other spectra. |
| In the text | |
|
Fig. 3 Upper panels: HCO+ 1→0 (left) and C17O 1→0 (right) integrated velocity maps obtained with the PdBI from 4 to 8 km s-1. Blue contours levels are percentages of the maximum (0.15 Jy beam-1 for C17O and 0.22 Jy beam-1 for HCO+) from 10 to 90 in steps of 10. The position of the central source is marked by a yellow star. The magenta arrow indicates the direction of the jet (∼70◦) reported by Rodríguez et al. (2014). The red contour represents the half maximum power contour. The ellipse in the left bottom corner indicates the synthesized beam sizes: 5.41″× 4.31″ with a position angle (PA) of 39◦ for HCO+ 1→0 and 4.58″× 3.98″ with a PA of 49◦ for the C17O. Lower panels: corresponding uv plots to the upper maps. The uv plot shows the real part of visibilities as a function of the uv distance, binned in circular rings in steps of 5 m. |
| In the text | |
|
Fig. 4 Comparison between single-dish IRAM 30-m spectra (upper panels) and Plateau de Bure interferometric spectra (lower panels). To compare properly both sets of spectra, PdB spectra have been convolved to the single-dish beam size of the corresponding transition. For the HCO+ 1→0, the HPBW of the convolving Gaussian is 27.0″× 27.2″ and for the C17O 1→0, 9.4″× 9.2″ (to obtain the same angular resolution of the 30-m C17O 2→1 line). The conversion factor between Jy and K is 7 K = 1 mJy/beam for HCO+ 1→0 and 5 K = 1 mJy/beam for C17O 1→0. |
| In the text | |
|
Fig. 5 Integrated line intensity ratios and upper and lower limits for CN 2→1/HCN 3→2 (left) and HCN 3→2/HCO+ 3→2 and H2CO 303 → 202/HCO+ 3→2 (right) transitions, as a function of the stellar luminosity. Horizontal dashed lines indicated the corresponding values for the Orion Bar (Goicoechea, priv. comm.). The letters correspond to each of the sources. (A) DM Tau; (B) V4046 Sgr; (C) AA Tau; (D) GM Aur; (E) LkCa 15; (F) IM Lup; (G) AS 209; (I) SAO 206462; (J) CQ Tau; (K) MWC 480; (L) AB Aur; (M) HD 142527. |
| In the text | |
|
Fig. 6 Comparison between modeled spectra and those detected by 30-m telescope toward AB Aur disk. In colors, we have the lines profiles that correspond to the synthetic line fluxes performed by MCFOST code. The blue and magenta lines correspond to the same model with inclination angles for the disk of 27◦ and 40◦, respectively. The vertical dash line indicates the ambient cloud velocity, Vlsr = 5.9 km s-1 (Duvert et al. 1986). All the observational spectra show the double-peak shape that is characteristic of a rotating disk. All modeled lines agree with the observations within a factor of 2. HCN 3→2 and CN 2→1 present the largest differences between the predicted intensities and the observations, 30 and 17 times larger than observations, respectively. |
| In the text | |
|
Fig. 7 Vertical column densities of several molecules as a function of radius at 2.5 Myr as calculated for the chemical model E. |
| In the text | |
|
Fig. 8 Detected spectra toward AB Aur overlaid with the synthesized transition lines obtained with the radiative transfer code MCFOST for models M0, M1, and M2 for an angle of 27◦ for the physical parameters of model E. |
| In the text | |
|
Fig. A.1 Molecule distribution of HCN, CN, H2CO, HCO+, SO, and CS as a function of radius r and z/r (where z is the height over the midplane) for model E. |
| In the text | |
|
Fig. A.2 Distribution of H nuclei volume density (left) and temperature (right) as a function of radius r and z/r (where z is the height over the midplane) in model E. |
| In the text | |
|
Fig. A.3 Top: model A, bottom: model B. Comparison between modeled spectra and those detected by 30 m telescope toward AB Aur disk. In colors we see the synthetic line profile obtain with our model. The blue and magenta lines correspond to the same model with inclination angles for the disk of 27◦ and 40◦ respectively. Vertical dash line indicate the Vlsr = 5.9 km s-1 (Duvert et al. 1986). |
| In the text | |
|
Fig. A.4 Top: model C; bottom: model D. |
| In the text | |
Current usage metrics show cumulative count of Article Views (full-text article views including HTML views, PDF and ePub downloads, according to the available data) and Abstracts Views on Vision4Press platform.
Data correspond to usage on the plateform after 2015. The current usage metrics is available 48-96 hours after online publication and is updated daily on week days.
Initial download of the metrics may take a while.