Fig. 3
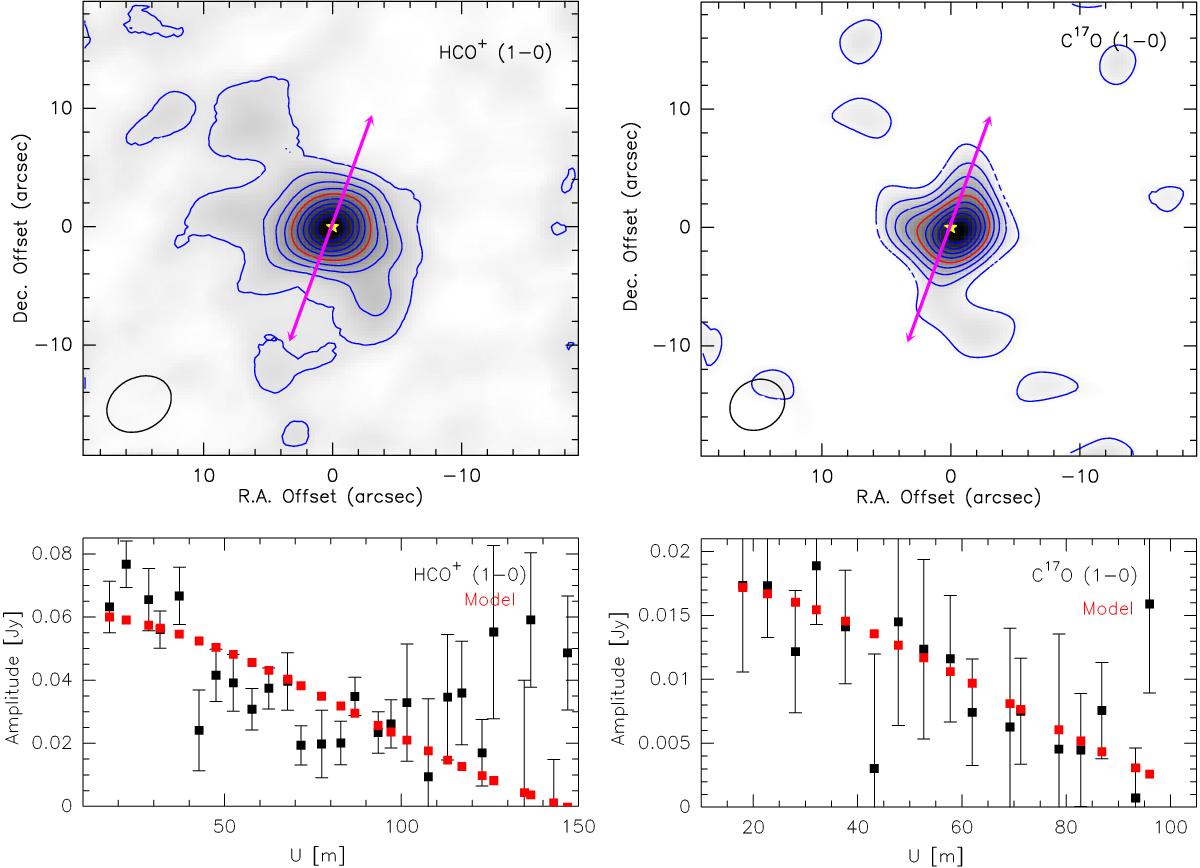
Upper panels: HCO+ 1→0 (left) and C17O 1→0 (right) integrated velocity maps obtained with the PdBI from 4 to 8 km s-1. Blue contours levels are percentages of the maximum (0.15 Jy beam-1 for C17O and 0.22 Jy beam-1 for HCO+) from 10 to 90 in steps of 10. The position of the central source is marked by a yellow star. The magenta arrow indicates the direction of the jet (∼70◦) reported by Rodríguez et al. (2014). The red contour represents the half maximum power contour. The ellipse in the left bottom corner indicates the synthesized beam sizes: 5.41″× 4.31″ with a position angle (PA) of 39◦ for HCO+ 1→0 and 4.58″× 3.98″ with a PA of 49◦ for the C17O. Lower panels: corresponding uv plots to the upper maps. The uv plot shows the real part of visibilities as a function of the uv distance, binned in circular rings in steps of 5 m.
Current usage metrics show cumulative count of Article Views (full-text article views including HTML views, PDF and ePub downloads, according to the available data) and Abstracts Views on Vision4Press platform.
Data correspond to usage on the plateform after 2015. The current usage metrics is available 48-96 hours after online publication and is updated daily on week days.
Initial download of the metrics may take a while.