Fig. 6
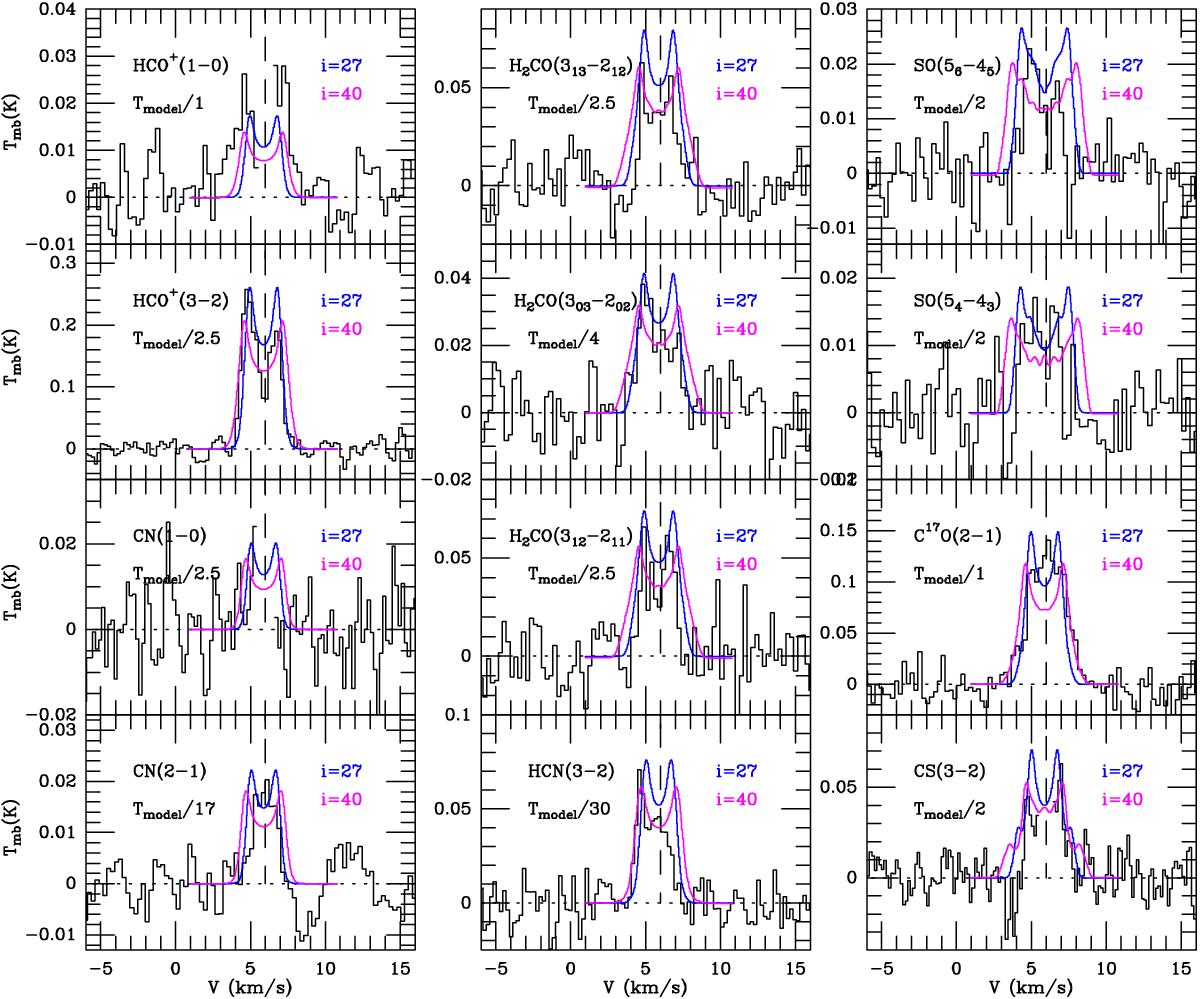
Comparison between modeled spectra and those detected by 30-m telescope toward AB Aur disk. In colors, we have the lines profiles that correspond to the synthetic line fluxes performed by MCFOST code. The blue and magenta lines correspond to the same model with inclination angles for the disk of 27◦ and 40◦, respectively. The vertical dash line indicates the ambient cloud velocity, Vlsr = 5.9 km s-1 (Duvert et al. 1986). All the observational spectra show the double-peak shape that is characteristic of a rotating disk. All modeled lines agree with the observations within a factor of 2. HCN 3→2 and CN 2→1 present the largest differences between the predicted intensities and the observations, 30 and 17 times larger than observations, respectively.
Current usage metrics show cumulative count of Article Views (full-text article views including HTML views, PDF and ePub downloads, according to the available data) and Abstracts Views on Vision4Press platform.
Data correspond to usage on the plateform after 2015. The current usage metrics is available 48-96 hours after online publication and is updated daily on week days.
Initial download of the metrics may take a while.