Fig. 4
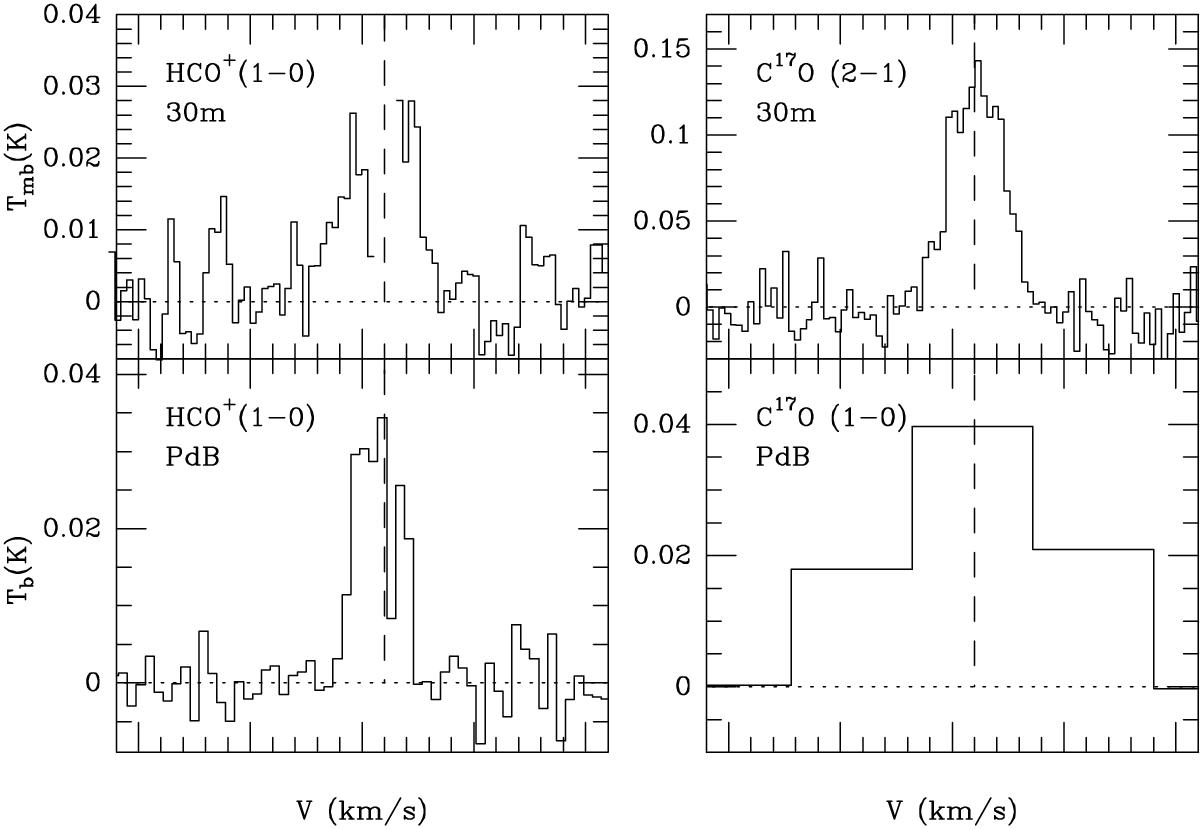
Comparison between single-dish IRAM 30-m spectra (upper panels) and Plateau de Bure interferometric spectra (lower panels). To compare properly both sets of spectra, PdB spectra have been convolved to the single-dish beam size of the corresponding transition. For the HCO+ 1→0, the HPBW of the convolving Gaussian is 27.0″× 27.2″ and for the C17O 1→0, 9.4″× 9.2″ (to obtain the same angular resolution of the 30-m C17O 2→1 line). The conversion factor between Jy and K is 7 K = 1 mJy/beam for HCO+ 1→0 and 5 K = 1 mJy/beam for C17O 1→0.
Current usage metrics show cumulative count of Article Views (full-text article views including HTML views, PDF and ePub downloads, according to the available data) and Abstracts Views on Vision4Press platform.
Data correspond to usage on the plateform after 2015. The current usage metrics is available 48-96 hours after online publication and is updated daily on week days.
Initial download of the metrics may take a while.