| Issue |
A&A
Volume 577, May 2015
|
|
|---|---|---|
| Article Number | A139 | |
| Number of page(s) | 10 | |
| Section | Galactic structure, stellar clusters and populations | |
| DOI | https://doi.org/10.1051/0004-6361/201525698 | |
| Published online | 19 May 2015 | |
The role of neutron star mergers in the chemical evolution of the Galactic halo
1
Leibniz-Institut für Astrophysik Potsdam (AIP),
An der Sternwarte 16,
14482
Potsdam,
Germany
e-mail:
This email address is being protected from spambots. You need JavaScript enabled to view it.
2
INAF, Osservatorio Astronomico di Bologna, via Ranzani 1,
40127
Bologna,
Italy
3
Dipartimento di Fisica, Sezione di Astronomia, Università di
Trieste, via G. B. Tiepolo
11, 34143
Trieste,
Italy
4
INAF, Osservatorio Astronomico di Trieste, via G. B. Tiepolo 11,
34143
Trieste,
Italy
5
INFN, Sezione di Trieste, via A. Valerio 2,
34127
Trieste,
Italy
6
Astrophysics Group, Keele University, Keele
ST5 5BG,
UK
7
Kavli Institute for the Physics and Mathematics of the Universe
(WPI), University of Tokyo, 277-8583
Kashiwa,
Japan
Received: 20 January 2015
Accepted: 6 March 2015
Abstract
Context. The dominant astrophysical production site of the r-process elements has not yet been unambiguously identified. The suggested main r-process sites are core-collapse supernovae and merging neutron stars.
Aims. We explore the problem of the production site of Eu. We also use the information present in the observed spread in the Eu abundances in the early Galaxy, and not only its average trend. Moreover, we extend our investigations to other heavy elements (Ba, Sr, Rb, Zr) to provide additional constraints on our results.
Methods. We adopt a stochastic chemical evolution model that takes inhomogeneous mixing into account. The adopted yields of Eu from merging neutron stars and from core-collapse supernovae are those that are able to explain the average [Eu/Fe]–[Fe/H] trend observed for solar neighbourhood stars, the solar abundance of Eu, and the present-day abundance gradient of Eu along the Galactic disc in the framework of a well-tested homogeneous model for the chemical evolution of the Milky Way. Rb, Sr, Zr, and Ba are produced by both the s- and r-processes. The r-process yields were obtained by scaling the Eu yields described above according to the abundance ratios observed in r-process rich stars. The s-process contribution by spinstars is the same as in our previous papers.
Results. Neutron star binaries that merge in less than 10 Myr or neutron star mergers combined with a source of r-process generated by massive stars can explain the spread of [Eu/Fe] in the Galactic halo. The combination of r-process production by neutron star mergers and s-process production by spinstars is able to reproduce the available observational data for Sr, Zr, and Ba. We also show the first predictions for Rb in the Galactic halo.
Conclusions. We confirm previous results that either neutron star mergers on a very short timescale or both neutron star mergers and at least a fraction of Type II supernovae have contributed to the synthesis of Eu in the Galaxy. The r-process production of Sr, Zr, and Ba by neutron star mergers – complemented by an s-process production by spinstars – provide results that are compatible with our previous findings based on other r-process sites. We critically discuss the weak and strong points of both neutron star merging and supernova scenarios for producing Eu and eventually suggest that the best solution is probably a mixed one in which both sources produce Eu. In fact, this scenario reproduces the scatter observed in all the studied elements better.
Key words: Galaxy: evolution / Galaxy: halo / stars: abundances / nuclear reactions, nucleosynthesis, abundances / stars: neutron / stars: rotation
© ESO, 2015
1. Introduction
The heavy element Eu is an r-process element; that is to say, it is produced by neutron captures on heavy elements (for instance as Fe) in a rapid process, where rapid refers to the timescale of the neutron capture rates relative to the β-decay rates of unstable nuclei. The main production site of Eu is still a matter of debate (e.g. Thielemann et al. 2011).
Observations of heavy element abundances in Galactic halo stars provide important constraints on the astrophysical site(s) of r-process nucleosynthesis. Interestingly, a wide spread is found in the [Eu/Fe] ratios in halo stars (as well as for several s-process elements, such as Ba, Y, La), and is much wider than the spread found for [α/Fe] ratios in the same stars.
Using an homogeneous chemical evolution model, Mennekens & Vanbeveren (2014) conclude that neutron star/black hole mergers could be responsible for the Galactic r-process production. Their model did not consider a further contribution from Type II supernovae (SNeII). More recently, Matteucci et al. (2014) have employed a detailed chemical evolution model (Romano et al. 2010) to study the evolution of Eu in the Galaxy. Two possibilities for Eu production were considered: i) production by core-collapse SNe (stars with initial masses from 9 to 50 M⊙) during the explosion; and ii) neutron star mergers (NSMs). The classical production site for r-process elements, hence Eu, is core-collapse SNe (Truran 1981; Cowan et al. 1991).
The reason for introducing NSMs as an alternative to Eu production resides in the large uncertainties present in hydrodynamical nucleosynthesis calculations for r-process elements in massive stars, in particular, that neutrino winds in SNII explosions are proton-rich or only slightly neutron-rich (see for example Arcones et al. 2007; Wanajo et al. 2011; Arcones & Thielemann 2013, and references therein) and therefore have difficulty producing Eu. At the present time, only the magneto-rotational driven (MRD) SNe scenario has been shown to be a promising source of the r-process by Winteler et al. (2012) in the context of massive stars, and this result has been confirmed very recently by Nishimura et al. (2015). However, given the specific configuration needed by these progenitors, they are expected to be rare. On the other hand, the nucleosynthesis calculations relative to NSMs have provided robust results concerning the r-process element production in these objects (see for example Rosswog et al. 1999, 2000; Oechslin et al. 2007; Bauswein et al. 2013; Rosswog 2013; Hotokezaka et al. 2013; Kyutoku et al. 2013).
It has been suggested that up to 10-2 M⊙ of r-process matter may be ejected in a single coalescence event. Matteucci et al. (2014) suggest that NSMs could be entirely responsible for the Eu production in the Galaxy if the coalescence timescale is no longer than 1 Myr for the bulk of neutron star binary systems, the average Eu yield is 5 × 10⁻⁶ M⊙, and the mass range of progenitors of neutron stars is 9–50 M⊙. They also conclude that a mixed scenario could be acceptable, where both merging neutron stars and core-collapse SNe contribute to the Eu production. In the mixed scenario, the Eu yields from merging neutron stars should be lower since core-collapse SNe contribute to the enrichment. In particular, it was concluded that SNe in the range 20–50 M⊙ should produce 10-7–10-8 M⊙ of Eu each. Both models could reproduce the average trend of [Eu/Fe] versus [Fe/H] in the solar neighbourhood, the solar Eu abundance, and the Eu abundance gradient along the Galactic disk.
By relaxing the instantaneous mixing approximation, it is also possible to explore the information contained in the observed scatter (or lack of) in the different abundance ratios and, in particular, in [Eu/Fe]. Argast et al. (2004) explored the impact of Eu production by merging neutron stars and SNeII In their model the diffusion of the stellar ejecta into the interstellar medium is treated dynamically, hence predicting the chemical spread in the chemistry of the surrounding gas. Unlike the approach taken in Matteucci et al. (2014), Argast et al. (2004) do not provide a model where both the NSM and core-collapse SN are simultaneously taken into account. Another approach was presented by Cescutti (2008) who modelled the inhomogeneous mixing of the interstellar medium by means of a stochastic chemical evolution model. However, in this case the author considered only SNeII as a site of production of the r-process. Both in Argast et al. (2004) and Cescutti (2008), a large abundance scatter is predicted for neutron capture elements, whereas a much lower scatter is found for alpha/Fe abundance ratios, in agreement with observations. In both cases this was interpreted as a consequence of the stochastic formation of massive stars coupled with the different stellar mass ranges from which different elements come. In particular, Cescutti (2008) suggested that the wide spread observed in neutron capture elements and the significantly narrower spread in α-elements occurs because the site of production of α-elements includes the whole range of massive stars from 10 to 80 M⊙ whereas the mass range of production for neutron capture elements lies between 12 and 30 M⊙. More recently, cosmological SPH simulations that include treating the chemical elements have investigated the NSMs as possible sources of the r-process (van de Voort et al. 2015; Shen et al. 2014).
It is now important to check for consistency between the results obtained by Matteucci et al. (2014) on Eu with other r-process elements as well. In particular, it has recently been shown that MRD supernovae (Winteler et al. 2012) represent a promising source of r-process in the early Galaxy (Cescutti & Chiappini 2014). This model was able to reproduce the observed spread in the abundance ratios not only of Eu, but also of Sr, Ba, and Y. In the case of Sr, Ba and Y parts of the production most likely came from spinstars (Pignatari et al. 2008; Frischknecht et al. 2012), and the spinstar contribution to Eu is expected to be negligible. It has been shown that including the contribution of spinstars plays a key role in explaining the long-standing problem of the observed scatter in [Sr/Ba] in the Galactic halo, as first suggested in Chiappini et al. (2011) and later demonstrated by the inhomogeneous model calculations of Cescutti et al. (2013). Interestingly, the spinstar scenario also plays a key role in explaining light element observations such as C and N (see Chiappini et al. 2006, 2008; Cescutti & Chiappini 2010).
The goal of the present work is to evaluate the impact of including a NSM scenario (which produces Eu, but also the other n-capture elements mentioned above) on the previous conclusions based on the MRD SNe plus spinstar scenario. In the present work we again provide our predictions for Ba and Sr but also include two other light neutron-capture elements that have not been modelled before, Zr and Rb. In particular, Rb has only been measured in a few globular clusters (Barbuy et al. 2014; Yong et al. 2008, 2014; D’Orazi et al. 2013; Wallerstein et al. 2007).
The paper is organized as follows. In Sect. 2 we summarize the observational data considered in this work. In Sect. 3, we introduce the chemical evolution model. In Sect. 4 we present our results and compare them to the available observations. In Sect. 5, we draw some conclusions.
Prescriptions for Eu production for different models.
2. Observational data
We employed the same data as used in Cescutti et al. (2013): the data compiled by Frebel (2010a,b) and labelled as halo stars1. We excluded all upper limits and carbon-enhanced, metal-poor (CEMP) stars. For CEMP stars we adopt the definition given by Masseron et al. (2010), where a CEMP star has [C/Fe] > 0.9. In the compilation by Frebel, there is also a large portion of stars without carbon measurements. For these stars we cannot establish whether they are CEMP stars or not; nevertheless, since they represent a large portion, we decided to include them in our plots, but to distinguish them graphically from the confirmed normal stars. CEMP-s stars are excluded from our comparison because, if carbon enhancement is caused by transfer of matter from an evolved companion, the abundances of s-process elements are likely to be affected, too. Therefore, no meaningful comparison can be done with the predictions of our chemical evolution model in this case, since it refers to the chemical composition of the stars at birth.
We expect CEMP-no stars to behave differently from normal stars only in the abundances of their light elements (Cescutti & Chiappini 2010; Maeder et al. 2015). The abundances of their heavy elements show features compatible to those of normal stars (Cescutti et al. 2013). Nevertheless, since they are not the main focus of this work, CEMP-no stars are not included in the present analysis. We did not show any data for Rb, since for this element we could not find data for field stars at extremely low metallicity, and to our knowledge the lowest metallicity data for Rb in the literature refer to stars with [Fe/H] ~−2 that belong to globular clusters measured by Yong et al. (2006, 2008).
3. The chemical evolution model
The chemical evolution model adopted here is the same as in Cescutti et al. (2013) and Cescutti & Chiappini (2014). We review its main characteristics here for the reader’s convenience.
We considered the chemical evolution model presented in Cescutti & Chiappini (2010), which is based on the inhomogenous model developed by Cescutti (2008) and on the homogeneous model of Chiappini et al. (2008). The halo consists of many independent regions, each with the same typical volume, and each region does not interact with the others. Accordingly, the dimensions of the volume are expected to be large enough to allow us to neglect the interactions between different volumes, at least as a first approximation. For typical ISM densities, a supernova remnant becomes indistinguishable from the ISM – that is, merges with the ISM – before reaching ~50 pc (Thornton et al. 1998); therefore, we decided to have a typical volume with a radius of roughly 90 pc, and the number of assumed volumes is 100 to ensure good statistical results. We did not use larger volumes because we would lose the stochasticity we are looking for; in fact, larger volumes produce more homogeneous results.
In each region, we assumed the same law for the infall of the gas with primordial composition, following the homogeneous model by Chiappini et al. (2008): 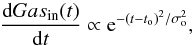 (1)where to is set to 100 Myr, and σo is 50 Myr. Similarly, the star formation rate (SFR) is defined as
 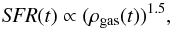 (2)where ρgas(t) is the density of the gas inside the volume under consideration. Moreover, the model takes an outflow from the system into account:
 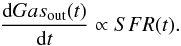 (3)Knowing the mass that is transformed into stars in a time step (hereafter,
  ), we assigned the mass to one star with a random function, weighted according to the initial mass function (IMF) of Scalo (1986) in the range between 0.1 and 100 M⊙. We then extracted the mass of another star and repeated this cycle until the total mass of newly formed stars exceeded . In this way, is the same in each region at each time step, but the total number and mass distribution of the stars are different. We thus know the mass of each star contained in each region, when it is born and when it will die, assuming the stellar lifetimes of Maeder & Meynet (1989). At the end of its lifetime, each star enriches the ISM with its newly produced chemical elements and with the elements locked in that star when it was formed, excluding the fractions of the elements that are permanently locked in to the remnant.
As shown in Cescutti et al. (2013), our model is able to reproduce the MDF measured for the halo by Li et al. (2010). This comparison shows that the timescale of enrichment of the model is compatible with that of the halo stars in the solar vicinity. Moreover, our model predicts a small spread for the α-elements Ca and Si, which is compatible with the observational data.
3.1. Stellar yields for Eu
For the Eu production sites, we consider NSMs and core-collapse SNe, as mentioned in the Introduction. To take the Eu production from NSMs into account, we need to define the following quantities (see Matteucci et al. 2014):
-
1.
the fraction of massive stars belonging to double NS systemsthat will eventually merge, namely the realization probability forsuch events, αNS;
-
2.
the time delay between the formation of the double neutron star system and the merging event, ΔtNS;
-
3.
the amount of Eu produced during the merging event,
 .
.
Concerning NSM yields, we also follow what is assumed in Matteucci et al. (2014); in particular, we assume the yields of Korobkin et al. (2012), who suggest that NSM can produce from 10-7 to 10-5 M⊙ of Eu per event.
In the present paper, we assume that a fixed fraction of all the massive stars formed in our simulation is a progenitor of NSMs and produces r-process material. The progenitors are randomly chosen among the massive stars formed in the range 9–30 M⊙. The prescriptions for the different models are summarized in Table 1, where we list (i) the model name (Col. 1); (ii) the delay time for coalescence of NS in binary systems (Col. 2); (iii) the fraction of massive stars that are hosted in binary systems leading to NSMs (Col. 3); (iv) the mass ejected as newly produced Eu in NSM events (Col. 4); and (v) the Eu yields from massive stars. For models NS03 and NS04, the amount of r-process in the single event is not constant, but we considered the possibility that the amount of mass ejected as r-process varies. Since the variation is unknown, we assumed the following range: the minimum production is 1% of the average Eu amount, and the maximum is twice the average. Since the total production should be conserved, the ejected mass for the nth star (r-process producer) in these models can be described by the following equation:  (4)where Rand(n) is a uniform random distribution in the range [0,1]. This function is the same as the one presented in Cescutti & Chiappini (2014). In Table 1 we report the average Eu amount for the merging event (
 ) assumed for each model.
For the time delay due to the coalescence of the two NSs, ΔtNS, Argast et al. (2004) and Matteucci et al. (2014) considered different timescales: 1 Myr, 10 Myr, and 100 Myr. Here we consider the same timescales. It is worth noting that in previous works, as well as in this one, it is assumed that all neutron star binaries have the same coalescence timescale. Clearly, a more realistic approach should consider a distribution function of such timescales, in analogy with SNeIa for which a distribution for the explosion times is defined (see Greggio 2005).
Among core-collapse SNe, different candidates for Eu production have been studied in the past, and they can either have low mass (8–10 M⊙) or high mass progenitors (>20 M⊙Cowan et al. 1991; Woosley et al. 1994; Ishimaru & Wanajo 1999; Travaglio et al. 1999; Wanajo et al. 2001; Argast et al. 2004; Cescutti et al. 2006). The yields of Eu from SNe II that we adopt here are similar to those of Argast et al. (2004; their model SN2050) modified as in Matteucci et al. (2014; their model Mod2SNNS), as shown in Table 1. They are coupled with a production from NSM with a delay of 1 Myr (see Table 1). Actually, since we adopt iron yields from SNeII larger than Matteucci et al. (2014), we need to slightly increase the Eu production for the 50 M⊙ to balance the higher production of iron in our models. Since the most recent results concerning the production of Eu in SNe do not confirm these channels (see Arcones et al. 2007, for the high mass channel, and Wanajo et al. 2011, for the low mass channel), we investigate another possible production connected to massive stars: the magneto-rotational driven (MRD) scenario. Winteler et al. (2012) have shown that the combination of high rotation and strong magnetic field in the inner core of an exploding SN promotes an r-process production (see also Nishimura et al. 2015). This specific configuration is rare, therefore only a limited number of SNe have this fate, and as mentioned in Winteler et al. (2012), it should be more frequent in the metal-poor regime (Yoon et al. 2006). Therefore, we explore a model in which 10% of the SNe produce r-process material, with the same prescriptions as assumed in Cescutti & Chiappini (2014). However, unlike that paper, we consider here that this channel is only active at low metallicity, Z< 10-3. Coupled with the production of MRD SNe, we also assume a NSM production with a fixed delay of 100 Myr (see Table 1).
Finally, we note that in the spinstar framework, Eu is produced in negligible amounts.
3.2. Stellar yields for Rb, Sr, Zr, and Ba
Rb, Sr, Zr, and Ba are produced by both the s- and r-processes. The r-process yields are obtained by scaling the Eu yields adopted here according to the abundance ratios observed in r-process-rich stars (Sneden et al. 2008). Another possible choice would be to take the solar system r-process contribution into account as determined, for example, by Simmerer et al. (2004) and Arlandini et al. (1999); we checked that this does not seriously affect the results for these elements. Our choice does not rest on the results of the theoretical computations of the main r-process; rather, we infer the r-process elements yields from an observational signature that could reflect a combination of processes (e.g. main r-process + weak r-process). Moreover, a given process might present some intrinsic variation. Indeed, from an observational point of view, it seems that the robust pattern for the r-process does not extend to the elements between the first and second r-process peaks even within the class of highly r-process-enhanced stars (Roederer et al. 2014). In the future, we plan to use theoretical results for the r-process ratio to investigate this aspect.
The spinstars’ s-process contribution for all our models is the same as in the fs-model of Cescutti et al. (2013). However, we show here results for rubidium and zirconium, which were not treated in the previous paper, therefore we recall that for the yields at Z = 10-5, we considered the stellar yields obtained by Frischknecht et al. (2012) after decreasing the reaction rate for 17O(α,γ) from Caughlan & Fowler (1988) by a factor of 10, which enhances the s-process production2. Unfortunately, we only have results with this reaction rate for a single mass (25 M⊙) at Z = 10-5, and we used the scaling factor obtained for the whole range of masses (for more details, see Cescutti et al. 2013). Indeed, there are no nucleosynthesis calculations for spinstars currently carried out with a reduced value of the 17O(α,γ) rate for a metallicity higher than Z = 10-5, and we adopted those computed with the standard value given by Caughlan & Fowler (1988). We need to keep this caveat in mind when interpreting our theoretical predictions for the intermediate metallicity range. We also considered the s-process contribution from stars in the mass range 1.3–3 M⊙, by implementing the yields by Cristallo et al. (2009, 2011) in the models. We underline, however, that this production channel affects the model results only at moderate metallicity ([Fe/H] ~−1.5).
4. Results
4.1. NSM models
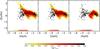 |
Fig. 1 Left panel: results for [Eu/Fe] vs. [Fe/H] for model NS00. This model has a delay time for the NSMs of 1 Myr, constant Eu production of 5 × 10⁻⁶ M⊙ per merging event, and no Eu from SNeII. The density plot is the distribution of simulated long-living stars for our model (see the bar below the figure for the colour scale). The long-living stars formed without Eu (formally [Eu/Fe] = −∞) are shown at [Eu/Fe] = −2.4. The model predictions are compared to data collected in Frebel (2010a); we show as black dots stars with [C/Fe] < 0.9 (to avoid binary enrichment), the open dots are stars with no carbon measurement. Central panel: same as left panel, but for model NS01. This model has a delay time for the NSMs of 10 Myr, constant Eu production of 5 × 10⁻⁶ M⊙ per merging event, and no Eu from SNeII. Right panel: again same as for the left panel, but for model NS02. This model has a delay time for the NSMs of 100 Myr, constant Eu production of 5 × 10⁻⁶ M⊙ per merging event, and no Eu from SNeII. |
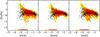 |
Fig. 2 Left panel: same as Fig. 1, but for model NS03. This model has a delay time for the NSMs of 1 Myr, variable Eu yield per merging event (average value 5 × 10⁻⁶ M⊙), and no Eu from SNeII. Central panel, same as left panel, but for model NS04. This model has a delay time for the NSMs of 1 Myr, variable Eu yield per merging event (average value 2.5 × 10⁻⁶ M⊙), and no Eu from SNeII. In this model, the fraction of massive stars leading to NS merging events is twice what is assumed in previous models. Right panel: same as left panel, but we present here a model similar to model NS03 in which we consider a mass range for neutron stars progenitors of the NSM of 9–50 M⊙ instead of 9–30 M⊙. |
In Fig. 1 (left panel) we show the distribution of synthetic halo stars in the [Eu/Fe]–[Fe/H] plane as predicted by our inhomogeneous model when assuming that (i) Eu is produced only in NSMs with progenitors for neutron stars in the range 9–30 M⊙; (ii) 2% of massive stars are in binary systems with the right characteristics to lead to merging NS; (iii) each merging event produces 5 × 10⁻⁶ M⊙ of Eu; and (iv) there is a fixed delay time of 1 Myr between the formation of the double NS system and the merging event (model NS00, see Table 1).
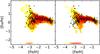 |
Fig. 3 Left panel: same as Fig. 1, but for model NS+SN. The prescriptions about Eu nucleosynthesis for model NS+SN are similar to those of model Mod2SNNS by Matteucci et al. (2014) , but it allows for inhomogeneous mixing in the early Galaxy. Right panel: same as left panel but for model NS+MRD. In this model we consider the production of Eu by NSMs with a delay of 100 Myr and also a production by MRD SN (10% of all SNe II) but only for Z< 10-3. |
It is seen that, while explaining very well the data of stars with [Fe/H] ≥−2.2 dex, such a model fails to explain the presence of stars with [Eu/Fe] < 0.5 for [Fe/H] ≤−2.5 and does not explain the existence of any star with Eu measurements at metallicities lower than [Fe/H] = −3. The upturn in [Eu/Fe], visible at low metallicities, is a consequence of the fixed amount of Eu produced by NSM, coupled with the paucity of NSM events and the constant mixing volume assumed in our model. When a NSM pollutes a simulated box early on, it produces a value in the [Eu/Fe] vs. [Fe/H] space, dependent on the mass of the previous enriching SNeII. The volume enriched by NSM and SNII with the lowest amount of iron creates the upper tip of this upturn towards low metallicity. Then in all the volumes polluted by NSM, the probability of having another Eu enrichment is low, so they evolve towards lower [Eu/Fe] and higher [Fe/H] by the subsequent enrichment of Fe by SNII, creating the diagonal shape from high [Eu/Fe] with low [Fe/H] to low [Eu/Fe] with higher [Fe/H] shown in Fig. 1 (left panel). A more detailed dynamical treatment, where the pollution in not confined to fixed volumes, does not produce this sharp feature (Argast et al. 2004). Also to consider a variation in the r-process production (as in the models NS03-NS04, see below) leads to a smoothing of this sharp trend. The fraction of Eu-free stars, shown in the band at [Eu/Fe] = −2.4, is not negligible for this model and also for the next NSM models; we discuss the implication of this outcome in the Sect. 4.4 in more detail.
A model with a delay time of 10 Myr (model NS01) essentially behaves the same (see Fig. 1, central panel), while delay times as long as 100 Myr cannot be accepted, because they lead to even worse predictions, with all stars with Eu measurements below [Fe/H] ~−2 dex being unexplained by the model (model NS02, Fig. 1, right panel). Therefore, in the following we only discuss models that assume ΔtNS = 1 Myr (apart for model NS+MRD). Similar results have been found by Matteucci et al. (2014).
In Fig. 2 (left panel) we show the predictions of model NS03, which is the same as model NS00, except that the masses ejected by NSMs are not constant, but instead randomly distributed around the mean value, 5 × 10⁻⁶ M⊙ (see Eq. (4)). This approach is similar to the one adopted by Cescutti & Chiappini (2014) to explain the Ba, Y, Sr, and Eu abundance scatter in halo stars in the framework of a model where MRD SNe are the only r-process element sources. In Fig. 2 (central panel) we show the predictions of model NS04, which differs from model NS03 in the adopted value of the average Eu yield from NSMs, 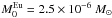 , i.e. half the value adopted in model NS03. Moreover, model NS04 assumes that the fraction of massive stars leading to NSMs is twice the value adopted in model NS03, namely 4%. It is worth noticing that Matteucci et al. (2014) require that 2% of massive stars are hosted in binary systems, leading to NS mergers in order to fit the current merger rate of these systems in the Galaxy. However, there are no strong arguments against a variation in this quantity in the early Universe. As a matter of fact, model NS04 leads to theoretical predictions that agree with the data much more closely than model NS03. In particular, model NS03 also predicts a wide spread at intermediate metallicities, which also implies a non-negligible population of stars with sub-solar [Eu/Fe] ratios at [Fe/H] ~−2, which are actually not observed. We note that, however, model NS04 does not allow fully addressing the existence of stars with [Eu/Fe] < 0 for [Fe/H] <−3. In Fig. 2 (right panel), we show the results of model NS03, but with a mass range for neutron star progenitors of 9–50 M⊙, instead of 9–30 M⊙. In fact, Matteucci et al. (2014) suggest that Eu in the Galaxy can only be reproduced by NSM if the range of progenitors of neutron stars extends up to 50 M⊙. However, this change does not provide significant variations in our predictions, mostly because of the stochastic nature of our model in which the enrichment at the lowest [Fe/H] is not necessarily due to the most massive stars.
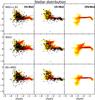 |
Fig. 4 From the left [Sr/Ba], [Zr/Ba] and [Rb/Ba] vs. [Fe/H] in the halo; the density plot is the distribution of simulated long-living stars for our models. Superimposed, we show the abundance ratios for halo stars (data from Frebel 2010a). The symbols for the Frebel (2010a) data are black dots for normal stars, and black open circles for stars without carbon measurement. |
We are aware that to obtain a reasonable agreement with the observational data, we had to assume the shortest timescale for the neutron stars mergers suggested in the literature (Belczynski et al. 2002), and this can be an extreme assumption. In fact, a progenitor lifetime of 1 Myr is already the shortest possible timescale in the distribution of merger times by Belczynski et al. (2002); then, unfortunately, their population synthesis method is not very predictive of the merging timescale: “Unlike all other binary properties ... the qualitative characteristics of the merger-time distributions appear to be rather sensitive to a number of model parameters”. Moreover, the local rate of short-hard gamma ray bursts can provide at least a rough observational constraint on the typical lifetimes of its progenitors (so NS-NS binaries), and the results seem to indicate lifetimes of a few Gyrs (see Nakar et al. 2006). Finally, the estimated merger times for the few NS-NS binaries in our Galaxy are of the order of 100 Myr (Kalogera et al. 2001; Piran & Shaviv 2005), so all these observational indications cannot exclude that some NSM explode on a very short timescale, but at least they seem to point to an average merger time that is much longer than 1 Myr.
Argast et al. (2004) have also studied the NSMs as a possible source of r-process material. Their model dynamically traces the diffusion of the ejecta, so in this respect it is more detailed than our model. However, it is not clear how well their model follows the chemical evolution of the Galaxy, since no comparison with the global MDF of the halo was provided, and no outflow from the system was considered. Still, despite these differences, the results do not differ substantially, apart from the tendency of their model to produce too many r-process-poor stars at intermediate metallicity compared to our results and presumably a larger number of metal free stars. Also their conclusions are similar: “NSM as major r-process sources are only consistent with observations” if “the NSM population has coalescence timescales shorter than approximately 10 Myr”. They underline that NSM could be co-producers of the r-process, together with core-collapse SN, but they do not analyse the possible outcome. We provide this comparison in the next section.
4.2. NSM and core-collapse models
A possible solution to the issue of the existence of stars with [Eu/Fe] < 0 at [Fe/H] <−3 is to consider Eu production from core-collapse SNe. At the present time, a scenario in which all SNe II produce Eu is not supported by nucleosynthesis models. A standard SNII explosion can produce chemical elements only up to the Sr-Y-Zr peak during a normal core-collapse SN explosion (Arcones et al. 2007). Nevertheless, at least to have a possible idea of the impact of this production, we present the results of model NS+SN in Fig. 3 (left panel). This model shares the prescriptions for Eu production in NSMs with model NS03, but add to it a contribution from SNeII increasing from 2 × 10⁻⁸ M⊙ for a 20 M⊙ star to 5 × 10⁻⁷ M⊙ for a 50 M⊙ star. As for the synthesis of Eu, model NS+SN adopts prescriptions similar to those of model Mod2SNNS in Matteucci et al. (2014). The model proved successful in reproducing the average [Eu/Fe]–[Fe/H] relation of solar neighbourhood stars, the solar Eu abundance, and the present [Eu/H] gradient across the disc.
Finally, we explore the possibility that a fraction of massive stars end their life with a strong magnetic field and an extremely fast rotation in their inner cores. This MRD SN scenario has been studied in Winteler et al. (2012) and Nishimura et al. (2015). According to their results, the explosion is able to trigger a production of r-process material. We assume that this channel is active only in 10% of massive stars and only in the metal-poor environments (log(Z) < − 3) since this channel is favoured at low metallicities. As in previous cases, in model NS+MRD, the MRD production is coupled with the NSM productions, but with a long delay of 100 Myr. In Fig. 3 (right panel) the results of model NS+MRD are presented. In this case the model is able to explain the distribution of the data at low metallicity and the overall trend very well.
Model NS+MRD provides a possible solution if the timescale for Eu enrichment from NSM turns out to be relatively long. Clearly, more detailed assumptions, such as a time delay distribution for the NSM or a fading of the MRD contribution (rather than a switch off at a certain metallicity), would be an improvement in the modelling. However, at the moment neither observational nor theoretical indications allow us to build better scenarios, so we prefer to keep things simple. Nevertheless, we underline again that this double scenario is a promising way to explain the distribution of [Eu/Fe] in extremely metal-poor stars.
4.3. NSM and spinstar scenario
Now we turn to other neutron-capture elements, with both an r- and an s-process component, namely Sr, Ba, Zr, and Rb. In the first column of Fig. 4 we show the resulting [Sr/Ba] vs. [Fe/H] for models NS+MRD and NS03, compared to model MRD+s B2. In model MRD+s B2, we assumed that 10% of the massive stars end their lives as MRD SNe, and we considered the possibility that the amount of mass ejected as r-process varies following Eq. (4) (see Cescutti & Chiappini 2014, for further details). The aim is to investigate the impact of the different r-process productions assumed in NS+MRD and NS03 on the previous results of Cescutti et al. (2013) and Cescutti & Chiappini (2014), in particular on the idea of spinstar production as a viable explanation for the spread in [Sr/Ba] in the observational data, which is a concept introduced by Chiappini et al. (2011). We recall that in all the models, Sr, Ba, Zr, and Rb are produced by both s- and r-processes. The r-process yields are obtained by just scaling the Eu contribution according to the chemical abundance ratios observed in r-process-rich stars (Sneden et al. 2008). We consider the contribution by spinstars, following the yields calculated by Frischknecht et al. (2012). The original model MRD+s B2 (see Cescutti & Chiappini 2014) was in fact able to reproduce the scatter of [Sr/Ba] data at [Fe/H] <−2.5, thanks to the combination of the spinstar production with [Sr/Ba] > 0 and the r-process production fixed at [Sr/Ba] ~−0.2.
Model NS+MRD turns out to be very similar to model MRD+s B2, and we note just tiny variations in the predicted distribution of long-living stars. This happens because the models have essentially the same nucleosynthesis prescriptions at low metallicity (log(Z) < −3). At log(Z) > −3, the models are different: NSMs are the only r-process producers in model NS+MRD, but the impact of this change is mitigated by an ISM that is already homogenous and quite rich in neutron capture elements, so the models do not show remarkable differences.
On the other hand, an important difference arises in the comparison between the NS03 model and the other models. Since the NSM rate is lower than the assumed rate of MRD SN events, the average time needed to have an enrichment of the r-process by NSMs is longer in a stochastic realization. Therefore, we find in this model volumes that are only polluted by spinstars for a longer period, and they can survive without r-process pollution up to [Fe/H] ~−2. This can be noticed in the more extended prediction of long-living stars with high [Sr/Ba] and also in higher stellar density, in the area [Sr/Ba] > 0 and −3< [Fe/H] <−2.
In the second and third columns of Fig. 4, we display our new results on the impact of spinstars in the chemical evolution of [Zr/Ba] and [Rb/Ba]. We underline that these chemical predictions for Rb are the first results available for this element (probably due to the paucity of observational data). For Zr we have found few homogeneous models that describe its evolution (among them Travaglio et al. 2004; Cescutti 2007). The model results for [Zr/Ba] are very similar to the results for [Sr/Ba]; since the observational data have similar distributions, we can conclude that our models reproduce the stellar abundances well at low metallicity for Zr. Also, the differences amongst the predictions of the different models, in particular between model NS03 and models MRD+s B2 and NS+MRD, follow the same pattern for the [Sr/Ba] case. In contrast, the predictions for [Rb/Ba] are more complex and show different trends. The spinstars for these elements do not always produce a ratio above the r-process signature, but in both directions (above and below).
The different behaviour of Rb with respect to Sr (and Zr) has several explanations. The first is that the ratio [Rb/Ba] is generally lower than [Sr/Ba]. This is because Rb is less stable than Sr (and Ba). This first difference is enhanced in spinstars for the following reasons. The isotopes produced in spinstars that are most abundant have different properties for Sr and Rb, in particular their position along the s-process path and their neutron-richness (see e.g. Käppeler et al. 2011,and references therein). For Sr the most abundant isotope produced is 88Sr, which is the most neutron-rich stable isotope of Sr. 88Sr is a bottleneck of the s-process path at N = 50, and it is one of the main isotopes produced by the weak s process in massive stars. Its production is generally high. The situation is different for Rb. This element has only two stable isotopes, 85Rb and 87Rb (as opposed to 4 for Sr). The Rb isotope most abundantly produced by the weak s process is 85Rb. The production of 85Rb is sensitive to the branching point at 85Kr. If neutron densities are high, more 85Kr capture another neutron instead of beta-decaying to 85Rb. This thus reduces the production of 85Rb significantly. This reduction is compensated for partially by an increase in the production of 87Rb (via beta decay of 87Kr), but generally the production of 87Rb is an order of magnitude lower than 85Rb. Neutron densities are high in the spinstar models considered in this work (with a low O17(α,γ) rate). This leads to a generally lower production of Rb relative to Sr for the reasons listed above and explains why [Rb/Ba] are lower than [Sr/Ba] (and [Zr/Ba]).
Indeed, the different behaviour of Rb with respect to Sr (and Zr) is an interesting signature that can be investigated in future observational campaigns; at the moment, only a few measurements at higher metallicity in globular clusters are available. Again, the NS03 model predicts a stronger presence of long-living stars polluted by spinstars compared to the models MRD+s B2 and NS+MRD.
In summary, the assumptions on the r-process production of the models NS+MRD and NS03 do not alter the findings of Cescutti et al. (2013) and Cescutti & Chiappini (2014), and the spinstars produce a spread in [Sr/Ba] and [Zr/Ba] for these models matching the observational data. For [Rb/Ba], no data are available at the moment to check our results, but we predict a different spread than for [Sr/Ba] and [Zr/Ba]. The NS03 model tends to enhance the population of long-living stars polluted by spinstars alone, compared to the two other models. This point is not easily tested, but the tendency does not appear to be displayed at least in the available observational data (see Fig. 6 in Cescutti & Chiappini 2014), since stars with very high [Sr/Ba] (>0.5 dex) are not so frequent.
4.4. Eu-free stars?
The different r-process sites analysed in the previous sections (MRD SN, NSM) have a common feature: only a small fraction (<10%) of the massive stars actually enter Eu production. On one hand, this promotes the observed spread of [Eu/Fe] at low metallicities. On the other hand, it ensures that at extremely low metallicities a complementary fraction of low mass stars are formed in regions where no r-process synthesis took place; for this reason, it seems likely to form some Eu-free stars. The possibility that the r-process production is delayed further increases the fraction of Eu-free stars, since more stars can be formed before any Eu enriches the ISM.
Our stochastic models predict the formation of a fraction of Eu-free stars: all the low mass stars formed in each stochastic realization before the first enrichment by a r-process site are Eu-free. Therefore, we investigate how this result matches the observations of Galactic halo stars. We check this by computing the ratio of Eu-free stars over the total number of stars in our models in a given [Fe/H] bin and then compare these theoretical ratios to an observational proxy for this ratio. The number of observed stars where it has been measured is only an upper limit for Eu compared to the total number of stars for which Ba has been observed (see Fig. 5). We are aware that there is probably a bias in this plot, since it is affected by the weakness of the Eu line, so below a certain metallicity, the signal-to-noise ratio to distinguish the Eu line cannot be achieved during standard observations. For this reason, we expect this proxy to only be an upper limit of the real fraction of Eu-free stars.
Model NS+SN always shows a lower fraction of Eu-free stars compared to our observational proxy; since given the above, this proxy is an upper limit, it is a positive result. The model NS+MRD predicts a higher number of Eu-free stars than in our observational proxy. Nevertheless, a slightly higher rate for the MRD events at extremely low metallicity could solve this problem. Model NS04, which is the one performing better in the pure NSM scenario, always predicts a too high ratio of Eu-free stars compared to our observational proxy, and it also only drops to zero at very high metallicity.
We note that also rotating massive stars can produce a tiny amount of Eu by s-process (see Frischknecht et al. 2012), however the calculations at the present time can produce at best an [Eu/Fe] ~−4 at [Fe/H] ~−3. We have indeed included the yields for spinstars in the models discussed in this paper, but their impact is simply too low to be seen in the plots.
Should future observations show that Eu is always present in the composition of EMP stars, similar to Ba and Sr (Roederer 2013), the most likely explanation would be that all core-collapse SNe are producing at least a tiny fraction of Eu through some r-process channel (as in our model NS+SN). Another way to solve the riddle, as investigated by Komiya et al. (2014), would be to assume that the observed Eu is accreted on the stellar surface from the ISM, but this result contradicts Frebel et al. (2009).
Overall, the results obtained with the inhomogeneous model for the chemical evolution of the Galactic halo adopted in this work confirm and reinforce previous conclusions by Matteucci et al. (2014) that either NS mergers explode on a very short timescale or that at least a fraction of SNeII (MRD SNe) must produce some Eu. At present, the last scenario should be preferred, since it is the one that best reproduces the available observations.
5. Conclusions
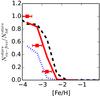 |
Fig. 5 Ratio of Eu-free stars over the total number of stars for bins of 0.5 dex in [Fe/H]. The model results are displayed with a black dashed line (model NS04), red solid line (model NS+MRD), and blue dotted line (model NS+SN). The red squares are the observational proxy for this ratio, so the ratio between stars in which Eu only presents an upper limit over the number of stars for which at least Ba has been measured. The error bars are only plotted to show the dimension of each bin in [Fe/H]. |
In this paper, we adopt the inhomogeneous model for the chemical evolution of the Galactic halo presented by Cescutti (2008) and further developed in Cescutti & Chiappini (2010, 2014) and Cescutti et al. (2013), to study the evolution of the n-capture elements Eu, Sr, Ba, Zr, and Rb in the early Galaxy. We implemented the Eu production from coalescing neutron stars in the code following the prescriptions of Matteucci et al. (2014). These in turn rest on recent work by Korobkin et al. (2012) showing that large amounts of r-process elements, 0.01 M⊙, can be produced by NS when they merge. Out of these, the mass of newly produced Eu can lie in the range ~10-7 −10-5 M⊙. Matteucci et al. (2014) have already studied the effect of such a large Eu production from NSMs by means of a detailed homogeneous chemical evolution model for the Milky Way. They suggest that, though NSMs can in principle explain the history of Eu enrichment in the Milky Way by themselves, a more realistic situation requires that both NSMs and (at least) a fraction of core-collapse SNe contribute to the Eu production in the Milky Way. However, while Matteucci et al. (2014) could explain the observed trend of [Eu/Fe] versus [Fe/H] in the solar vicinity, the abundance of Eu measured in the Sun and the present-day abundance gradient of Eu along the disc, they did not address the problem of explaining the wide spread of [Eu/Fe] ratios measured in halo stars, because their analysis was carried out with the use of homogeneous chemical evolution models, which are intended to reproduce average trends.
In the present work we provide a complementary analysis by using stochastic chemical evolution models and investigate the information contained in the scatter of several abundance ratios (e. g. [Eu/Fe], [Sr/Ba], [Zr/Ba], and [Rb/Ba]). We show that either NSMs explode with a very short fixed timescale or both channels – NSMs and core-collapse SNe (at least a fraction of them as in the MRD scenario) – must be active. In order to explain the spread, as well as both the presence of stars with low [Eu/Fe] at [Fe/H] <−3 and a certain fraction of Eu-free stars, the last scenario should be preferred.
The results shown here are consistent with the recent conclusions by Cescutti et al. (2013) and Cescutti & Chiappini (2014) of an important role of spinstars in the early Universe, not only as contributors to light elements, but also to n-capture elements such as Sr, Ba, Zr, and Rb. Indeed, their inclusion, together with NSM and MRD SN sites, leads to models that can reproduce the scatter observed in all of these elements very well.
The list of authors we use from the collection are McWilliam et al. (1995), McWilliam (1998), Westin et al. (2000), Aoki et al. (2002, 2005, 2006, 2007), Cowan et al. (2002), Ivans et al. (2003), Honda et al. (2004), Barklem et al. (2005), Ivans et al. (2006), Masseron et al. (2006), Preston et al. (2006), François et al. (2007), Lai et al. (2007), Cohen et al. (2008), Lai et al. (2008), Roederer et al. (2008), Bonifacio et al. (2009), Hayek et al. (2009)
A value of the metallicity of Z = 10-5 corresponds to [Fe/H] ≃−3.5, with small variations due to the stochasticity of the models.
Acknowledgments
G.C. thanks the organizers and participants of the program INT 14-2b “Nucleosynthesis and Chemical Evolution”, where much of this work was discussed in Summer 2014; special thanks to Almudena Arcones for her intriguing questions and suggestions that have a strong impact on this manuscript. G.C. also acknowledges financial support from the INT during the program; F.M. and D.R. acknowledge financial support from PRIN MIUR 2010-2011, project “The Chemical and Dynamical Evolution of the Milky Way and Local Group Galaxies”, prot. 2010LY5N2T. R.H. acknowledges support from the European Research Council (EU-FP7-ERC-2012-St Grant 306901) and from the World Premier International Research Center Initiative, NEXT, Japan.
References
- Aoki, W., Ando, H., Honda, S., et al. 2002, PASJ, 54, 427 [NASA ADS] [Google Scholar]
- Aoki, W., Honda, S., Beers, T. C., et al. 2005, ApJ, 632, 611 [NASA ADS] [CrossRef] [Google Scholar]
- Aoki, W., Frebel, A., Christlieb, N., et al. 2006, ApJ, 639, 897 [NASA ADS] [CrossRef] [Google Scholar]
- Aoki, W., Honda, S., Beers, T. C., et al. 2007, ApJ, 660, 747 [NASA ADS] [CrossRef] [Google Scholar]
- Arcones, A., & Thielemann, F.-K. 2013, J. Phys. G Nucl. Phys., 40, 013201 [Google Scholar]
- Arcones, A., Janka, H.-T., & Scheck, L. 2007, A&A, 467, 1227 [NASA ADS] [CrossRef] [EDP Sciences] [Google Scholar]
- Argast, D., Samland, M., Thielemann, F.-K., & Qian, Y.-Z. 2004, A&A, 416, 997 [NASA ADS] [CrossRef] [EDP Sciences] [Google Scholar]
- Arlandini, C., Käppeler, F., Wisshak, K., et al. 1999, ApJ, 525, 886 [NASA ADS] [CrossRef] [Google Scholar]
- Barbuy, B., Chiappini, C., Cantelli, E., et al. 2014, A&A, 570, A76 [NASA ADS] [CrossRef] [EDP Sciences] [Google Scholar]
- Barklem, P. S., Christlieb, N., Beers, T. C., et al. 2005, A&A, 439, 129 [NASA ADS] [CrossRef] [EDP Sciences] [Google Scholar]
- Bauswein, A., Goriely, S., & Janka, H.-T. 2013, ApJ, 773, 78 [NASA ADS] [CrossRef] [Google Scholar]
- Belczynski, K., Kalogera, V., & Bulik, T. 2002, ApJ, 572, 407 [NASA ADS] [CrossRef] [Google Scholar]
- Bonifacio, P., Spite, M., Cayrel, R., et al. 2009, A&A, 501, 519 [NASA ADS] [CrossRef] [EDP Sciences] [Google Scholar]
- Caughlan, G. R., & Fowler, W. A. 1988, At. Data Nucl. Data Tables, 40, 283 [Google Scholar]
- Cescutti, G. 2007, Ph.D. Thesis (Astronomy Department) Trieste University [Google Scholar]
- Cescutti, G. 2008, A&A, 481, 691 [NASA ADS] [CrossRef] [EDP Sciences] [Google Scholar]
- Cescutti, G., & Chiappini, C. 2010, A&A, 515, A102 [NASA ADS] [CrossRef] [EDP Sciences] [Google Scholar]
- Cescutti, G., & Chiappini, C. 2014, A&A, 565, A51 [NASA ADS] [CrossRef] [EDP Sciences] [Google Scholar]
- Cescutti, G., François, P., Matteucci, F., Cayrel, R., & Spite, M. 2006, A&A, 448, 557 [NASA ADS] [CrossRef] [EDP Sciences] [Google Scholar]
- Cescutti, G., Chiappini, C., Hirschi, R., Meynet, G., & Frischknecht, U. 2013, A&A, 553, A51 [NASA ADS] [CrossRef] [EDP Sciences] [Google Scholar]
- Chiappini, C., Hirschi, R., Meynet, G., et al. 2006, A&A, 449, L27 [NASA ADS] [CrossRef] [EDP Sciences] [Google Scholar]
- Chiappini, C., Ekström, S., Meynet, G., et al. 2008, A&A, 479, L9 [NASA ADS] [CrossRef] [EDP Sciences] [Google Scholar]
- Chiappini, C., Frischknecht, U., Meynet, G., et al. 2011, Nature, 472, 454 [NASA ADS] [CrossRef] [Google Scholar]
- Cohen, J. G., Christlieb, N., McWilliam, A., et al. 2008, ApJ, 672, 320 [NASA ADS] [CrossRef] [Google Scholar]
- Cowan, J. J., Thielemann, F.-K., & Truran, J. W. 1991, Phys. Rep., 208, 267 [NASA ADS] [CrossRef] [Google Scholar]
- Cowan, J. J., Sneden, C., Burles, S., et al. 2002, ApJ, 572, 861 [NASA ADS] [CrossRef] [Google Scholar]
- Cristallo, S., Straniero, O., Gallino, R., et al. 2009, ApJ, 696, 797 [NASA ADS] [CrossRef] [Google Scholar]
- Cristallo, S., Piersanti, L., Straniero, O., et al. 2011, ApJS, 197, 17 [NASA ADS] [CrossRef] [Google Scholar]
- D’Orazi, V., Lugaro, M., Campbell, S. W., et al. 2013, ApJ, 776, 59 [NASA ADS] [CrossRef] [Google Scholar]
- François, P., Depagne, E., Hill, V., et al. 2007, A&A, 476, 935 [NASA ADS] [CrossRef] [EDP Sciences] [Google Scholar]
- Frebel, A. 2010a, Astron. Nachr., 331, 474 [NASA ADS] [CrossRef] [Google Scholar]
- Frebel, A. 2010b, VizieR Online Data Catalog, J/AN/331/474 [Google Scholar]
- Frebel, A., Johnson, J. L., & Bromm, V. 2009, MNRAS, 392, L50 [NASA ADS] [Google Scholar]
- Frischknecht, U., Hirschi, R., & Thielemann, F.-K. 2012, A&A, 538, L2 [NASA ADS] [CrossRef] [EDP Sciences] [Google Scholar]
- Greggio, L. 2005, A&A, 441, 1055 [NASA ADS] [CrossRef] [EDP Sciences] [Google Scholar]
- Hayek, W., Wiesendahl, U., Christlieb, N., et al. 2009, A&A, 504, 511 [NASA ADS] [CrossRef] [EDP Sciences] [Google Scholar]
- Honda, S., Aoki, W., Kajino, T., et al. 2004, ApJ, 607, 474 [NASA ADS] [CrossRef] [Google Scholar]
- Hotokezaka, K., Kiuchi, K., Kyutoku, K., et al. 2013, Phys. Rev. D, 88, 044026 [NASA ADS] [CrossRef] [Google Scholar]
- Ishimaru, Y., & Wanajo, S. 1999, ApJ, 511, L33 [NASA ADS] [CrossRef] [Google Scholar]
- Ivans, I. I., Sneden, C., James, C. R., et al. 2003, ApJ, 592, 906 [NASA ADS] [CrossRef] [Google Scholar]
- Ivans, I. I., Simmerer, J., Sneden, C., et al. 2006, ApJ, 645, 613 [NASA ADS] [CrossRef] [Google Scholar]
- Kalogera, V., Narayan, R., Spergel, D. N., & Taylor, J. H. 2001, ApJ, 556, 340 [NASA ADS] [CrossRef] [Google Scholar]
- Käppeler, F., Gallino, R., Bisterzo, S., & Aoki, W. 2011, Rev. Mod. Phys., 83, 157 [NASA ADS] [CrossRef] [EDP Sciences] [Google Scholar]
- Korobkin, O., Rosswog, S., Arcones, A., & Winteler, C. 2012, MNRAS, 426, 1940 [NASA ADS] [CrossRef] [Google Scholar]
- Kyutoku, K., Ioka, K., & Shibata, M. 2013, Phys. Rev. D, 88, 041503 [NASA ADS] [CrossRef] [Google Scholar]
- Lai, D. K., Johnson, J. A., Bolte, M., & Lucatello, S. 2007, ApJ, 667, 1185 [NASA ADS] [CrossRef] [Google Scholar]
- Lai, D. K., Bolte, M., Johnson, J. A., et al. 2008, ApJ, 681, 1524 [NASA ADS] [CrossRef] [Google Scholar]
- Li, H. N., Christlieb, N., Schörck, T., et al. 2010, A&A, 521, A10 [NASA ADS] [CrossRef] [EDP Sciences] [Google Scholar]
- Maeder, A., & Meynet, G. 1989, A&A, 210, 155 [NASA ADS] [Google Scholar]
- Maeder, A., Meynet, G., & Chiappini, C. 2015, A&A, 576, A56 [NASA ADS] [CrossRef] [EDP Sciences] [Google Scholar]
- Masseron, T., van Eck, S., Famaey, B., et al. 2006, A&A, 455, 1059 [NASA ADS] [CrossRef] [EDP Sciences] [Google Scholar]
- Masseron, T., Johnson, J. A., Plez, B., et al. 2010, A&A, 509, A93 [NASA ADS] [CrossRef] [EDP Sciences] [Google Scholar]
- Matteucci, F., Romano, D., Arcones, A., Korobkin, O., & Rosswog, S. 2014, MNRAS, 438, 2177 [NASA ADS] [CrossRef] [Google Scholar]
- McWilliam, A. 1998, AJ, 115, 1640 [NASA ADS] [CrossRef] [Google Scholar]
- McWilliam, A., Preston, G. W., Sneden, C., & Searle, L. 1995, AJ, 109, 2757 [NASA ADS] [CrossRef] [Google Scholar]
- Mennekens, N., & Vanbeveren, D. 2014, A&A, 564, A134 [NASA ADS] [CrossRef] [EDP Sciences] [Google Scholar]
- Nakar, E., Gal-Yam, A., & Fox, D. B. 2006, ApJ, 650, 281 [NASA ADS] [CrossRef] [Google Scholar]
- Nishimura, N., Takiwaki, T., & Thielemann, F.-K. 2015, ApJ, submitted [arXiv:1501.06567] [Google Scholar]
- Oechslin, R., Janka, H.-T., & Marek, A. 2007, A&A, 467, 395 [NASA ADS] [CrossRef] [EDP Sciences] [Google Scholar]
- Pignatari, M., Gallino, R., Meynet, G., et al. 2008, ApJ, 687, L95 [NASA ADS] [CrossRef] [Google Scholar]
- Piran, T., & Shaviv, N. J. 2005, Phys. Rev. Lett., 94, 051102 [NASA ADS] [CrossRef] [Google Scholar]
- Preston, G. W., Sneden, C., Thompson, I. B., Shectman, S. A., & Burley, G. S. 2006, AJ, 132, 85 [NASA ADS] [CrossRef] [Google Scholar]
- Roederer, I. U., Frebel, A., Shetrone, M. D., et al. 2008, ApJ, 679, 1549 [NASA ADS] [CrossRef] [Google Scholar]
- Roederer, I. U., Cowan, J. J., Preston, G. W., et al. 2014, MNRAS, 445, 2970 [NASA ADS] [CrossRef] [Google Scholar]
- Romano, D., Karakas, A. I., Tosi, M., & Matteucci, F. 2010, A&A, 522, A32 [NASA ADS] [CrossRef] [EDP Sciences] [Google Scholar]
- Rosswog, S. 2013, Roy. Soc. Lond. Philosoph. Trans. Ser. A, 371, 20272 [Google Scholar]
- Rosswog, S., Liebendörfer, M., Thielemann, F.-K., et al. 1999, A&A, 341, 499 [NASA ADS] [Google Scholar]
- Rosswog, S., Davies, M. B., Thielemann, F.-K., & Piran, T. 2000, A&A, 360, 171 [NASA ADS] [Google Scholar]
- Scalo, J. M. 1986, Fund. Cosmic Phys., 11, 1 [NASA ADS] [EDP Sciences] [Google Scholar]
- Shen, S., Cooke, R., Ramirez-Ruiz, E., et al. 2014, ApJ, accepted [arXiv:1407.3796] [Google Scholar]
- Simmerer, J., Sneden, C., Cowan, J. J., et al. 2004, ApJ, 617, 1091 [NASA ADS] [CrossRef] [Google Scholar]
- Sneden, C., Cowan, J. J., & Gallino, R. 2008, ARA&A, 46, 241 [NASA ADS] [CrossRef] [EDP Sciences] [Google Scholar]
- Thielemann, F.-K., Arcones, A., Käppeli, R., et al. 2011, Prog. Part. Nucl. Phys., 66, 346 [NASA ADS] [CrossRef] [Google Scholar]
- Thornton, K., Gaudlitz, M., Janka, H.-T., & Steinmetz, M. 1998, ApJ, 500, 95 [NASA ADS] [CrossRef] [Google Scholar]
- Travaglio, C., Galli, D., Gallino, R., et al. 1999, ApJ, 521, 691 [NASA ADS] [CrossRef] [Google Scholar]
- Travaglio, C., Gallino, R., Arnone, E., et al. 2004, ApJ, 601, 864 [NASA ADS] [CrossRef] [Google Scholar]
- Truran, J. W. 1981, A&A, 97, 391 [NASA ADS] [Google Scholar]
- van de Voort, F., Quataert, E., Hopkins, P. F., Kereš, D., & Faucher-Giguère, C.-A. 2015, MNRAS, 447, 140 [NASA ADS] [CrossRef] [Google Scholar]
- Wallerstein, G., Kovtyukh, V. V., & Andrievsky, S. M. 2007, AJ, 133, 1373 [NASA ADS] [CrossRef] [Google Scholar]
- Wanajo, S., Kajino, T., Mathews, G. J., & Otsuki, K. 2001, ApJ, 554, 578 [NASA ADS] [CrossRef] [Google Scholar]
- Wanajo, S., Janka, H.-T., & Müller, B. 2011, ApJ, 726, L15 [NASA ADS] [CrossRef] [Google Scholar]
- Westin, J., Sneden, C., Gustafsson, B., & Cowan, J. J. 2000, ApJ, 530, 783 [NASA ADS] [CrossRef] [Google Scholar]
- Winteler, C., Käppeli, R., Perego, A., et al. 2012, ApJ, 750, L22 [NASA ADS] [CrossRef] [Google Scholar]
- Woosley, S. E., Wilson, J. R., Mathews, G. J., Hoffman, R. D., & Meyer, B. S. 1994, ApJ, 433, 229 [NASA ADS] [CrossRef] [Google Scholar]
- Yong, D., Aoki, W., Lambert, D. L., & Paulson, D. B. 2006, ApJ, 639, 918 [NASA ADS] [CrossRef] [Google Scholar]
- Yong, D., Lambert, D. L., Paulson, D. B., & Carney, B. W. 2008, ApJ, 673, 854 [NASA ADS] [CrossRef] [Google Scholar]
- Yong, D., Alves Brito, A., DaCosta, G. S., et al. 2014, MNRAS, 439, 2638 [NASA ADS] [CrossRef] [Google Scholar]
- Yoon, S.-C., Langer, N., & Norman, C. 2006, A&A, 460, 199 [NASA ADS] [CrossRef] [EDP Sciences] [Google Scholar]
All Tables
All Figures
|
Fig. 1 Left panel: results for [Eu/Fe] vs. [Fe/H] for model NS00. This model has a delay time for the NSMs of 1 Myr, constant Eu production of 5 × 10⁻⁶ M⊙ per merging event, and no Eu from SNeII. The density plot is the distribution of simulated long-living stars for our model (see the bar below the figure for the colour scale). The long-living stars formed without Eu (formally [Eu/Fe] = −∞) are shown at [Eu/Fe] = −2.4. The model predictions are compared to data collected in Frebel (2010a); we show as black dots stars with [C/Fe] < 0.9 (to avoid binary enrichment), the open dots are stars with no carbon measurement. Central panel: same as left panel, but for model NS01. This model has a delay time for the NSMs of 10 Myr, constant Eu production of 5 × 10⁻⁶ M⊙ per merging event, and no Eu from SNeII. Right panel: again same as for the left panel, but for model NS02. This model has a delay time for the NSMs of 100 Myr, constant Eu production of 5 × 10⁻⁶ M⊙ per merging event, and no Eu from SNeII. |
| In the text | |
|
Fig. 2 Left panel: same as Fig. 1, but for model NS03. This model has a delay time for the NSMs of 1 Myr, variable Eu yield per merging event (average value 5 × 10⁻⁶ M⊙), and no Eu from SNeII. Central panel, same as left panel, but for model NS04. This model has a delay time for the NSMs of 1 Myr, variable Eu yield per merging event (average value 2.5 × 10⁻⁶ M⊙), and no Eu from SNeII. In this model, the fraction of massive stars leading to NS merging events is twice what is assumed in previous models. Right panel: same as left panel, but we present here a model similar to model NS03 in which we consider a mass range for neutron stars progenitors of the NSM of 9–50 M⊙ instead of 9–30 M⊙. |
| In the text | |
|
Fig. 3 Left panel: same as Fig. 1, but for model NS+SN. The prescriptions about Eu nucleosynthesis for model NS+SN are similar to those of model Mod2SNNS by Matteucci et al. (2014) , but it allows for inhomogeneous mixing in the early Galaxy. Right panel: same as left panel but for model NS+MRD. In this model we consider the production of Eu by NSMs with a delay of 100 Myr and also a production by MRD SN (10% of all SNe II) but only for Z< 10-3. |
| In the text | |
|
Fig. 4 From the left [Sr/Ba], [Zr/Ba] and [Rb/Ba] vs. [Fe/H] in the halo; the density plot is the distribution of simulated long-living stars for our models. Superimposed, we show the abundance ratios for halo stars (data from Frebel 2010a). The symbols for the Frebel (2010a) data are black dots for normal stars, and black open circles for stars without carbon measurement. |
| In the text | |
|
Fig. 5 Ratio of Eu-free stars over the total number of stars for bins of 0.5 dex in [Fe/H]. The model results are displayed with a black dashed line (model NS04), red solid line (model NS+MRD), and blue dotted line (model NS+SN). The red squares are the observational proxy for this ratio, so the ratio between stars in which Eu only presents an upper limit over the number of stars for which at least Ba has been measured. The error bars are only plotted to show the dimension of each bin in [Fe/H]. |
| In the text | |
Current usage metrics show cumulative count of Article Views (full-text article views including HTML views, PDF and ePub downloads, according to the available data) and Abstracts Views on Vision4Press platform.
Data correspond to usage on the plateform after 2015. The current usage metrics is available 48-96 hours after online publication and is updated daily on week days.
Initial download of the metrics may take a while.