Fig. 1
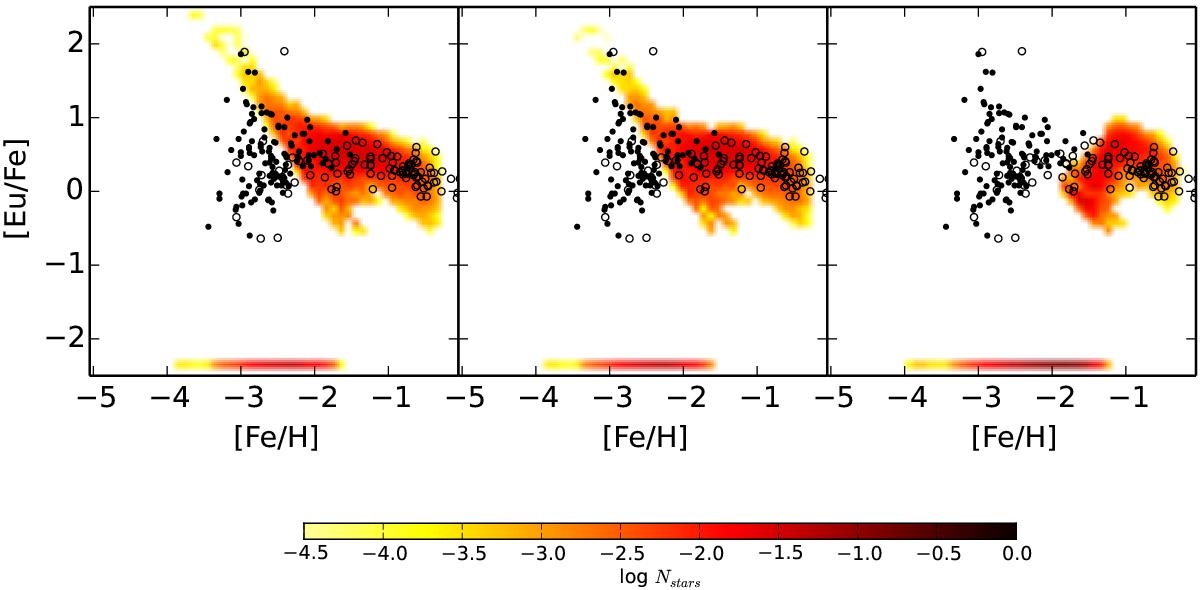
Left panel: results for [Eu/Fe] vs. [Fe/H] for model NS00. This model has a delay time for the NSMs of 1 Myr, constant Eu production of 5 × 10⁻⁶ M⊙ per merging event, and no Eu from SNeII. The density plot is the distribution of simulated long-living stars for our model (see the bar below the figure for the colour scale). The long-living stars formed without Eu (formally [Eu/Fe] = −∞) are shown at [Eu/Fe] = −2.4. The model predictions are compared to data collected in Frebel (2010a); we show as black dots stars with [C/Fe] < 0.9 (to avoid binary enrichment), the open dots are stars with no carbon measurement. Central panel: same as left panel, but for model NS01. This model has a delay time for the NSMs of 10 Myr, constant Eu production of 5 × 10⁻⁶ M⊙ per merging event, and no Eu from SNeII. Right panel: again same as for the left panel, but for model NS02. This model has a delay time for the NSMs of 100 Myr, constant Eu production of 5 × 10⁻⁶ M⊙ per merging event, and no Eu from SNeII.
Current usage metrics show cumulative count of Article Views (full-text article views including HTML views, PDF and ePub downloads, according to the available data) and Abstracts Views on Vision4Press platform.
Data correspond to usage on the plateform after 2015. The current usage metrics is available 48-96 hours after online publication and is updated daily on week days.
Initial download of the metrics may take a while.