| Issue |
A&A
Volume 576, April 2015
|
|
|---|---|---|
| Article Number | A55 | |
| Number of page(s) | 10 | |
| Section | The Sun | |
| DOI | https://doi.org/10.1051/0004-6361/201425139 | |
| Published online | 27 March 2015 | |
Composition of inner-source heavy pickup ions at 1 AU: SOHO/CELIAS/CTOF observations
Implications for the production mechanisms
Institut für Experimentelle und Angewandte Physik,
Christian-Albrechts-Universität zu Kiel,
24098
Kiel,
Germany
e-mail:
This email address is being protected from spambots. You need JavaScript enabled to view it.
Received: 10 October 2014
Accepted: 22 January 2015
Abstract
Context. Pickup ions in the inner heliosphere mainly originate in two sources, one interstellar and one in the inner solar system. In contrast to the interstellar source that is comparatively well understood, the nature of the inner source has not been clearly identified. Former results obtained with the Solar Wind Ion Composition Spectrometer on-board the Ulysses spacecraft revealed that the composition of inner-source pickup ions is similar, but not equal, to the elemental solar-wind composition. These observations suffered from very low counting statistics of roughly one C+ count per day.
Aims. Because the composition of inner-source pickup ions could lead to identifying their origin, we used data from the Charge-Time-Of-Flight sensor on-board the Solar and Heliospheric Observatory. It offers a large geometry factor that results in about 100 C+ counts per day combined with an excellent mass-per-charge resolution. These features enable a precise determination of the inner-source heavy pickup ion composition at 1 AU. To address the production mechanisms of inner-source pickup ions, we set up a toy model based on the production scenario involving the passage of solar-wind ions through thin dust grains to explain the observed deviations of the inner-source PUI and the elemental solar-wind composition.
Methods. An in-flight calibration of the sensor allows identification of heavy pickup ions from pulse height analysis data by their mass-per-charge. A statistical analysis was performed to derive the inner-source heavy pickup ion relative abundances of N+, O+, Ne+, Mg+, Mg2+, and Si+ compared to C+.
Results. Our results for the inner-source pickup ion composition are in good agreement with previous studies and confirm the deviations from the solar-wind composition. The large geometry factor of the Charge-Time-of-Flight sensor even allowed the abundance ratios of the two most prominent pickup ions, C+ and O+, to be investigated at varying solar-wind speeds. We found that the O+/C+ ratio increases systematically with higher solar-wind speeds. This observation is an unprecedented feature characterising the production of inner-source pickup ions. Comparing our observations to the toy model results, we find that both the deviation from the solar-wind composition and the solar-wind-speed dependent O+/C+ ratio can be explained.
Key words: solar wind / Sun: heliosphere / Sun: abundances
© ESO, 2015
1. Context and aims
Pickup ions (PUIs) are former neutrals in the heliosphere that get ionised either by solar extreme ultra-violet radiation, charge exchange with solar-wind protons, or electron impact. The neutral atoms might originate in the interstellar medium or in a source in the inner heliosphere that is presently not completely understood.
Interstellar PUIs were first observed in situ by Möbius et al. (1985). These ions are created from neutrals in the interstellar wind that can penetrate deeply into the heliosphere. Owing to gravitational focusing of their trajectories, a region of enhanced interstellar PUI density evolves on the downwind side of the Sun, which is called the focusing cone (Möbius et al. 1985; Drews et al. 2010). On the upwind side of the Sun, a comparable region called the crescent evolves that is a consequence of a geometric effect combined with ionisation probabilities (Drews et al. 2012). Owing to the very low speeds of the interstellar neutrals compared to the solar-wind speed, the pickup process manifests itself in a highly suprathermal, characteristic velocity distribution function (VDF).
In contrast to the PUIs created from interstellar neutrals, inner-source PUIs show a VDF that has the shape of a thermal distribution with the maximum located approximately at the solar-wind bulk speed (Geiss et al. 1995). The established interpretation for this is that these ions are produced very close to the Sun between 10–50 R⊙ (Schwadron et al. 2000), thermalise with the solar wind, and cool adiabatically like an ideal gas due to the spatial expansion. These inner-source PUIs were studied predominantly with the Solar Wind Ion Composition Spectrometer (SWICS) on-board Ulysses, which revealed further characteristics: The source seems to be distributed randomly in space and time (Geiss et al. 1996), is stable over the solar cycle (Allegrini et al. 2005), and has a production rate of ~106 g s-1 (Geiss et al. 1996). Furthermore, the inner-source PUI composition resembles the solar-wind composition (Gloeckler et al. 2000) and the inner-source PUI flux of one element is correlated with the solar-wind ion flux of this element, which is shown in the companion paper by Berger et al. (2015). Especially the last findings point towards an ion production somehow related to the solar wind.
Overall, four possible production scenarios have been proposed (Bzowski & Królikowska 2004; Schwadron et al. 2000; Wimmer-Schweingruber & Bochsler 2003; Mann & Czechowski 2005) that have been checked for their compatibility with the observed characteristics (Allegrini et al. 2005). None of the proposed scenarios could conclusively explain all observations, but the two scenarios involving the interaction of dust grains with the solar wind (Schwadron et al. 2000; Wimmer-Schweingruber & Bochsler 2003) remain the most promising. Schwadron et al. (2000) and Geiss et al. (1995) posit that μm-sized interplanetary dust grains are immersed in the solar wind and that solar-wind ions are implanted in the surface of these grains. The former ions can then be re-emitted as atoms or molecules, for example by sputtering of the surface or thermal release. The weaknesses of this scenario are that it fails to reproduce the rather high inner-source PUI flux (Allegrini et al. 2005) and that one would expect much more sputtered grain material in the composition (Wimmer-Schweingruber & Bochsler 2003). Wimmer-Schweingruber & Bochsler (2003) propose a different neutral particle production mechanism involving solar-wind ions passing through nm-sized dust grains. During the passage they lose a part to all of their charge and exit the dust grain as neutrals or low-charged ions. However, this scenario predicts differences in the inner-source PUI flux in solar minimum and maximum, because nm-sized dust grains are supposed to get trapped in coronal mass ejections (Allegrini et al. 2005). Since there are still uncertainties in both the observed characteristics and the implications of the proposed scenarios, inner-source PUIs merit more detailed investigation.
PUIs with masses heavier than helium, which we call heavy PUIs, are very rare compared to ordinary heavy ion abundances in the solar wind. Previous heavy PUI studies, performed with the SWICS instrument on-board Ulysses, had to deal with very low counting statistics of roughly one C+ count per day (cf. Geiss et al. 1996), which could be compensated for to some extent by its long operation time. The Charge-Time-Of-Flight sensor (CTOF) of the Charge-ELement-and-Isotope Analysis System (CELIAS) on-board the SOlar and Heliospheric Observatory (SOHO) spacecraft at L1 combines a high mass-per-charge resolution with a large geometry factor. From this data we derived the inner-source heavy PUI composition and compared it to the composition one would expect from the production scenario proposed by Wimmer-Schweingruber & Bochsler (2003). Thanks to CTOF’s high counting statistics it was also possible to investigate the measured O+/C+ ratio with respect to varying solar-wind speeds.
2. Methods
CTOF combines the measurement of energy-per-charge, time-of-flight, and residual energy to derive an ion’s mass, charge, and energy. The detailed principle of ion detection is described in Hovestadt et al. (1995). For our study the raw pulse-height analysis (PHA) words have been used as they contain the whole measurement information.
The energy-per-charge, E/Q, and time-of-flight, τ, measurements are sufficient to determine the mass-per-charge, M/Q, and velocity, vion, of an ion. The M/Q information alone is sufficient to identify heavy PUIs and to distinguish them from solar-wind ions. The M/Q range of these single- or low-charged ions (M/Q ≥ 12 amu e-1) is far above the M/Q range of ordinary solar-wind ions (for example M/Q(Fe7+) = 8 amu e-1). Furthermore, because of their small charge, heavy PUIs rarely have enough energy to trigger the solid-state detector that is needed to determine their mass. In contrast, heavy solar-wind ions, such as iron with their higher charges, almost always lead to an energy measurement. To suppress background counts caused by heavy solar-wind ions, we constrained our analysis to data where no energy signal was measured.
To determine the M/Q from the raw pulse-height analysis data, we performed an in-flight calibration of the CTOF sensor (Taut 2014). The time-of-flight positions of the He+, He2+, O6+, Fe10+, and Fe11+ peaks at given E/Q values were compared to theoretical values based on a physical model of the sensor. A conversion function from E/Q and τ to M/Q values was derived from this. This resulting function is based on the energy loss, ΔE, of C+ in CTOF’s carbon foil. This means that the peak of C+ appears at M/Q = 12 amu e-1, while other peaks may appear shifted with regard to their nominal M/Q, for example O+ at M/Q = 16.2 amu e-1. The PUI species-dependent energy loss even allows distinguishing between PUIs with the same M/Q. At the same E/Q value, Mg2+ loses significantly less energy per mass than C+ while passing the carbon foil. Thus it is shifted towards a peak position of M/Q ≈ 10.7 amu e-1.
2.1. Time period
We used PHA data from March 22 until August 17, 1996 when CTOF ceased nominal operation. A post-acceleration voltage increase on May 25 is considered in the in-flight calibration. On June 13, 1996 CTOF measured O+ ions originating in Venus’ atmosphere (Grünwaldt et al. 1997). We removed this time period from the present analysis because this work focuses on ordinary inner-source PUIs. We therefore analysed all available data from March 22 until August 17, 1996 with the only exclusion being June 13, 1996.
2.2. General approach
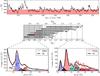 |
Fig. 1 Illustration of the analysis technique used to obtain the abundance ratios of the different pickup ion species. Top panel: time series of the solar-wind speed in the considered time period measured with the CELIAS/PM. The solar-wind speeds in the area shaded red correspond to about 65% of the considered time period. These data were used in our analysis. Middle panel: wi-coverage for 0.8 ≤ wi< 1.2 for each heavy PUI in terms of wC+. The dashed lines correspond to the wC+ bins for which counts were determined. The shaded area on the left-hand side of the plot shows the range where wHe+ ≤ 2, so we thus expect an enhanced background due to interstellar He+. Two example bins have been picked to show the fit of the corresponding M/Q histograms. Lower left panel: 0.9 ≤ wC+< 1 bin. One can see a significant amount of background counts that have been taken into account in the fit with a power-law distribution. This bin contributes to the total counts of C+, N+, Mg2+, and partly to O+ (highlighted in the middle panel). Lower right panel: corresponds to the 1.7 ≤ wC+< 1.8 bin. At energies this high, no background counts are observed and the distributions of Mg+, Al+/Fe2+, and Si+ are more pronounced. Only the counts of Si+ contribute to 0.8 ≤ wSi+< 1.2. |
PUIs of interstellar and inner-source origins have quite different VDFs. We use w = vion/vsw as the ordering parameter, where vion is the speed of an individual ion and vsw is the solar-wind bulk speed as determined by the SOHO/CELIAS Proton Monitor (PM). Observations revealed that the inner-source PUI contribution dominates the interstellar contribution at w< 1.2 (Berger et al. 2013). To determine the inner-source heavy PUI composition, we therefore derived the relative abundances of N+, O+, Ne+, Mg+, Mg2+, and Si+ compared to C+ between w = 0.8 and w = 1.2.
The upper limit of w = 1.2 sets a boundary to the usable solar-wind speeds due to the E/Q coverage of the sensor. The maximum speed of Si+ that can be measured is vmax(Si+) = 487 km s-1, which results in a maximum solar-wind speed of vsw,max = 406 km s-1 to guarantee that the instrument covers the whole w-range equally for all ions.
Owing to the stochastic nature of the energy loss in the carbon foil, the measured M/Q of heavy PUIs is smeared out. The time-of-flight (and therefore the M/Q) distribution of a single ion species (e.g., O+) is clearly peaked but has a certain width. Thus ions whose time-of-flight peaks in the immediate neighbourhood (e.g., C+) contaminate the original distribution. This makes it impossible to uniquely identify an individual time-of-flight measurement as due to a certain ion, and the species assignment needs to be done in a statistical manner.
Because we only want to compare the abundance ratios in the 0.8 ≤ w< 1.2 range and w cannot be derived from E/Q information without the species assignment, we ordered the counts by the nominal w for C+ denoted as wC+. This means that we calculated the w of a count as if it was C+ regardless of its measured M/Q value. The nominal wC+ can easily be converted into the wi of other ions. For example, wC+ = 1 corresponds to wN+ = 0.93 and wO+ = 0.87. In the upper left-hand panel of Fig. 1, the range 0.8 ≤ wi< 1.2 is plotted in terms of wC+ for every considered heavy PUI species. One can see that 0.8 ≤ wC+< 1.9 includes 0.8 ≤ wi< 1.2 for all heavy PUIs up to Si+.
The counts have been ordered into bins with widths of ΔwC+ = 0.1. From all counts accumulated in this fashion, M/Q histograms are created and fitted using the fit function described in Sect. 2.5. The fit provides the optimised M/Q distribution for each considered heavy PUI that is integrated over M/Q to yield the count rate. This is shown for two example wC+ bins in the lower panels of Fig. 1. The relative abundance is then accumulated from all wC+ bins that cover 0.8 ≤ wi< 1.2 for the corresponding ions taking detection efficiencies into account. This is indicated by the color code in the upper left-hand panel of Fig. 1. For example, the 0.9 ≤ wC+< 1. bin contributes to the relative abundance of C+, N+, and partly to O+. The bins that only cover a part of the 0.8 ≤ wi< 1.2 range are taken into account for the relative abundance with a weighting in correspondence to their bin coverage. The detection efficiencies are derived from measured efficiencies for He, C, N, and O (Hefti 1997) and extrapolated for the heavier ions.
2.3. Background model
Because of their low count rates, PUIs are affected by a time-of-flight background, which is due to the much more abundant interstellar He+ and heavy solar-wind ions. Background counts in the M/Q range of heavy PUIs may have been produced by the following two effects. On the one hand, the tails of the time-of-flight distributions of interstellar He+ and solar-wind iron ions reach into the time-of-flight range of heavy PUIs. The background caused by the solar-wind iron is partially suppressed by using only events for which the residual energy is below threshold, i.e., registered as zero energy. The single tails can be described with a κ-distribution (lower part of Eq. (1)).
On the other hand, background counts may occur due to random time-of-flight coincidences. The large collection area of CTOF also means that many ions enter CTOF in a given E/Q step. Since there is a limited probability that an ion triggers a start or a stop signal for the τ measurement, it is possible that the start and stop signals of a single τ measurement are triggered by two different ions. This results in a random M/Q measurement. For the combination wi ≈ 1 and high M/Q values, the first effect is more important.
Background counts are negligible at wC+ ≥ 1.3. The boundary of wC+ = 1.3 corresponds to wHe+ = 2.25 or wFe7 + = 1.59, for instance. He+ has a very broad VDF that extends up to wHe+ ≈ 2 due to its mainly interstellar origin, which is also shown in the upper left-hand panel of Fig. 1. Because CTOF measured on the upwind side of the Sun with respect to the interstellar wind, the w-distribution of interstellar He+ is even smeared out to higher w values. The VDF of heavy solar-wind ions has its maximum approximately at the solar-wind bulk speed, and it has a comparatively small width. Thus at wC+ ≥ 1.3, no background counts are expected. Between 1.0 ≤ wC+< 1.3, only He+ counts that reach into the M/Q range of the heavy PUIs have to be considered. Thus, it is sufficient to fit a κ-tail (see Eq. (1)) to the right-hand side of the He+ peak to account for the background. At wC+< 1.0, a complex background is observed that consists of multiple ion species that cannot be resolved individually. In this case, a power-law distribution is a good approximation for the shape of the background counts.
2.4. Peak shape model
In the M/Q histograms, the heavy PUI peaks overlap each other owing to their large widths. As a result, only the C+ and the O+ peaks are clearly resolvable by eye (cf. lower panels of Fig. 1). To perform a precise statistical assignment of the counts, it is necessary to know the shapes of the single peaks.
The variable amount of energy lost by ions in the carbon foil results in a characteristic distribution, f(M/Q), in the M/Q histograms. For a given ion species, the M/Q distribution can be described with a Gaussian-κ-function represented by the following equation: 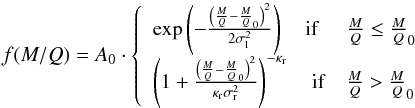 (1)with the peak height A0, the peak position M/Q0, the peak widths σl and σr on the left- and right-hand sides of the peak, respectively, and the parameter κr that describes the tail on the right-hand side of the distribution. All parameters depend on the ion species.
Because the variable energy loss is also the dominant process shaping the heavy PUI peaks, we simulate the passage of ions through the foil with the Tracking and Range of Ions in Matter (TRIM) software developed by Ziegler et al. (2010). A τ distribution of the ions can be deduced from these simulations that can be converted into an M/Q distribution using the conversion from the in-flight calibration. The actual ion peak shapes as measured by CTOF are estimated from this M/Q distribution.
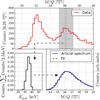 |
Fig. 2 Illustration of the estimation of the shape parameters for O+. The upper panel shows an M/Q histogram for 1.2 ≤ wC+< 1.3. From the peak’s counts (a box with M/Q0 ± 1 amu e-1), a histogram of the energy of the ions when hitting the carbon foil is created (lower left panel). TRIM simulations corresponding to the energy bins are obtained. An artificial M/Q histogram is created from the transmitted energy and angular scattering information (lower right panel). A fit to this histogram yields estimated parameters for the real peak. |
The procedure for determining the ion peak shapes is illustrated in Fig. 2 for the example of O+ for the energy range of 1.2 ≤ wC+< 1.3. In the upper panel the corresponding M/Q histogram is shown. The expected position M/Q0(O+) of the O+ peak can be calculated from the difference in the energy loss compared to C+ and is shown by a dashed grey line. The shape of the M/Q distribution depends on the ion’s energy after post-acceleration. This energy is smeared out because of multiple E/Q steps that contribute counts to the considered w range. We assume that in a box with 16.2 ± 1 amu e-1 predominantly O+ occurs. From the measured E/Q and the post-acceleration voltage, the energy distribution with which the ions hit the foil is estimated, which is shown in the lower left-hand panel. For each occurring energy, TRIM simulations with sufficient statistics were performed to determine the M/Q distribution of O+. These distributions are weighted with the number of counts in the corresponding energy bin and summed up. The resulting artificial M/Q distribution is fitted with Eq. (1), which yields estimates for the shape parameters σl, σr, and κr. This procedure is performed for the data from every w-bin described in Sect. 2.2.
Peak shape parameter ratios with respect to the C+ peak derived with data from 270 km s-1 ≤ vsw ≤ 406 km s-1 and ΔwC+ = 0.1.
It was found that the ratios of the peak width parameters, σl and σr, between the different ion species stay constant to a large extent. Furthermore, the κr values were found to be fairly constant in the considered energy range. We did not take the absolute, but instead the relative values from the TRIM simulations, because we expect that the energy loss and angular scattering in the foil is the dominant reason for the asymmetry of the peak shapes, but other instrumental effects, such as electronic noise or non-ideal focusing of the trajectories, have been neglected. Thus only the σl and σr ratios between two different peaks and the κr value were kept constant during the fit of the M/Q histograms. The corresponding values are given in Table 1.
2.5. Fit function
The fit function must include distributions for all ions that occur in the M/Q range of the considered heavy PUIs and the background model. Next to the seven heavy PUIs for which we want to compare the abundances, the isotopes of Ne and Mg and contributions of Al+ and Fe2+ are taken into account. Furthermore, the M/Q distribution of N+ probably contains counts of Si2+ that will be addressed in Sect. 3 in more detail. There are other ion species that lie inside the considered M/Q range, but the abundances of these ions are negligible compared to the considered ion species (Bochsler 2007).
The PUI isotopes 22Ne+, 25Mg+, and 26Mg+ are included in the fit as distributions with the shape parameters σl, σr, and κr of 20Ne+ or 24Mg+, respectively, and the fixed abundances (Wiens et al. 2004): 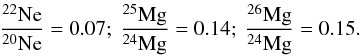 The neutral particles that serve as the source population for inner-source PUIs are most probably created from solar-wind ions or interplanetary dust grains. Since both solar-wind ions and interplanetary dust grains have the same isotopic composition (Wimmer-Schweingruber et al. 1998), the isotopic composition of PUIs is also expected to be the same. In the M/Q histogram shown in the lower right-hand panel of Fig. 1, one can see a very flat decrease in the counts beyond the Mg+ peak, which is due to the Mg isotopes. In Sect. 3 the relative PUI abundances are compared to elemental solar-wind abundances. Therefore, the Ne+ and the Mg+ abundance ratios will include the abundances of all their isotopes.
Since the contributions of both Al+ and Fe2+ peak at M/Q ≈ 27.5 amu e-1, it is impossible to resolve these ion species separately. Nevertheless, we have to avoid counts of Al+ or Fe2+ being falsely attributed to Mg+ or Si+. Therefore one single distribution representing both ion species is taken into account in the fit function. Of course, no distinct relations for σl, σr, and κr following the procedure described in Sect. 2.4 and no detection efficiency can be deduced for this mixed species peak. Because of the latter, no abundance for these ion species could be determined. For the peak shape parameters σl, σr, and κr, the mean of the shape parameters of Mg+ and Si+ was chosen.
Overall, the fit function F(M/Q) is the sum of 11 Gaussian-κ-functions (Eq. (1)) and the background model (Sect. 2.3): 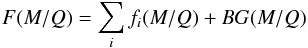 (2)with
  (3)and
 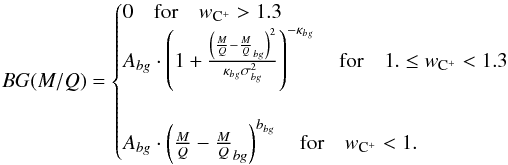 (4)
(4)
2.6. Fit results
Every ion distribution in the fit function has five parameters: A0, M/Q0, σl, σr, and κr. The fit function contains 11 different ion distributions in all and the background model that results in 55 to 59 parameters, depending on the background type.
Results from the derivation of the inner-source PUI composition measured with SOHO/CELIAS/CTOF at 1 AU compared to the studies of Gloeckler et al. (2000) and Allegrini et al. (2005).
The peak position M/Q0 is determined by comparing the energy loss and angular scattering in CTOF’s carbon foil of the considered ion and C+. The κr parameters are assumed to be constant. For σl and σr, relations for every ion species with respect to C+ were derived, which means that one parameter for σl and one for σr are sufficient to describe all peak widths. The ranges for M/Q0, the σl and σr relations, and the κr values are given in Table 1. Thus, the remaining free parameters for the fit of the M/Q histograms are eight peak heights A0, the peak widths of C+, σl(C+) and σr(C+), and the parameters of the background model. This gives a total of 10 to 14 free parameters.
The widths of the M/Q distributions primarily depend on the energy the ions have when hitting CTOF’s carbon foil. It is known from TRIM simulations that at lower impact energies, the peak widths increase. A linear relation for σl(C+) and σr(C+) depending on the mean energy of the ions before hitting the foil was derived to consistently include this in the fit. Finally, only the eight peak heights A0 and, if necessary, three or four parameters of the background model are fitted to the data. The optimisation is performed using the Nelder-Mead method and a maximum-likelihood estimator based on Poisson statistics. Afterwards, the counts are corrected for instrumental detection efficiencies. The resulting inner-source PUI composition at 1 AU is displayed in Table 2. The abundances were normalised to the abundance of C+, because it offers the highest counting statistics and is expected to originate solely in the inner source.
2.6.1. Variable solar-wind speeds
Gloeckler et al. (2000) and Allegrini et al. (2005) have found significantly different inner-source O+/C+ abundance ratios (see Table 2). The reason for this could be that the O+/C+ ratio shows a systematic increase with solar-wind speed. To address this issue, we focused our investigation on the O+/C+ abundance ratio.
To compare the abundances of all heavy PUIs up to Si+ in the previous section, we had to restrict our analysis to solar-wind speeds below 406 km s-1 owing to the M/Q-dependent velocity coverage of CTOF. For O+ the maximum velocity that CTOF can measure is vmax(O+) = 645 km s-1. Thus, considering only C+ and O+, the solar-wind speed range in which the sensor covers 0.8 ≤ w< 1.2 equally for both ions extends up to 537 km s-1. Furthermore, C+ and O+ are resolved well because they are the most abundant heavy PUIs. This means that these two ion species provide excellent comparability.
Using the CTOF data, we investigated the inner-source O+/C+ abundance ratio at different solar-wind speeds. For this, we sorted the PUI counts in vsw bins from 270 km s-1 ≤ vsw ≤ 537 km s-1. We repeated the analysis to the data accumulated in these solar-wind bins. The results are shown in Table 3. A clear dependency of the O+/C+ ratio on the solar-wind speed can be seen. The ratio increases systematically with solar-wind speed. This dependence of the heavy PUI composition on solar-wind speed is a newly observed feature of inner-source heavy PUIs, and it has to be checked for its compatibility with the proposed production scenarios. Furthermore, it explains the deviation of the ratios derived by Gloeckler et al. (2000) and Allegrini et al. (2005). A scenario consistent with this newly found characteristic must predict differences in the production rates of O+ and C+ that depend on the solar-wind speed.
Abundance ratios of O+/C+ for 0.8 ≤ w< 1.2 at varying solar-wind speeds.
2.7. Error estimation
The errors given in Tables 2 and 3 are the pure counting errors that result from Poisson statistics. They were calculated by applying the procedure above 100 times using histograms with random Poisson noise added and random M/Q bin widths between 0.2 amu e-1 and 0.5 amu e-1.
Apart from these counting errors, there might be further systematic errors that affect the results. After all, only the C+ and O+ peaks are clearly visible in the M/Q histograms. By setting up a peak shape model based on TRIM simulations (see Sect. 2.4), the other peaks have been resolved, which means that the derived abundances depend on the accuracy of this model. This is especially relevant for ions that strongly overlap with other peaks such as N+, Ne+, Mg+, and Si+. Furthermore, the contributions of Al+ and Fe2+ can only be roughly estimated with the given approach.
Comparison of the heavy PUI composition derived from CTOF data with the solar-wind composition (von Steiger et al. 2000; Shearer et al. 2014) and the modelled composition that one would expect from the production scenario proposed by Wimmer-Schweingruber & Bochsler (2003).
The Mg2+ abundance is sensitive to the background subtraction. As a result, the background model may be a source of systematic errors that would mainly affect the abundances of C+ and Mg2+.
Only data where no residual energy signal was triggered was used for our analysis. But even low-charged PUIs have a low probability of triggering a residual energy measurement. This probability is negligible for singly charged PUIs at low speeds. But counts triggered by Mg2+ or PUIs at higher speeds may escape our analysis. This again means that the result for the abundance of Mg2+ is very uncertain. The O+/C+ ratio at higher solar-wind speeds is only affected to a small extent by this effect. Hovestadt et al. (1995) gives a threshold of ~25 keV for the residual energy measurement. Considering the energy loss of the post-accelerated ions in the carbon foil (10–20% for C+ and O+), and the energy loss in the dead layer of the solid state detector (~40% for C+ and O+) ions with an initial speed of ~560 km s-1 can overcome this threshold. This affects the O+/C+ ratio at solar-wind speeds above 450 km s-1 because speeds up to w = 1.2 have been considered. To quantify the impact of this effect, we compared the amount of C+ and O+ counts that have been registered with zero energy with the amount of all counts for these ion species in the highest solar-wind speed bin, 500 km s-1 ≤ vsw< 537 km s-1, using a simple box rate approach and a restriction to 1 ≤ w< 1.2 to avoid background counts. In this data set, 82% of the C+ counts and 88% of the O+ counts have been measured with zero residual energy, which in turn means that the restriction to events with zero residual energy introduces a small systematic error that is, however, smaller than the statistic error.
Finally, there are uncertainties in the efficiency model, which is only based on measurements for C, N, and O and extrapolated for heavier ions. Altogether, the uncertainties of Mg+ and Si+ given in Tables 2 and 4 are underestimated because their abundance might be affected by strong systematic errors, which are not included there.
3. Discussion
In the following, the results presented in Tables 2 and 3 are compared to the results derived by Allegrini et al. (2005) and Gloeckler et al. (2000). Afterwards a simple model is used to relate our observations to the solar-wind neutralisation scenario.
3.1. Comparison with former results
CELIAS/CTOF acquired inner-source PUI data at 1 AU during solar activity minimum in 1996 for rather low solar-wind speeds. The Gloeckler et al. (2000) data were obtained by Ulysses/SWICS at low and middle latitudes at an average heliocentric distance of 1.49 AU between 1994 and 1995, which also corresponds to the solar activity minimum. During this time Ulysses measured predominantly in high solar-wind speeds but also in low solar-wind speeds ranging from 318 km s-1 to 864 km s-1. The data used by Allegrini et al. (2005) were also obtained by Ulysses/SWICS but in three different time periods, two in solar minimum and one in solar maximum, where SWICS measured exclusively in high solar-wind speeds at a heliocentric distance of ≈2 AU and latitudes of about 70°. For our analysis we used a total of ~42 000 counts, while the other studies are based on ~800 counts (Gloeckler et al. 2000) and ~250 counts (Allegrini et al. 2005).
Our results for the inner-source heavy PUI composition are in satisfactory agreement with the values derived by Gloeckler et al. (2000) when keeping in mind that the O+/C+ ratio shows a systematic trend with solar-wind speed. Although one can see significant deviations, especially for O+, former studies claimed that the inner-source PUI composition resembles the elemental solar-wind composition that is shown in Table 4 taken from von Steiger et al. (2000), except for the neon abundance that was taken from the more recent analysis of Shearer et al. (2014). Our results confirm these systematic deviations and raise the question of their origin, which is probably connected to the production mechanism of inner-source PUIs.
Our investigation focuses on the solar-wind neutralisation idea by Wimmer-Schweingruber & Bochsler (2003) that is the most promising production scenario. This scenario provides two effects that influence the inner-source PUI composition: on the one hand, the charge-state distribution of an ion after passing a thin dust grain depends on the ion energy and species. On the other hand, every ion species has a different ionisation probability. We suggest that the interplay of these two effects could already lead to the observed PUI composition.
3.2. Solar-wind neutralisation model
The basic idea is that the solar wind streaming outwards interacts with the dust population and continuously produces neutrals, singly-, and doubly-charged ions on the line of sight between the Sun and the spacecraft. If one assumes that the interaction cross-section for the dust population is equal for all solar-wind ions and every ion-dust interaction produces one single-charged PUI, we would observe solar-wind composition. But from experiments performed with thin carbon foils, we know that ions leaving the dust cannot be only neutral, but also (multiply) charged. The distribution of charge states after the interaction strongly depends on ion energy and species. Furthermore, this distribution can subsequently be altered by ionisation processes. Thus the measured composition of one-fold ionised PUIs does not necessarily resemble the solar-wind composition.
To investigate the deviation from the solar-wind composition, we set up a simple toy model for the solar-wind neutralisation scenario to study the impact of the effects mentioned above. Our model is similar to but even more simplified than the approach by Bochsler et al. (2007) who have already investigated the alteration of the PUI composition by these effects.
We assume that the solar wind streams radially outwards. Thus the flux, fsw, decreases with r-2 with r the heliocentric distance, but the composition remains constant. At each distance solar-wind ions may interact with thin dust particles, resulting in the production of neutrals and low-charged ions. The dust population is modelled with an interaction cross-section that depends on the heliocentric distance: σ(r) ∝ rD. Furthermore, we only assume very thin carbon foils for which the energy loss of the solar-wind ions is negligible. Thus, the interacting particles still have solar-wind velocity after the passage. This is also consistent with the observed w-spectra of inner-source PUIs. In this case these spectra would not exclusively stem from adiabatic cooling but would evolve directly from the production mechanism (Bochsler et al. 2006).
The fractions for neutrals, η, single-, η+, and doubly-ionised particles, η++, after the foil passage are estimated from measurements of ions passing through thin carbon foils (Gonin et al. 1995, 1994; Bürgi et al. 1993; Wimmer-Schweingruber & Bochsler 2003; Allegrini et al. 2014). In addition to the primary production of the particles due to the dust grain passage, photo-ionisation is considered. Next to photo-ionisation, particles may also be ionised by electron impact or charge-exchange with solar-wind protons that are not included in our model because photo-ionisation is usually the dominant ionisation process. It cannot be ruled out that the other ionisation processes favour certain ion species. The photo-ionisation rates, ν and ν+, for the different ions at 1 AU were derived following the formula and parameters given in Verner et al. (1996) and scaled with r-2.
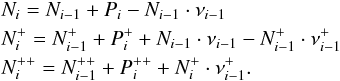
For the solar radiation spectrum, a typical spectrum during solar minimum measured with TIMED/SEE was used (Woods et al. 2000). Thus neutrals are ionised to single-charged ions with the rate ν, and single-charged ions can be ionised to doubly-charged ions with the rate ν+. Since only a small fraction of the interacting particles end up as doubly-charged ions and the ionisation probability for doubly-charged ions is generally lower than for singly-charged ions, further ionisation is neglected. Moreover, the process starts at a certain distance from the Sun, rmin, because dust grains sublime at a certain distance from the Sun, and the solar-wind must have been accelerated before interacting with the dust. This means that PUIs may be produced continuously on the path between rmin and our point of observation, 1 AU. The simulation works on a linear 1D grid. Assuming a constant velocity for all particles, each grid point stands for one second in time, or vsw·1 s km. The production rates Pi,  , and
, and  for neutrals, singly-, and doubly-charged particles that follow from the interaction of the solar-wind ions with the dust grains are calculated for every grid point i by
 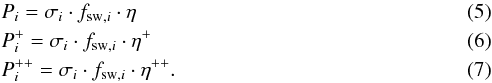 The particle populations of neutrals, Ni, singly-charged ions,
  , and doubly-charged ions,
  at each grid point i are calculated with the following formulae using the production rates above and the photo-ionisation rates νi and
  :
: 
3.3. Composition comparison
We chose the solar-wind composition given in Table 4 as the initial composition of the particles. The given errors are the propagated errors from the initial elemental solar-wind composition values. With the toy model, the expected inner-source PUI composition was calculated for three different parameter sets of D, scaling the dust cross-section, and rmin:
-
1.
rmin = 30 R⊙; D = −1;
-
2.
rmin = 30 R⊙; D = −1.3;
-
3.
rmin = 4 R⊙; D = −1.3.
The first two parameter sets with rmin = 30 R⊙ are chosen following Schwadron et al. (2000), who propose that the peak of inner-source PUI production should be located within 10–50 R⊙. The scaling of the dust cross-section is based on the density distribution of the dust and, on the one hand, taken from the theoretical value of D = −1 considering only Poynting-Robertson drag and, on the other, from the empirically found value of D = −1.3 (Leinert et al. 1978). In the simulation results, one can see that the variation in this parameter only results in very small differences in the simulation results. The third parameter set shows an extreme case. Kimura et al. (1997) found that carbon aggregates with small impurities sublime at 4 R⊙ from the Sun, and this is used for rmin. The results for the inner-source PUI composition and the charge-state distributions at 1 AU are shown in Table 4 for all parameter sets.
In all results, the N+, O+, and Ne+ abundance ratios with respect to C+ are significantly lower than the corresponding elemental solar-wind values, whereas the Mg+ and Si+ ratios are increased with respect to the solar-wind ratios. In the measured inner-source heavy PUI composition, a similar behaviour can be found, except for N+. One possible reason for this is that the N+ peak is likely to contain Si2+ counts that cannot be distinguished from N+ counts owing to having the same M/Q and similar energy loss in the carbon foil. Furthermore, the model’s results show an abundance of Si2+ of comparable order to Mg2+, which supports this explanation.
From the quantitative point of view, the deviations of the model results and the measurements depend on the parameters of the model. The first two parameter sets reproduce the O+/C+ ratio well, but fail to reproduce the Ne+/C+ and Si+/C+ ratio that matches the third parameter set better. However, the measured Si+ abundance is possibly affected by a large systematic error, and the Ne+ abundance contains a contribution of ions with an interstellar origin. Owing to neon’s very high first ionisation potential, interstellar neon atoms can approach close to the Sun before getting ionised (Drews et al. 2012). When these particles cool adiabatically before reaching 1 AU, we cannot distinguish between inner-source and interstellar Ne+ ions. The Mg+/C+ and the Mg2+/C+ ratio are in reasonable agreement with all parameter sets when keeping in mind that the error of the Mg2+ abundance is greater than given in the table because of subtracting background counts. Considering the charge-state distributions at 1 AU that result from the toy model, it is worth mentioning that a significant neutral component is calculated for all parameter sets.
3.4. Solar-wind-speed dependence
Abundance ratios of C+/O+ in w = 0.8 to w = 1.2 compared to the model results at varying solar-wind speeds.
In Table 5 the first two columns summarise results for the inner-source O+/C+ ratio at different solar-wind speeds. These consist of ratios obtained in this study (vsw ≤ 537 km s-1) and the result by Allegrini et al. (2005) that was measured at a solar-wind speed of about 750 km s-1. The value of Gloeckler et al. (2000) was derived in solar-wind speeds from 318 km s-1 to 864 km s-1 and thus represents an average value for the solar-wind-speed-dependent O+/C+ ratio. It can be seen that both formerly obtained values fit the newly observed trend of the O+/C+ ratio with increasing solar-wind speed obtained by CTOF very well.
Columns 3–5 of Table 5 show the toy model predictions for the O+/C+ ratio as a function of the solar-wind velocity with the same parameter sets used in the previous section. In all cases, we observed a slight increase in the O+/C+ ratio with solar-wind speed. Although the increase is not as steep as in the data, the trend is reproduced. The increase in the model values is mainly related to the primary production of the ions. Allegrini et al. (2014) measured the charge-state fractions of carbon and oxygen ions after the passage through very thin carbon foils at different ion energies. It was found that the fraction of O+ ions after the foil shows a stronger increase with energy than the fraction of C+ ions in the considered ion speed range, which would lead to the observed trend of the O+/C+ ratio.
4. Conclusion
We used data from the Charge-Time-Of-Flight sensor on-board SOHO to study the composition of inner-source PUIs. Previous studies have claimed that this composition is similar to the solar-wind composition, even though there were significant deviations. Our study that is based on ~42 000 counts compared to ~800 counts and ~250 counts of Gloeckler et al. (2000) and Allegrini et al. (2005), respectively, confirmed these results. In particular, the large deviation of the O+/C+ from the solar-wind oxygen-to-carbon ratio remained. Furthermore, we could show that the deviation of the O+/C+ as measured by Gloeckler et al. (2000) and Allegrini et al. (2005) is due to a systematic increase with solar-wind speed. This signature has not been reported before and constitutes another observational constraint for the production scenarios of inner-source PUIs.
To explain the compositional deviation and the newly found solar-wind speed dependence, a simple model has been set up based on the production mechanism proposed by Wimmer-Schweingruber & Bochsler (2003). This model includes the production of inner-source PUIs by the interaction of solar-wind ions with dust, resulting in neutral or low-charged particles and photo-ionisation. Owing to these processes, the formerly solar-wind ions can either contribute to a neutral, singly-, or doubly-charged population that is radially moving outwards with solar-wind speed. The distribution of charge states after passing the dust strongly depends on the element, as does the photo-ionisation rate. Our model predicts different charge-state distributions at 1 AU for every element. Thus, we do not expect the singly-charged population, which we observe, to reflect the elemental solar-wind composition. We point out that the model also predicts non-negligible populations of neutral and doubly-charged particles co-moving outwards with the solar wind. Thus the inner source might also be a direct source for energetic neutral atoms. Future observations of inner-source neutrals may constitute a unique opportunity to further constrain the production mechanisms of inner-source PUIs.
The simple nature of our model leads us not to claim full quantitative accuracy. The main uncertainty of the model stems from the poorly known characteristics of the dust population within 1 AU. Especially the chemical composition, dust grain geometry, and the spatial distribution inside 1 AU are important factors for our model, where no reliable constraints exist to our knowledge. Nevertheless, the model results show that the deviation of the measured inner-source PUI composition and the elemental solar-wind composition can be explained with the interplay of solar-wind-dust interaction and photo-ionisation. Furthermore, the increase in the O+/C+ ratio at higher solar-wind speeds can be reproduced qualitatively. Overall, our findings suggest that the production scenario proposed by Wimmer-Schweingruber & Bochsler (2003) is the main driver in the production of inner-source PUIs.
Acknowledgments
We gratefully acknowledge use of Proton Monitor data that has been provided by the SOHO archive. This work was supported by the German Space Agency (DLR) under grant number 50 OC 1103 and by the University of Kiel.
References
- Allegrini, F., Schwadron, N., McComas, D., Gloeckler, G., & Geiss, J. 2005, J. Geophys. Res.: Space Phys., 110 [Google Scholar]
- Allegrini, F., Ebert, R. W., Fuselier, S. A., et al. 2014, Opt. Engineering, 53, 024101 [NASA ADS] [CrossRef] [Google Scholar]
- Berger, L., Drews, C., Taut, A., & Wimmer-Schweingruber, R. 2013, in AIP Conf. Proc., 1539, 386 [Google Scholar]
- Berger, L., Drews, C., Taut, A., & Wimmer-Schweingruber, R. 2015, A&A, 576, A54 [NASA ADS] [CrossRef] [EDP Sciences] [Google Scholar]
- Bochsler, P. 2007, A&ARv, 14, 1 [NASA ADS] [CrossRef] [Google Scholar]
- Bochsler, P., Möbius, E., & Wimmer-Schweingruber, R. 2006, Geophys. Res. Lett., 33 [Google Scholar]
- Bochsler, P., Möbius, E., & Wimmer-Schweingruber, R. F. 2007, in ESA SP, 641, 47 [Google Scholar]
- Bürgi, A., Gonin, M., Oetliker, M., et al. 1993, J. Appl. Phys., 73, 4130 [NASA ADS] [CrossRef] [Google Scholar]
- Bzowski, M., & Królikowska, M. 2004 [arXiv:astro-ph/0405148] [Google Scholar]
- Drews, C., Berger, L., Wimmer-Schweingruber, R. F., et al. 2010, J. Geophys. Res.: Space Phys., 115 [Google Scholar]
- Drews, C., Berger, L., Wimmer-Schweingruber, R. F., et al. 2012, J. Geophys. Res.: Space Phys., 117 [Google Scholar]
- Geiss, J., Gloeckler, G., Fisk, L., & Steiger, R. V. 1995, J. Geophys. Res. Space Phys., 100, 23373 [NASA ADS] [CrossRef] [Google Scholar]
- Geiss, J., Gloeckler, G., & Von Steiger, R. 1996, in The Heliosphere in the Local Interstellar Medium (Springer), 43 [Google Scholar]
- Gloeckler, G., Fisk, L., Geiss, J., Schwadron, N., & Zurbuchen, T. 2000, J. Geophys. Res. Space Phys., 105, 7459 [NASA ADS] [CrossRef] [Google Scholar]
- Gonin, M., Kallenbach, R., & Bochsler, P. 1994, Nucl. Instr. Methods Phys. Res. Sect. B: Beam Interactions with Materials and Atoms, 94, 15 [NASA ADS] [CrossRef] [Google Scholar]
- Gonin, M., Kallenbach, R., Bochsler, P., & Bürgi, A. 1995, Nucl. Instr. Meth. Phys. Res. Sect. B: Beam Interactions with Materials and Atoms, 101, 313 [NASA ADS] [CrossRef] [Google Scholar]
- Grünwaldt, H., Neugebauer, M., Hilchenbach, M., et al. 1997, Geophys. Res. Lett., 24, 1163 [NASA ADS] [CrossRef] [Google Scholar]
- Hefti, S. 1997, Ph.D. Thesis, Universität Bern [Google Scholar]
- Hovestadt, D., Hilchenbach, M., Bürgi, A., et al. 1995, Sol. Phys., 162, 441 [NASA ADS] [CrossRef] [Google Scholar]
- Kimura, H., Ishimoto, H., & Mukai, T. 1997, A&A, 326, 263 [NASA ADS] [Google Scholar]
- Leinert, C., Hanner, M., Link, H., & Pitz, E. 1978, A&A, 64, 119 [NASA ADS] [Google Scholar]
- Mann, I., & Czechowski, A. 2005, ApJ, 621, L73 [NASA ADS] [CrossRef] [Google Scholar]
- Möbius, E., Hovestadt, D., Klecker, B., Scholer, M., & Gloeckler, G. 1985, Nature, 318, 426 [NASA ADS] [CrossRef] [Google Scholar]
- Schwadron, N., Geiss, J., Fisk, L., et al. 2000, J. Geophys. Res. Space Phys., 105, 7465 [NASA ADS] [CrossRef] [Google Scholar]
- Shearer, P., von Steiger, R., Raines, J. M., et al. 2014, ApJ, 789, 60 [NASA ADS] [CrossRef] [Google Scholar]
- Taut, A. 2014, Master’s Thesis, Institute for Experimental and Applied Physics, Christian-Albrechts-University of Kiel [Google Scholar]
- Verner, D., Ferland, G., Korista, K., & Yakovlev, D. 1996 [arXiv:astro-ph/9601009] [Google Scholar]
- Von Steiger, R., Schwadron, N., Fisk, L., et al. 2000, J. Geophys. Res., 105, 27217 [NASA ADS] [CrossRef] [Google Scholar]
- Wiens, R. C., Bochsler, P., Burnett, D. S., & Wimmer-Schweingruber, R. F. 2004, Earth Planet. Sci. Lett., 226, 549 [Google Scholar]
- Wimmer-Schweingruber, R. F., & Bochsler, P. 2003, Geophys. Res. Lett., 30 [Google Scholar]
- Wimmer-Schweingruber, R. F., Bochsler, P., Kern, O., Gloeckler, G., & Hamilton, D. C. 1998, J. Geophys. Res. Space Phys., 103, 20621 [NASA ADS] [CrossRef] [Google Scholar]
- Woods, T. N., Bailey, S., Eparvier, F., et al. 2000, Phys. Chem. Earth, Part C: Solar, Terrestrial & Planetary Science, 25, 393 [Google Scholar]
- Ziegler, J. F., Ziegler, M., & Biersack, J. 2010, Nucl. Instr. Methods Phys. Res. Sect. B: Beam Interactions with Materials and Atoms, 268, 1818 [Google Scholar]
All Tables
Peak shape parameter ratios with respect to the C+ peak derived with data from 270 km s-1 ≤ vsw ≤ 406 km s-1 and ΔwC+ = 0.1.
Results from the derivation of the inner-source PUI composition measured with SOHO/CELIAS/CTOF at 1 AU compared to the studies of Gloeckler et al. (2000) and Allegrini et al. (2005).
Comparison of the heavy PUI composition derived from CTOF data with the solar-wind composition (von Steiger et al. 2000; Shearer et al. 2014) and the modelled composition that one would expect from the production scenario proposed by Wimmer-Schweingruber & Bochsler (2003).
Abundance ratios of C+/O+ in w = 0.8 to w = 1.2 compared to the model results at varying solar-wind speeds.
All Figures
|
Fig. 1 Illustration of the analysis technique used to obtain the abundance ratios of the different pickup ion species. Top panel: time series of the solar-wind speed in the considered time period measured with the CELIAS/PM. The solar-wind speeds in the area shaded red correspond to about 65% of the considered time period. These data were used in our analysis. Middle panel: wi-coverage for 0.8 ≤ wi< 1.2 for each heavy PUI in terms of wC+. The dashed lines correspond to the wC+ bins for which counts were determined. The shaded area on the left-hand side of the plot shows the range where wHe+ ≤ 2, so we thus expect an enhanced background due to interstellar He+. Two example bins have been picked to show the fit of the corresponding M/Q histograms. Lower left panel: 0.9 ≤ wC+< 1 bin. One can see a significant amount of background counts that have been taken into account in the fit with a power-law distribution. This bin contributes to the total counts of C+, N+, Mg2+, and partly to O+ (highlighted in the middle panel). Lower right panel: corresponds to the 1.7 ≤ wC+< 1.8 bin. At energies this high, no background counts are observed and the distributions of Mg+, Al+/Fe2+, and Si+ are more pronounced. Only the counts of Si+ contribute to 0.8 ≤ wSi+< 1.2. |
| In the text | |
|
Fig. 2 Illustration of the estimation of the shape parameters for O+. The upper panel shows an M/Q histogram for 1.2 ≤ wC+< 1.3. From the peak’s counts (a box with M/Q0 ± 1 amu e-1), a histogram of the energy of the ions when hitting the carbon foil is created (lower left panel). TRIM simulations corresponding to the energy bins are obtained. An artificial M/Q histogram is created from the transmitted energy and angular scattering information (lower right panel). A fit to this histogram yields estimated parameters for the real peak. |
| In the text | |
Current usage metrics show cumulative count of Article Views (full-text article views including HTML views, PDF and ePub downloads, according to the available data) and Abstracts Views on Vision4Press platform.
Data correspond to usage on the plateform after 2015. The current usage metrics is available 48-96 hours after online publication and is updated daily on week days.
Initial download of the metrics may take a while.