Fig. 1
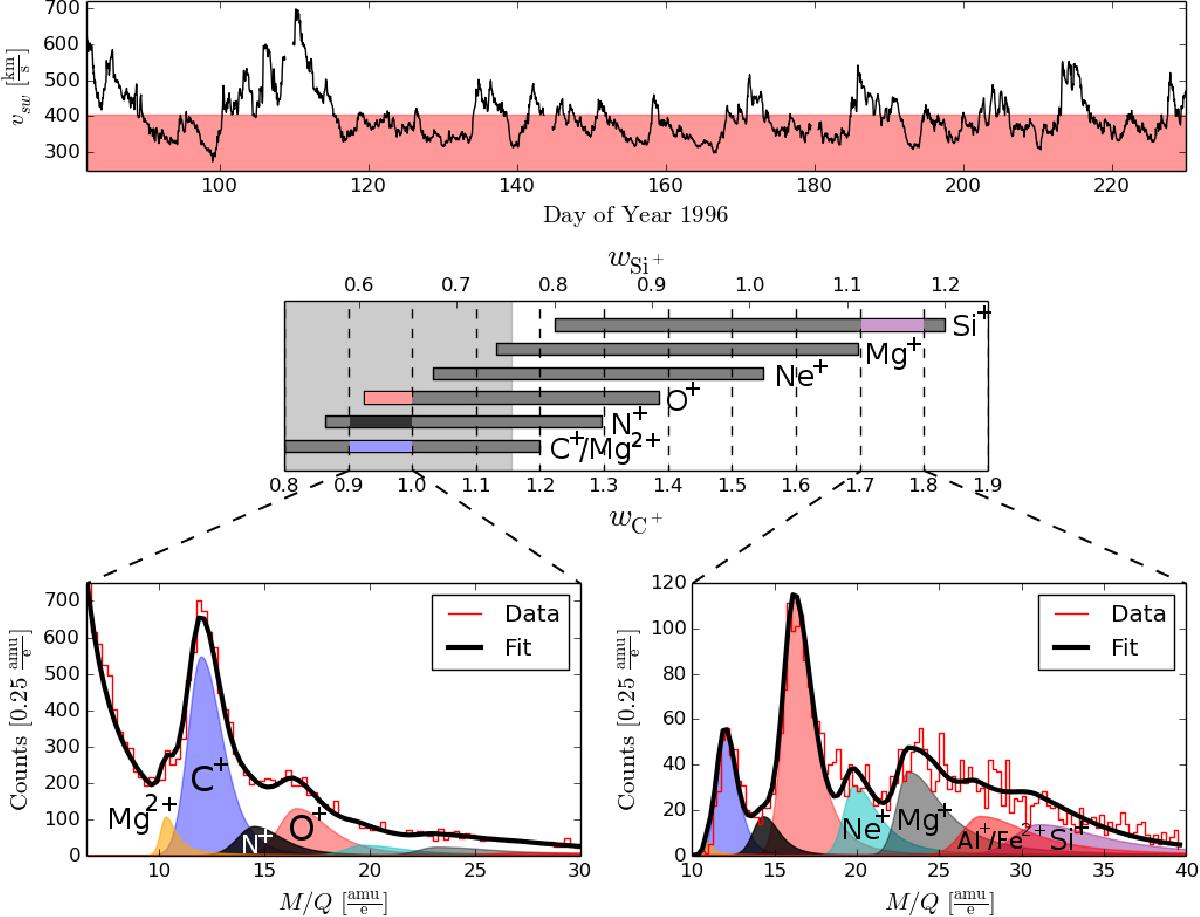
Illustration of the analysis technique used to obtain the abundance ratios of the different pickup ion species. Top panel: time series of the solar-wind speed in the considered time period measured with the CELIAS/PM. The solar-wind speeds in the area shaded red correspond to about 65% of the considered time period. These data were used in our analysis. Middle panel: wi-coverage for 0.8 ≤ wi< 1.2 for each heavy PUI in terms of wC+. The dashed lines correspond to the wC+ bins for which counts were determined. The shaded area on the left-hand side of the plot shows the range where wHe+ ≤ 2, so we thus expect an enhanced background due to interstellar He+. Two example bins have been picked to show the fit of the corresponding M/Q histograms. Lower left panel: 0.9 ≤ wC+< 1 bin. One can see a significant amount of background counts that have been taken into account in the fit with a power-law distribution. This bin contributes to the total counts of C+, N+, Mg2+, and partly to O+ (highlighted in the middle panel). Lower right panel: corresponds to the 1.7 ≤ wC+< 1.8 bin. At energies this high, no background counts are observed and the distributions of Mg+, Al+/Fe2+, and Si+ are more pronounced. Only the counts of Si+ contribute to 0.8 ≤ wSi+< 1.2.
Current usage metrics show cumulative count of Article Views (full-text article views including HTML views, PDF and ePub downloads, according to the available data) and Abstracts Views on Vision4Press platform.
Data correspond to usage on the plateform after 2015. The current usage metrics is available 48-96 hours after online publication and is updated daily on week days.
Initial download of the metrics may take a while.