Fig. 2
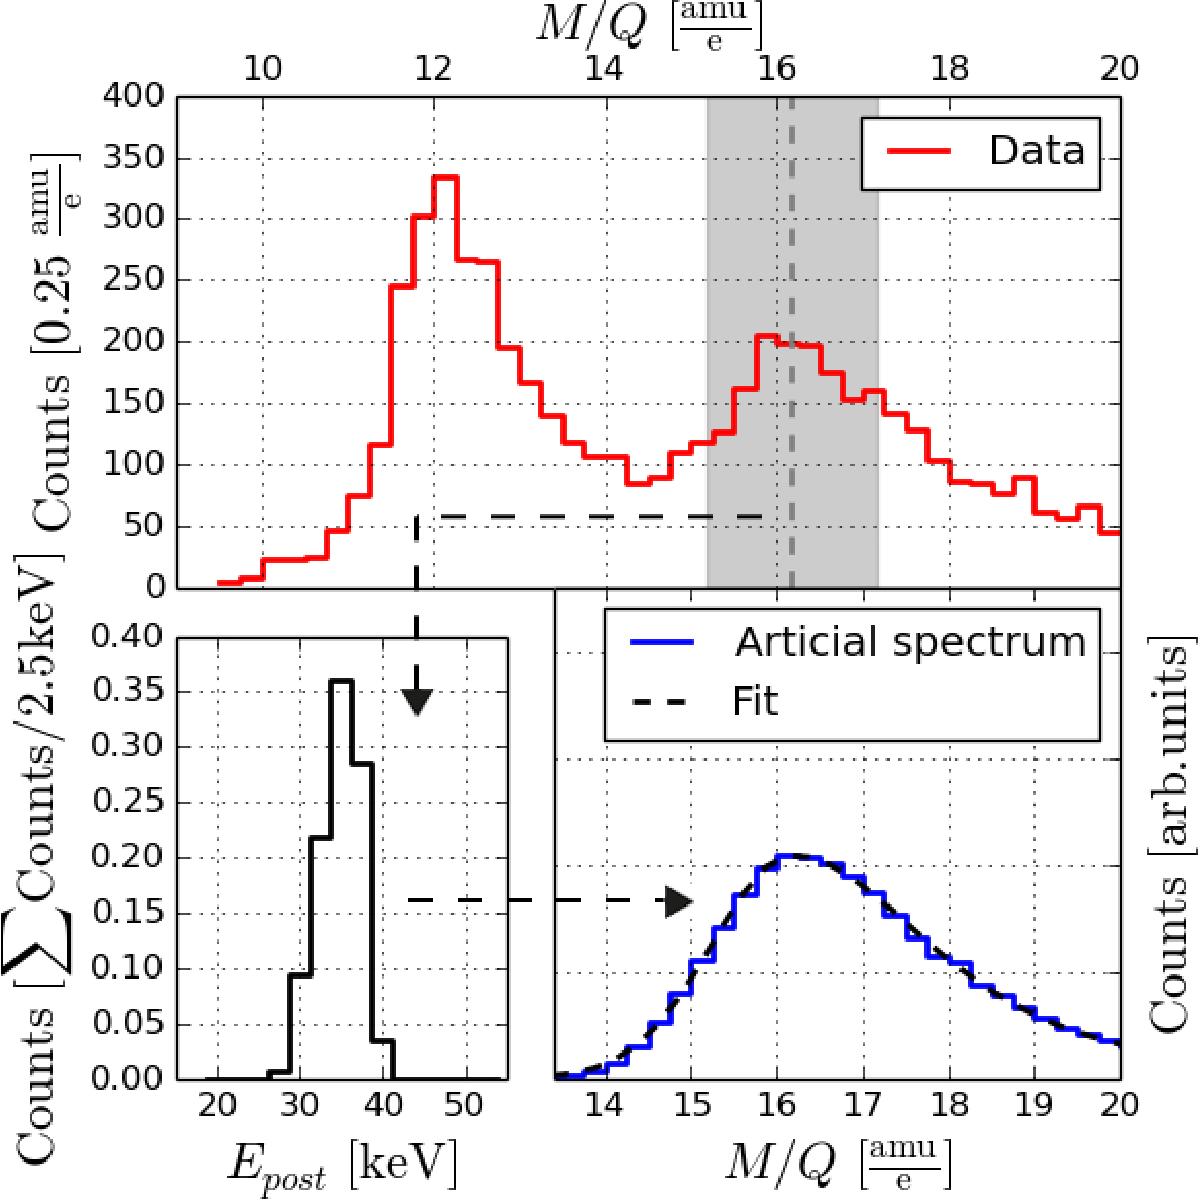
Illustration of the estimation of the shape parameters for O+. The upper panel shows an M/Q histogram for 1.2 ≤ wC+< 1.3. From the peak’s counts (a box with M/Q0 ± 1 amu e-1), a histogram of the energy of the ions when hitting the carbon foil is created (lower left panel). TRIM simulations corresponding to the energy bins are obtained. An artificial M/Q histogram is created from the transmitted energy and angular scattering information (lower right panel). A fit to this histogram yields estimated parameters for the real peak.
Current usage metrics show cumulative count of Article Views (full-text article views including HTML views, PDF and ePub downloads, according to the available data) and Abstracts Views on Vision4Press platform.
Data correspond to usage on the plateform after 2015. The current usage metrics is available 48-96 hours after online publication and is updated daily on week days.
Initial download of the metrics may take a while.