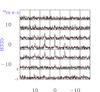
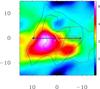
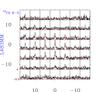
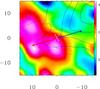
Fig. 9

13CO spectral maps in black overlaid with the model envelope spectra in red shown on the left panels. Right panels: color maps of the UV heated gas distribution are shown. These are obtained by subtracting the model envelope emission from the observed spectra on a pixel-by-pixel basis. The sources are B335 (top) and L483 mm (bottom). The axes show the offsets (Δα, Δδ) in arcsec. The color scale is in units of K km s-1.
Current usage metrics show cumulative count of Article Views (full-text article views including HTML views, PDF and ePub downloads, according to the available data) and Abstracts Views on Vision4Press platform.
Data correspond to usage on the plateform after 2015. The current usage metrics is available 48-96 hours after online publication and is updated daily on week days.
Initial download of the metrics may take a while.