Fig. 2
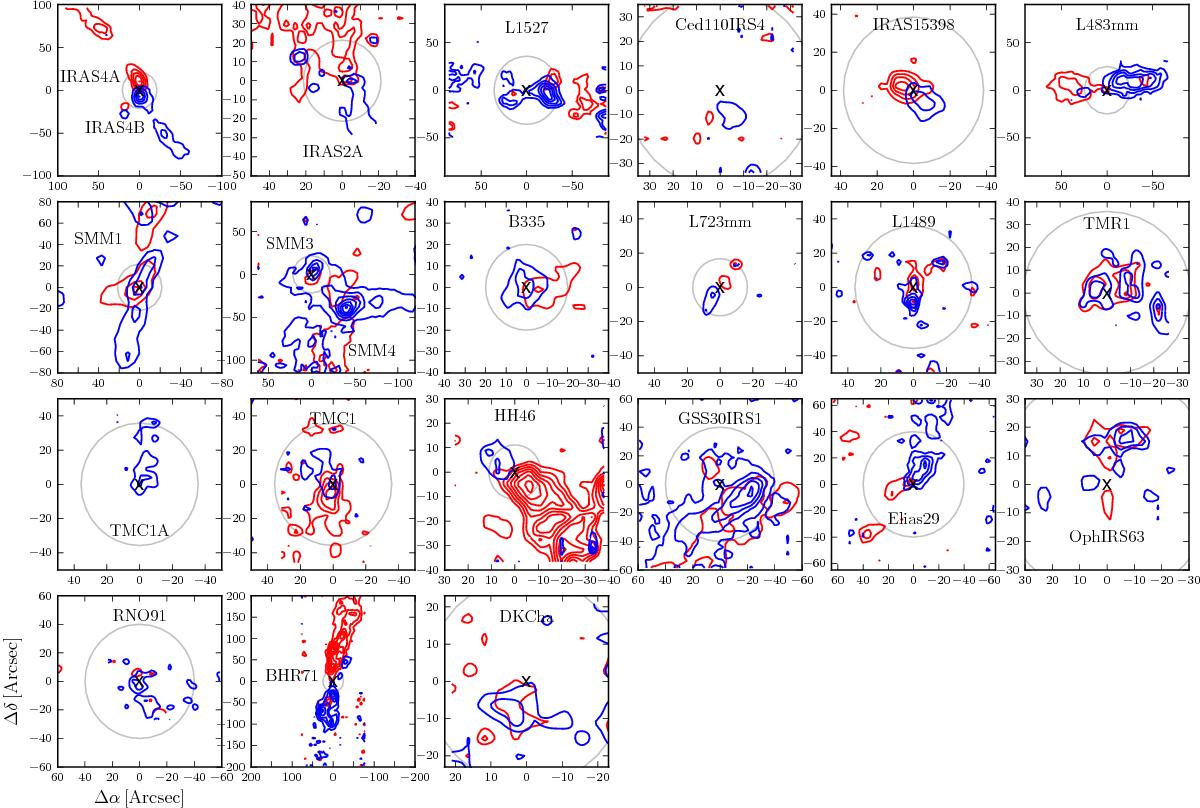
Overview of the outflows traced by the 12CO 6−5 observations with the APEX-CHAMP+ instrument. Contour levels are given in Table A.1 and the source is located at (0, 0) in each map, with the exception of the maps of NGC 1333-IRAS 4A and IRAS 4B, and Ser-SMM3 and Ser-SMM4, which are located in the same maps and centered on NGC 1333-IRAS 4A and Ser-SMM3, respectively. The circle in each plot corresponds to a region of 5000 AU radius at the distance of each source. Velocity ranges over which the integration was done are provided in Table A.1.
Current usage metrics show cumulative count of Article Views (full-text article views including HTML views, PDF and ePub downloads, according to the available data) and Abstracts Views on Vision4Press platform.
Data correspond to usage on the plateform after 2015. The current usage metrics is available 48-96 hours after online publication and is updated daily on week days.
Initial download of the metrics may take a while.