| Issue |
A&A
Volume 575, March 2015
|
|
|---|---|---|
| Article Number | A59 | |
| Number of page(s) | 16 | |
| Section | Extragalactic astronomy | |
| DOI | https://doi.org/10.1051/0004-6361/201425082 | |
| Published online | 23 February 2015 | |
Dark influences: imprints of dark satellites on dwarf galaxies
Kapteyn Astronomical Institute, University of Groningen, PO Box 800, 9700 AV Groningen, The Netherlands
e-mail: This email address is being protected from spambots. You need JavaScript enabled to view it.
Received: 30 September 2014
Accepted: 24 November 2014
Abstract
Context. In the context of the current Λ cold dark matter cosmological model small dark matter halos are abundant and satellites of dwarf galaxies are expected to be predominantly dark. Since low mass galaxies have smaller baryon fractions, interactions with these satellites may leave particularly dramatic imprints.
Aims. We uncover the influence of the most massive of these dark satellites on disky dwarf galaxies and the possible dynamical and morphological transformations that result from these interactions.
Methods. We use a suite of carefully set up, controlled simulations of isolated dwarf galaxies. The primary dwarf galaxies have solely a stellar disk in the dark matter halo and the secondaries are completely devoid of baryons. We vary the disk mass, halo concentration, initial disk thickness, and inclination of the satellite orbit.
Results. The disky dwarf galaxies are heated and disrupted by the minor merger event, more extremely for higher satellite-to-disk-mass ratios, and the morphology and kinematics are significantly altered. Moreover, for less concentrated halos the minor merger can completely destroy the disk leaving a low-luminosity spheroidal-like galaxy instead.
Conclusions. We conclude that dwarf galaxies are very susceptible to being disturbed by dark galaxies and that even a minor merger event can significantly disrupt and alter the structure and kinematics of a dwarf galaxy. This process may be seen as a new channel for the formation of dwarf spheroidal galaxies.
Key words: galaxies: dwarf / galaxies: evolution / galaxies: interactions / galaxies: structure / galaxies: kinematics and dynamics / dark matter
© ESO, 2015
1. Introduction
The current Λ cold dark matter (ΛCDM) cosmological standard model predicts an abundance of small dark matter halos. A predominant fraction of these halos (with masses <109M⊙) is thought to be too small to have been able to host a galaxy because of processes such as reionization, photo-evaporation of gas, and/or supernova outflows (Gnedin 2000; Hoeft et al. 2006; Kaufmann et al. 2007; Okamoto et al. 2008; Gnedin et al. 2009; Li et al. 2010; Sawala et al. 2013; but see also Taylor & Webster 2005; Warren et al. 2007). These halos will remain almost devoid of stars and are therefore often called dark galaxies. The existence of such dark galaxies is a possible solution to the missing satellites problem (Klypin et al. 1999; Moore et al. 1999).
The dark matter subhalo mass function at accretion is nearly self-similar. Small differences arise because smaller halos form earlier and therefore have a slightly lower normalization of the subhalo mass function at a fixed redshift (van den Bosch et al. 2005; van den Bosch & Jiang 2014). A dwarf galaxy, or small dark matter halo, will thus have a spectrum of perturbers very similar to that of an L⋆ or larger galaxy.
In contrast to larger systems, smaller galaxies are very inefficient at forming stars (Blanton et al. 2001; Robertson & Kravtsov 2008); therefore, the stellar-to-halo-mass ratio decreases towards lower halo masses (Moster et al. 2013; Kormendy & Freeman 2014) and dwarf galaxy baryon fractions are well below the universal baryon fraction (Gnedin 2000; Hoeft et al. 2006; Crain et al. 2007). These small galaxies thus have a subhalo mass function similar to that of larger galaxies, but have smaller baryonic components and most of their satellites can be expected to be dark (Helmi et al. 2012).
The effect of infalling satellites and mergers on the disk of a Milky Way-sized galaxy has often been studied in the past. These events lead to the heating of the disk where the amount of damage depends on the satellite-to-host-mass ratio, the initial thickness of the disk, the orbit of the satellite, and the presence of gas in the disk (Toth & Ostriker 1992; Quinn et al. 1993; Velazquez & White 1999; Font et al. 2001; Benson et al. 2004; Villalobos & Helmi 2008; Hopkins et al. 2008; Moster et al. 2010; Kim et al. 2014). Similar heating events should also take place on the dwarf galaxy scale but the results may be expected to be much more disruptive as the mass of any disk component present is much smaller than that of the heavier satellites. However, this expectation has never been modeled and tested before.
Mergers between dwarf galaxies have been discussed before (e.g., Yozin & Bekki 2012; Kazantzidis et al. 2011; Łokas et al. 2014), but never in the context of dark companions, although some recent studies have looked at the effect of significantly smaller subhalos (e.g., Bekki & Chiba 2006; Chakrabarti & Blitz 2009; Kannan et al. 2012; Lora et al. 2012; Wagner-Kaiser et al. 2014). The frequency of mergers for dwarf galaxies has primarily been studied in the context of the Local Group. There, mergers of dwarf galaxies are prevalent before their infall into bigger, Milky Way-sized halos, but mergers between subhalos do occassionally occur after infall (Angulo et al. 2009; Klimentowski et al. 2010; Deason et al. 2014).
Intriguingly, disks of smaller galaxies have on average a thicker morphology than their larger counterparts (Yoachim & Dalcanton 2006; Sánchez-Janssen et al. 2010). This is partly expected owing to the less efficient gas cooling in smaller halos (Kaufmann et al. 2007; Robertson & Kravtsov 2008), but may have an additional origin in dynamical effects. Moreover, many local field dwarf galaxies are highly irregular and seem disturbed, or are experiencing a starburst but have no clearly detectable companion closeby (Bergvall 2012; Lelli et al. 2014). This also seems to hold for seemingly isolated nearby galaxies (Karachentsev et al. 2006, 2008, 2011). Using very deep observations and detailed analysis a few small galaxies have recently been found to have companions (Cannon et al. 2014; Nidever et al. 2013; Martínez-Delgado et al. 2012), or to be merging, or to be the remnants of significant mergers (Ashley et al. 2013; Amorisco et al. 2014; Łokas et al. 2014).
This argumentation leads us to propose that a merger of a dwarf galaxy with a dark satellite may be an additional path to form low-luminosity dwarf spheroidal galaxies in the field or near the outskirts of more massive halos (systems perhaps akin to the Cetus and Tucana dwarf galaxies, although these are thought to be satellites of the Milky Way, or the KKR25 (Makarov et al. 2012) and KKs3 (Karachentsev et al. 2015) dwarf galaxies).
In this paper we perform a suite of simulations of isolated minor merger events of dwarf galaxies with a dark satellite. We vary the stellar-to-halo-mass ratio of the dwarf galaxy, the initial thickness of the disk and the inclination of the satellite orbit, but keep the mass ratio between the subhalo and the host at 20%. In addition we simulate one dwarf galaxy with properties similar to that of the Fornax dwarf spheroidal as derived from the Schwarzschild models by Breddels & Helmi (2013). The model and simulation parameters are explained in Sect. 2 and the results are described in Sect. 3. In Sect. 4 we present a discussion, and we conclude in Sect. 5.
2. Models
We perform a set of controlled simulations of mergers between a dwarf galaxy and a dark satellite using the N-body/SPH code gadget3 (Springel et al. 2001; Springel 2005). The setup of these experiments is inspired in the Aquarius simulations, a suite of six cosmological dark matter simulations with very high resolution (Springel et al. 2008). This high resolution allows the identification of merger events on the dwarf galaxy scale. In these simulations we identified minor mergers with mass ratio Msat:Mhost ≳ 2:10 for field host halos.
We take the orbit of the satellite to be almost completely radial with rapo/rperi ~ 40. At the start of the simulations the satellite is placed at a distance of ~23 kpc h-1 from the center of the main halo with a radial velocity that is small with respect to the local circular velocity (so the satellite is initially close to apocenter) and a small (prograde) tangential velocity. The inclination of the satellite orbit with the plane of the disk is 30 or 60 degrees, similar to other studies of disk thickening (Villalobos & Helmi 2008; Moster et al. 2010).
The simulations described in this paper are fully collisionless; simulations including gas will be discussed in a forthcoming paper. Throughout this paper we assume a value for the Hubble constant of H0 = 100h with h = 0.73 km s-1 Mpc-1.
Initial values for all parameters.
2.1. Initial conditions for the dwarf galaxy
2.1.1. Structure
Our main isolated models of dwarf galaxies are similar to the simulated small galaxies in Dalla Vecchia & Schaye (2008) and Schaye & Dalla Vecchia (2008). The dwarf galaxies are disky systems (Mayer et al. 2001, 2006) embedded in a dark matter halo and initially have no gas and no bulge component.
The dark matter halo has a Hernquist (1990) profile  (1)whose characteristic parameters are set by an equivalent NFW (Navarro et al. 1996) profile (Springel et al. 2005). More specifically, given the virial mass and concentration of a NFW halo, we set the Hernquist halo’s total mass to Mvir, and the scale radius a is derived by requiring similar inner densities (i.e., rsρ0,NFW = aρ0,H). For a halo of Mvir = 1.0 × 10¹⁰M⊙h-1 and c = 15 this gives a scale radius a = 6.5 kpc h-1 and rvir = 35.1 kpc h-1. The chosen concentration is within the error bars of the expected concentration at z = 0 for a halo with Mvir = 1010M⊙h-1 according to the mass-concentration relations found by Macciò et al. (2008) and Muñoz-Cuartas et al. (2011).
We also model a dwarf galaxy with properties similar to the Milky Way satellite Fornax. The mass and scale radius are consistent with the dynamical models of Breddels & Helmi (2013) and the system has  and a = 5.75 kpc h-1. Note that the concentration of the dark matter halo of this Fornax-analog is lower (c = 5) than that of the other dwarf galaxy models (c = 15).
As stated earlier, we assume that the stars are distributed in an exponential disk with a density profile  (2)The disk scale length is set following Mo et al. (1998), assuming a spin parameter for the halo of 0.033, although our halos do not rotate. We explore a range of disk masses: Md = 0.04Mvir, Md = 0.02Mvir, and Md = 0.008Mvir. This allows us to test the dependence of the effect of the merger on the disk itself. In all our setups the mass of the main halo and the mass of the satellite are kept constant.
All our disks are required to be equally stable with similar Toomre-stability parameter Q,  (3)(Toomre 1964), where G is the gravitational constant, Σ(R) is the surface density of the disk, κ(R) the epicyclic frequency, and σR(R) the radial velocity dispersion, all at radius R. The influence of the mass of the disk on the epicyclic frequency κ(R) is negligible because the halo dominates at all radii for these systems. This implies that the Toomre Q varies with disk mass only through the surface density Σ(R) and the radial velocity dispersion σR(R).
We also explore disks with different initial scale heights z0 = 0.1Rd and z0 = 0.2Rd. The Fornax-like dwarf galaxy has initial scale heights of z0 = 0.1Rd (as in the standard setup) and z0 = 0.3Rd, as smaller systems are expected to be thicker because of less efficient gas cooling (Kaufmann et al. 2007; Robertson & Kravtsov 2008).
All parameters governing the structure of the systems are summarized in Table 1. The numerical parameters of our simulations are described in more detail in Sect. 2.3.
2.1.2. Velocity structure
The initial conditions for the dwarf galaxies are generated following Springel et al. (2005) and Hernquist (1993). In this method the moments of the velocity distribution are calculated assuming that the distribution function only depends on the energy E and the Lz component of the angular momentum. Important differences arise in our setup because the potential is dominated by the halo at all radii, and the velocity dispersions are not negligible compared to the circular velocity in a significant part of the disk. Hence the epicyclic approximation typically used breaks down not only in the very center, but also over a much larger extent of the disk.
Moreover, setting up velocities for the halo particles following a Gaussian distribution with dispersions derived from the Jeans equations leads to a configuration that is not in equilibrium in the central parts of the halo (Kazantzidis et al. 2004; Springel et al. 2005). This is negligible when a disk dominates the region under consideration, but is significant in the case of dwarf galaxies with their considerable lower disk-to-total-mass ratios. Therefore, we determine the velocities and dispersions for the halo particles using the distribution function for a Hernquist profile neglecting the effect of the disk.
For the setup of the velocity structure of the disk we start from the Jeans equations: 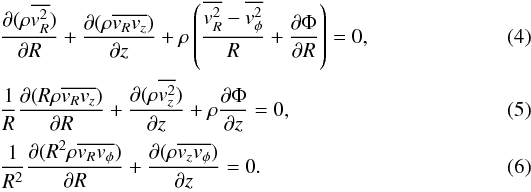 Because the halo dominates the potential at all radii we now assume that the velocity ellipsoid is aligned with the coordinate directions of the spherical coordinate system (r,θ,φ) instead of the cylindrical system (R,θ,z), which is the usual assumption for massive disks. In our case we can approximate,
 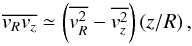 (7)(Binney & Tremaine 1987). In the disk (z ~ 0) Eq. (4) gives the vertical velocity dispersion
 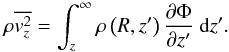 (8)The vertical velocity dispersion in the midplane is related to the disk surface density. For an isothermal sheet
  (Hernquist 1993), which would result in an exponential variation with radius. It is often assumed that this dependence with radius holds for both σz and σR, i.e., that the ratio σz/σR is constant, and that the epicylic frequency holds for all disks (Binney & Merrifield 1998; van der Kruit & Freeman 2011; Hernquist 1993; Gerssen et al. 1997; Westfall et al. 2011). This frequency is also typically used to set up a stable stellar disk for N-body simulations (Hernquist 1993; Springel et al. 2005). However, in order to have a similar Toomre stability parameter Q(R) for the different disks we relax these assumptions and require that
  with f ≥ 1 constant. Using the Jeans equations to calculate the vertical velocity dispersion (see Eq. (8)) we can find the radial velocity dispersion and the proportionality factor f by requiring that Q(R) ≥ 2 throughout the disk. The value Q(R) ≥ 2 is used to avoid spontaneous bar formation following Athanassoula & Sellwood (1986) and Athanassoula (2003).
The velocity dispersions obtained in this way can have a very steep, close to exponential rise in the inner parts of the disk. This subsequently leads to extremely high radial velocity dispersions because we set  with f ≥ 1. As a consequence, this can result in an imaginary azimuthal streaming velocity (Quinn et al. 1993; Hernquist 1993) if the epicyclic approximation is used. We follow Hernquist (1993) in solving this by smoothing the velocity dispersions using
  , where as is the smoothing length which we set equal to half the disk scale length, as = 0.5Rd. However, unlike Hernquist (1993), we smooth only the radial velocity dispersion because the vertical velocity dispersion is determined directly from the Jeans equations (see Eq. (8))1.
We find the azimuthal velocities using the assumptions stated above and using Eq. (3), 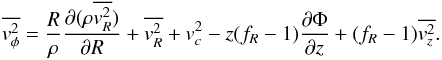 (9)Finally, we need to find
  and
and  , which are related to
  through
  (10)To constrain these velocities the epicyclic approximation is normally used
  (11)where
 (12)This approximation, however, is only valid when the rotational motion dominates and the velocity dispersions are small. Therefore, we use the epicyclic approximation for the outer parts of the disk from the radius where
  . Since
  must hold, but is large at the center,
  is likely to be significant there. Inwards of this point we fit quadratic functions to vφ and require that vφ(R = 0,z) = 0 at each z. Although the function itself is continuous we do not force continuity on the slope of vφ. In that region σφ is then found using Eq. (10).
2.2. Satellites
The dark satellite has a NFW profile (Navarro et al. 1996), set up following Villalobos & Helmi (2008), using the mass-concentration relation found by Muñoz-Cuartas et al. (2011). The satellite has a virial mass that is 20% of that of the host, Msat = 2 × 10⁹M⊙h-1, a concentration of c = 17.25, and has no baryonic matter at all. For the Fornax-analog experiment the satellite has a virial mass of  and a concentration of c = 18.91 (see Table 1). We compare the average density of the host, including both the halo and disk, inside the pericenter radius with the average density of the satellite within rs,sat. The ratio
  ranges from 0.075 for disk1, 0.10 for disk2, and 0.13 for disk3, all with the more concentrated halo, to 0.63 for the FNX-analog, with the less concentrated halo.
2.3. Numerical parameters
The N-body systems are evolved using the code gadget3. The number of particles used for the different components are chosen such that artificial bar formation due to graininess of the potential can be avoided and such that the ratio between the baryonic and dark matter particle masses is larger than 1:10 , to avoid numerical heating of the disk due to the dark matter halo particles. To ensure this, the systems with smaller disk masses, disk3 and the Fornax-analog, have more particles in the host dark matter halo and a slightly different softening length.
To set the softening lengths we follow Villalobos & Helmi (2008) and use the prescription presented in Athanassoula et al. (2000). These authors found correlations between the optimal softening length and the mean distance from each particle to its sixth closest neighbor, 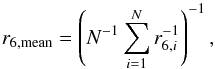 (13)for a variety of mass distributions. We determined the optimal softening for our simulations calculating r6,mean for our simulations after using a first guess for the softening and then comparing these values to those found by Villalobos & Helmi (2008). As our central densities and mass distributions of the individual components are very similar we find ϵopt using their relation between ϵopt and r6,mean. We have also checked that the derived softening lengths gave stable disk and halo profiles compared to taking slightly different values.
The criterion we use for the timestep is the standard gadget criterion,  , where we set η = 0.025 and fix the maximum timestep to 25 Myr. The total energy is conserved to within ~1 percent over 6 Gyr in all simulations.
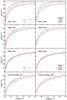 |
Fig. 1 Circular (dashed lines) and azimuthal (dotted lines) velocities of all the disks when relaxed in isolation: the initial conditions (black), after 1 Gyr (blue), and after 2 Gyr (red). |
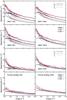 |
Fig. 2 Radial (solid lines), vertical (dashed lines), and azimuthal (dotted lines) velocity dispersions of all the disks when relaxed in isolation: the initial conditions (black), after 1 Gyr (blue), and after 2 Gyr (red). |
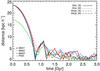 |
Fig. 3 Distance between the center of the dwarf galaxy and its satellite with time for all our simulations: the most massive disk (disk1; black), the intermediate disk (disk2; blue), the least massive disk (disk3; red), and the Fornax-analog (green) for two different inclinations of the satellite orbit with respect to the disk and two sets of initial scale heights as indicated by the top right inset. The orbits show the center of mass trajectory defined by the 100 most bound particles in the satellite. The satellite becomes completely unbound within 2 Gyr. |
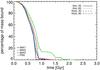 |
Fig. 4 Percentage of mass still bound to the satellite as a function of time for all simulations consisting of four different dwarfs each with two different initial scale heights and two different orbits for the satellite: the most massive disk (disk1; black), the intermediate disk (disk2; blue), the least massive disk (disk3; red), and the Fornax-analog (green). The color and line coding is the same as in Fig. 3 |
2.4. Evolution in isolation
Both the host and satellite are relaxed in isolation to ensure that they are in equilibrium before the merger. Figures 1 and 2 show the velocity structure of the host disks. The rotation and velocity dispersions are measured in cylindrical bins of variable radial bin size which contain a fixed number of 400 particles, and are close to the midplane of the disk, i.e., | z | < 0.05 kpc h-1.
From Fig. 1 we note that the rotational motions of the disks do not evolve significantly. There is a slight increase in vc and vφ due to contraction of the halo, but this stabilizes very quickly. Figure 2 shows the velocity dispersions of the disks. It can be seen that our method to set the velocity distribution without relying on the epicyclic approximation near the center of the disks results in a small unrealistic bump in σφ at the initial time. This is caused by the approximation of the mean streaming velocity by a quadratic function where  . The feature however dissappears quickly as the disk relaxes towards its equilibrium configuration.
3. Results
Figure 3 shows the orbits of the satellite for the different dwarf galaxies. At each snapshot we determine the center of the satellite by computing the center of mass using its 100 most bound particles. The satellite sinks in very quickly through dynamical friction to the central regions of the host where it is fully disrupted in a few passages. This is shown in Fig. 4 where we have plotted the total mass that is still bound to the satellite as a function of time. For all three systems with the more massive halo (Mvir = 1 × 10¹⁰M⊙h-1) the satellite becomes almost completely unbound before the second pericenter. The satellite is more severely stripped when falling into the primary with a more massive disk although the differences are marginal. This is reflected in Fig. 4 in the red lines lying above the blue lines which lie above the black lines. This is an indication that the disk mass slightly influences the minor merger process.
3.1. Morphological changes
3.1.1. Substructure
The morphology of all the dwarf galaxies changes because of the merger as can be seen in Fig. 5 (for the two most massive disks) and Fig. 6 (for the least massive disk and the Fornax-analog). In these figures we show the thinner disks – both face-on and edge-on – before, during, and after the merger in steps of 2 Gyr for the satellite on the orbit with an inclination of 60 degrees. In general, all the disks tilt during the merger. For all plots in this paper, however, the galaxies are oriented in such a way that the direction of total angular momentum of all disk particles within the half-mass radius is parallel to the z-axis.
An envelope of stars coming from the disk itself can be found around the disks in these plots. The lower mass disks end up with larger and more densely populated envelopes than the higher mass disks. All the disks have experienced thickening (see also Sects. 3.1.2 and 3.1.3) while largely retaining the disky appearance except for the FNX-analog. Disk1 develops irregular spiral arms and a strong bar during the merger. The least massive disk on the other hand, is more clearly disturbed by the merger and develops spiral arms and tilts very strongly. A comparison of the most and least massive disks shown in the top panels of Figs. 5 and 6 gives an indication of the very different effects of the satellite on a disk of 4 × 10⁸M⊙h-1 and a disk of 8 × 10⁷M⊙h-1 in dark matter halos of exactly the same mass.
As just mentioned, as a consequence of the merger the Fornax-analog system cannot be called a disky dwarf galaxy from after the second pericenter of the satellite. From an initially stable disk the galaxy first becomes lopsided with warps and irregular structure in the disk, subsequently becomes completely disturbed, and finally more closely resembles a spheroidal system as shown in the left-hand plots in the last two rows of Fig. 6.
The later snapshots of disk3 and the Fornax-analog in Fig. 6 show an abundance of tidal debris that is distributed in shells and plumes. This debris comes from the disk itself as the satellite does not have any stars. Some of the shell structures that are formed during the merger are very similar to structures observed around external galaxies and are thought to be formed by secondary galaxies falling in. These simulations show that these structures can also be from the primary object itself if the merger event is significant enough.
Figures 7 and 8 show the surface brightness of the disks, face-on and edge-on. Since magnitudes are given on a logarithmic scale the density changes are much more clearly visible than in Figs. 5 and 6. Typically, particle plots emphasize the small-scale structures that emerge during the interaction, but fail to show the density contrasts closer to the center of each galaxy. On the other hand, the surface brightness maps are smoothed maps of the density distribution and so the small-scale structures in the outskirts are mostly lost. However, the density contrasts in the galaxies themselves are very well represented in the surface brightness maps. We compute densities by smoothing over 128 neighbors and assume a M/L ratio of 2 for all star particles in all simulated galaxies.
It is instructive to compare the right columns of Figs. 5 and 6 with the left columns of Figs. 7 and 8, respectively. Figures 7 and 8 show surface brightness maps of the final snapshots of each simulation, of which the leftmost column corresponds to the simulations with initially thin disks and the satellite on the 60 degrees orbit. The density gradients in the central parts of all the systems, the bars developed in the disk1s, and the spiral structures and the warps in the disk3s, are evident in Figs. 7 and 8. Figure 8 also shows that the FNX-60-thin remnant is still a somewhat oblate system, but that this is not true for the same setup with an initially thicker disk (FNX-60-thick).
The resulting surface brightness maps in Figs. 7 and 8 can, in principle, be compared to observations. Photometric images currently go down to a surface brightness of approximately 26–27 mag/arcsec2 (see, e.g., Coleman et al. 2004; Martínez-Delgado et al. 2012) but occasionally go deeper as for example Hunter et al. (2011), who use azimuthally averaged surface brightness profiles to reach a surface brightness of μV = 28–31 mag/arcsec2.
The bars in all the most massive disks should all be apparent in photometric observations reaching such depths. Some of the debris around the disks, for example for disk3-60-thin or disk3-60-thick, and some subtler substructure or spiral patterns in the disks would probably also be visible. On the other hand, most of the envelopes around the disks that have formed because of the mergers, and most of the shell features and other substructure in those envelopes will only be visible by using very deep photometry. The Fornax-analogs all have shells in the denser part of the stellar distributions as well. These may be visible in high-quality photometric images.
All the disks in the Mvir = 1010M⊙h-1 halos have higher central surface brightness than the Local Group dwarf galaxies (excepting the LMC and SMC), but they are also much more massive. The galaxies closest to the simulated 1010M⊙h-1 system are IC 4662 and NGC 6822 (McConnachie 2012). The Fornax-analog has a much lower final central surface brightness than the more massive systems, especially initially, and is comparable in surface brightness to the dwarf galaxies in the Local Group in general and the Fornax dwarf galaxy in particular (McConnachie 2012).
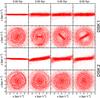 |
Fig. 5 Edge-on and face-on particle distributions of the two most massive disks before the merger (left) up to around 5 Gyr after the first pericenter of the satellite (6 Gyr; right) in steps of 2 Gyr. The orbit of the satellite has an inclination of 60 degrees. The top two panels are for the most massive disk (disk1), and the bottom two for the intermediate disk (disk2), both with z0 = 0.1Rd initially. The first and third rows show the disks edge-on and the second and fourth rows show the disks face-on. To show the features better we plot 5% of the particles within 0.5 kpc h-1, 10% for radii between 0.5 and 1.0 kpc h-1, 20% for radii between 1.0 and 1.5 kpc h-1, and 50% with radii between 1.5 and 2.0 kpc h-1; every particle is plotted for larger radii. |
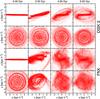 |
Fig. 6 Edge-on and face-on particle distributions of the two least massive disks before the merger (left) up to around 5 Gyr after the first pericenter of the satellite (6 Gyr; right) in steps of 2 Gyr. The orbit of the satellite has an inclination of 60 degrees. The top two panels are for the least massive disk (disk3), and the bottom two for the FNX-analog, both with z0 = 0.1Rd initially. The first and third rows show the disks edge-on and the second and fourth rows show the disks face-on. To show the features better we plot 5% of the particles within 0.5 kpc h-1, 10% for radii between 0.5 and 1.0 kpc h-1, 20% with radii between 1.0 and 1.5 kpc h-1, and 50% of the particles with radii between 1.5 ans 2.0 kpc h-1; every particle is plotted for larger radii. |
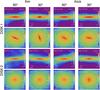 |
Fig. 7 Face-on and edge-on surface brightness maps of the final snapshots for the simulations with the two most massive disks (top: disk1, bottom: disk2). The first two columns are for z0 = 0.1Rd, while those on the right have z0 = 0.2Rd initially. The first and third columns are for the 60-degree inclination satellite, the second and fourth for the 30-degree. |
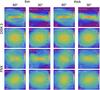 |
Fig. 8 Face-on and edge-on surface brightness maps of the final snapshots for the simulations with the two least massive disks (top: disk3, bottom: Fornax-analog). The first two columns are for z0 = 0.1Rd, while those on the right have z0 = 0.2Rd for disk3, and z0 = 0.3Rd for the FNX-analog initially. The first and third columns are for the 60-degree inclination satellite, the second and fourth for the 30-degree. |
3.1.2. Inner and global shape
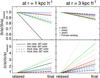 |
Fig. 9 Relative increase in principal axis ratios between initial and final snapshot for all merger simulations. Top: intermediate axis over major axis (b/a); bottom: minor axis over major axis (c/a). The axis ratios are computed with the major axis length equal to 1 kpc h-1 for the panels on the left and equal to 3 kpc h-1for the panels on the right. Shown are 16 simulations of four disky dwarf galaxies with two sets of initial scale heights and two different satellite orbits: the most massive disk (disk1; black), the intermediate disk (disk2; blue), the least massive disk (disk3; red), and the FNX-analog (green). The color and line coding is the same as in Figs. 3 and 4. Note that the b/a and c/a values are relative to the initial value so they can both become greater than 1. |
The difference in the final morphology of the systems can also be seen when fitting an ellipsoid to the stellar mass distribution of the particles in the simulation. We compute the shape tensor 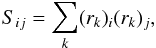 (14)where (rk)j denotes the j-component of the position vector of particle k. The tensor Sij is often used with a normalization by the ellipsiodal radius of the particles within the coordinate system of the ellipsoid (see, e.g., Allgood et al. 2006), but this effect is the subject of debate (Zemp et al. 2011). We do not normalize and therefore effectively give more weight to the outskirts. Figure 9 shows the change in the intermediate/major (b/a; top) and minor/major (c/a; bottom) axis ratios for all particles within ellipsoids with major axes of 1 (left) and 3 (right) kpc h-1. The smaller ellipsoid thus focuses on the change in shape in the inner parts of the remnants, while the panels on the right show the changes in the shape of the total disk (within an ellipsoidal radius of 3 kpc h-1, so including the inner parts as well). Note that in Eq. (14) we do not have to take into account the mass of each particle as the mass of all disk particles is the same.
The top left panel of Fig. 9 shows that most systems have lower b/a axis ratios at the end of the simulation that are due to the presence of bars in the case of the most massive disks. The most extreme cases (both thin disk1s) have final average b/a1 kpc ~ 0.3 and the least massive bar of these simulations (disk1-60-thick) still has a final average b/a = 0.81 within an ellipsoidal radius of 1 kpc h-1. The isolated disk1 evolved on a longer timescale also develops a bar. During the merger the bar greatly increases in mass, however, and has a major axis of around 1 kpc h-1, which extends beyond the half-mass radius of the remnant (r1/2 ~ r1/2;initial ~ 0.8 kpc h-1).
The bar in disk1 is also seen in the final intermediate-to-major-axis ratio within an ellipsoid of 3 kpc h-1 because of its contribution to the inner parts. Although the axis ratios stay close to b/a ~ 1 for disk2 and disk3 there is also substructure in the inner disks of these systems (see Figs. 7 and 8), but not massive enough to define the average shape of the disks. However, the final b/a ratio at larger radii is less axisymmetric for both of the disk3s with the satellite on the 60 degree orbit, probably because of the significant tilt of the disk during the merger and the resulting warps.
All Fornax-analogs are no longer axisymmetric in the final snapshot as their intermediate-to-major-axis ratio drops to b/a ~ 0.8–0.9 (depending on location and experiment). Nevertheless, when these relatively small changes in the intermediate-to-major-axis ratios are compared to the changes in the minor-to-major-axis ratios one notices that the shapes of all the FNX-analog systems evolve drastically. Overall, these changes in the minor-to-major-axis ratios are very diverse. The bottom panels of Fig. 9 show that some of the FNX-analog systems would be classified as spheroidal or elliptical; their total minor-to-major-axis ratios increase sharply with factors ranging from almost 3 to almost 10. The initial c/a ~ 0.06 (thinner system) and c/a ~ 0.16 (thicker system) result after a minor merger in final values in the range c/a ~ 0.31–0.73.
The axis ratios plotted in Fig. 9 are with respect to the values after relaxation, before the merger, and thus show that the heating of the disks is due to the minor merger and not to numerical artifacts. The thickening due to relaxation of the initial disks is very minor. The disk1s and disk2s have relaxed axis ratios of c/a ~ 0.075 for the thin disks and c/a ~ 0.115 for the thick disks instead of the initial c/a ~ 0.05 (thin) and c/a ~ 0.10 (thick). As a second check we simulated the disks without a merger over the same complete time period, and found no significant changes. As explained earlier, only disk1 develops a massive bar in isolation.
Both the initially thinner and thicker FNX-analog systems merging with the satellite on the 60 degree orbit have c/a> 0.5 while also having lower b/a-values: c/aFNX − 60 − thin ~ 0.55 compared to b/aFNX − 60 − thin ~ 0.85 and c/aFNX − 60 − thick ~ 0.73 compared to b/aFNX − 60 − thick ~ 0.85. The FNX-analog systems with the satellite on a 30 degree orbit have lower final global minor-to-major-axis ratios, c/a ~ 0.31 for the initial thinner and c/a = 0.45 for the initial thicker system, and are slightly triaxial with b/a ~ 0.90. This means that this object viewed from a random angle has an observational axis ratio that is greater than or equal to 0.3.
For all systems, disk1, disk2, disk3, and FNX-analog, the thinner disk experiences more thickening in a relative (but not absolute) sense than those that were thick initially. This holds for the final and initial minor-to-major-axis ratios for just the inner regions and for the whole remnant. For disk1, especially the initially thinner disks, the increase in disk height is probably dominated by the formation of the substantial bars. Otherwise c/a increases more for the less massive disks than for the more massive disks; the increase in c/a is inversely ranked by mass. This reflects the fact that a less massive disk is more prone to significant perturbations by the incoming satellite and so dwarf galaxies with smaller baryon fractions are more easily disturbed and will more often have thickened or perturbed morphologies (as also shown in Figs. 5 to 8).
3.1.3. Radial and vertical density profiles
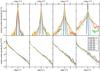 |
Fig. 10 Evolution of the vertical and radial density profiles for the different thin disks (z0 = 0.1Rd initially) with the satellite on the 60 degree orbit: disk1 (left), disk2 (middle left), disk3 (middle right), and FNX-analog (right). Density profiles (solid lines) are shown for the initial relaxed disk (0 Gyr) up to 6 Gyr later (about 5 Gyr after the first pericentric passage of the satellite) in steps of 1 Gyr. The dotted lines in the top row show the maximum likelihood sech2 profiles; in the bottom row the same for an exponential profile, taking into account all disk particles. |
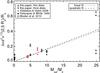 |
Fig. 11 Change in vertical second order moment of all star particles located near 2.5Rd (the solar radius in a Milky Way-like host), normalized by disk scale length, versus the ratio of satellite mass to host disk mass for all simulations presented here. In addition we have included results from the literature for similar studies of minor mergers. The FNX-analog simulations are not presented because they fall above the vertical range of this plot. The red symbols indicate that the values were read off from a plot and not taken from a table in the paper in question. Triangles pointing upward denote initially thinner disks, while the initially thicker disk are denoted by downward pointing triangles. The dotted and dashed lines show a linear and quadratic fit, respectively, to the mean values of all Msat/Mdisk bins. |
Estimates for the scale height z0.
In the top panels of Fig. 10 we plot the vertical density profiles of the 60-thin simulations for all systems. We define the plane of the disk to be perpendicular to the total angular momentum vector of all stellar particles within the half-mass radius of the stellar remnant. The vertical density profiles of the remnant systems are not well described by the initial sech2 function. This can be seen through a comparison to the dotted lines which correspond to a maximum likelihood fit to a sech2 profile.
The top right panel shows the density profile of the initially thinner FNX-analog system during the merger simulation with the satellite on the orbit with an inclination of 60 degrees. After 1 Gyr there are already significant deviations from a sech2 profile. The second panel in the top row shows that for disk2-thin-60 the vertical density profiles broadens, but can still be approximately described by a sech2 function even close to the time of the merger itself (around 1–2 Gyr) and at the end of the simulation (6 Gyr). The top left panel shows that for disk1 the disk thickens more after the actual merger and that the changes in the vertical density profile are strong because of the formation of a massive bar. The disk3 (top row, middle right panel) has a significant amount of mass at large radii that corresponds to the extended envelope seen in Fig. 6 in all disk3 simulations after first pericenter, and this renders a much worse sech2 fit. For disk2 and disk1 this is much less the case, although as stated earlier a sech2 functional form does not accurately reproduce the vertical structure of our remnants.
The progressively worse fits to the sech2 function, going from disk1 to FNX-analog are due to the increased importance of extra-planar material, which is manifested in extended wings. One can argue that just as in the case of Milky Way-like simulations discussed in the literature, a second thicker component has formed as a result of the merger.
The bottom panels of Fig. 10 show the radial surface density profiles with time in steps of 1 Gyr. Note the significant disturbance in all disks around the time of first pericenter (blue lines). The lower mass disks have some spiral structures initially and fall off more steeply than exponential profiles in the outskirts at later times. The most massive disk (disk1; leftmost panel in Fig. 10), on the other hand, shows a growing overdensity in the very center which corresponds to the massive bar forming in the inner parts of these remnants. Even the remnant of the FNX-analog can still be reasonably well fitted by a radial exponential profile as indicated by the dotted lines.
3.1.4. Comparison to other work on disk thickening
We compare our results of the thickening of disks due to minor mergers with a number of results from the literature. To this end we measure the thickness of our systems between 2 and 3 disk scale lengths (which would correspond to the solar neighborhood in the case of a Milky Way-like simulation). We compute two commonly used estimates of the thickness of a disk: the standard deviation of the vertical distribution of particles, ⟨ z2 ⟩ 1/2 (Velazquez & White 1999), and a Bayesian maximum likelihood estimate assuming a sech2-profile.
If the vertical density profiles are accurately described by the function  then
then  . Therefore, a comparison of these two different measures gives an indication of how far the disk still follows a sech2. The results can be found in Table 2. Here we list the initial values for the scale heights of the disks (after relaxation in isolation), as well as those after the merger. For disk1 and disk2 the thinner disks depict a larger increase in scale height than their corresponding thicker disks (although in an absolute sense the latter are thicker at the final time), and that the scale heights of all disk1s increase significantly as a result of massive bars. For the lower mass disks the mean scale height increases most in simulations with the satellite on the 60 degree orbit.
Figure 11 shows the ratio of the difference in the vertical second moment Δ ⟨ z2 ⟩ 1/2 to the initial scale length of the disk versus the ratio of the total mass of the satellite and the mass of the disk. In this figure we have added results from minor merger simulations from the literature, specifically from Velazquez & White (1999), Villalobos & Helmi (2008), and Moster et al. (2010). To make the information provided by all these studies uniform, we derive Δ ⟨ z2 ⟩ 1/2 assuming that the vertical density distribution in the simulations from Villalobos & Helmi (2008) and Moster et al. (2010) is well represented by a sech2 function. The four FNX-analog-disks have such a large increase in ⟨ z2 ⟩ 1/2 that they fall completely outside the plot range (see Table 2).
It has been proposed that the heating in disk galaxies caused by minor mergers depends linearly (Toth & Ostriker 1992; Mo et al. 2010) or quadratically (Hopkins et al. 2008) on the ratio Msat/Mdisk. With the exception of this paper, all studies so far have modeled Milky Way-like disk galaxies disturbed by satellites that are small or at best comparable with respect to the disk. The mergers discussed here, however, have Msat/MDM;host constant and vary Mdisk, with Mdisk ≪ Msat.
We apply a least squares fit to all data points in Fig. 11 for a quadratic (with the coefficient of the quadratic part forced to be positive as predicted by Hopkins et al. 2008) and a linear dependence on Msat/Mdisk. We use the mean values of the points per mass bin and exclude the extreme points of the FNX-analogs. For our simulations the relation now solely depends on Msat/Mdisk. As can be seen from Fig. 11 the scatter is very large, the obtained fits are quite similar, and unsurprisingly neither is very good. The reason for this is that the heating of stellar disks by infalling satellites does not solely depend on their mass ratios. For example, the initial structure of the disk and the presence of gas in the disk, as well as the orbit of the satellite, have a very significant influence on the response of the disk on the infalling satellite (e.g., Moster et al. 2010). Moreover, the measurement of heating in different studies is done using different methods and assumptions. Although we have attempted to homogenize this as much as possible, additional scatter is introduced (e.g., in the case of the FNX-analogs the disk is fully destroyed and the characterization by a sech2 is very poor). From Fig. 11 it is clear that these uncertainties dominate for the larger Msat/Mdisk ratios.
The parameters of the linear term are almost the same for both the linear and quadratic dependence on Msat/Mdisk (with the coefficient of the quadratic term six orders of magnitude smaller than the coefficient of the linear term: y = 0.016x versus y = 0.017x + 9.1e-10x2). Although this study is limited in number, and the scatter in the relation is very significant, it suggests that to the first order the heating of galactic disks by minor mergers as a function of Msat/Mdisk can be sufficiently described with a linear model.
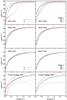 |
Fig. 12 Circular velocity (dashed lines) and average rotation (dotted lines) of all the disks before the merger (black) and 6 Gyr later for both orbits (30-degree inclination in blue, and 60-degree inclination in red). In all cases the disks are first aligned such that the total angular momentum vector of all particles within the half-mass radius of the disk is perpendicular to the plane in which the average rotational velocity is measured. All particles considered have | z | < 0.05 kpc h-1 and the bins have a variable bin size, but a fixed number of 400 particles each. |
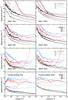 |
Fig. 13 Radial (solid lines), vertical (dashed lines), and azimuthal (dotted lines) velocity dispersions of all the disks before the merger (black) and 6 Gyr later for both orbits (30-degree inclination in blue, and 60-degree inclination in red). In all cases the disks are first aligned such that the total angular momentum vector of all particles within the half-mass radius of the disk is perpendicular to the plane in which the velocity dispersions are measured. All particles considered have | z | < 0.05 kpc h-1 and the bins have a variable bin size, but a fixed number of 400 particles each. |
3.2. Kinematical changes
The changes induced by the merger events on the rotational velocity and velocity dispersions of the host galaxies can be seen in Figs. 12 and 13. Note that in all cases the circular velocity has increased owing to the mass deposited by the accreted satellite in the inner parts of the halo. For all the disk1s additional changes are mostly due to the massive bar that forms in these systems. The bar leads to the characteristic linear vφ(R) relation of solid body rotation, and a steepening of the circular velocity curves for small R. For disk2 and disk3 the rotational velocities do not change significantly. In the case of disk3 the rotational velocity drops in the outer parts where the disk is most perturbed. For the FNX-analog the evolution is stronger and the rotational velocity has clearly decreased. In the initially thicker disk cases, the peak rotation in the region within the stellar half-mass radius (~15 km s-1 and ~12 m s-1) is very close in magnitude to the average line-of-sight velocity dispersions in the same region (~10–14 km s-1 with  ). For the initially thinner disks, the peak rotation is only a few km s-1 higher (~16 km s-1 and ~18 km s-1). When observing such a system, and depending on the spatial extent of the data, one could probably conclude there is hardly any rotation present.
All velocity dispersions increase for all the disks. For disk1 and disk2 the increase is larger in the inner parts than in the outskirts, especially for disk1-thin due to the bars. The disk3s on the other hand show a much larger increase in the outer parts which probably reflects the significant number of particles that are in the envelope that formed during the merger. Therefore, particles at one cylindrical radius now populate a much wider range of velocities. Especially σz, sometimes also considered a measure of the heating in stellar disks, increases dramatically in the outskirts of the disk. Unfortunately, because of the low surface brightness in the outskirts it could be very difficult to measure this signature in dwarf galaxies observationally.
For the Fornax-analogs the velocity dispersions in the inner parts of the disk more than double and in some cases even triple with respect to the values before the merger. Furthermore, the velocity dispersions are more or less constant over the whole disk. Note that, as expected, for both the thin and thick FNX-analog the radial and azimuthal dispersions increase more for the 30-degree merger, but that the vertical dispersion increases more in the outer disk for the 60-degree merger.
The resulting kinematics can be compared to literature values of the dwarfs in the Local Group as most recently summarized in McConnachie (2012). The Fornax dwarf galaxy has an average line-of-sight velocity dispersion of 11.7 km s-1. We can compare this to σl.o.s. for the four different FNX-analog systems presented in this paper. We compute σl.o.s. averaged within 1.4 kpc, which is the half-mass radius of the FNX-analog remnants, and about 2 times the half-light radius of the Fornax dwarf galaxy, and find values in the range ~10–14 km s-1. These values are higher than similarly calculated line-of-sight velocity dispersions for the disk3s (σl.o.s. ~ 7 − 12 km s-1), while the rotational velocity of disk3 is more than twice that of FNX-analog. For the Fornax-analogs vφ ~ σl.o.s. around the half-mass radius and vφ<σl.o.s. for smaller R. Therefore, we can say that an initially disky dwarf galaxy similar to the Fornax-analog systems presented here can be transformed kinematically and morphologically by a minor merger with its own dark satellite to a more spheroidal system, akin to those observed.
4. Discussion
We have presented a series of simulations of minor mergers of dwarf galaxies and their own satellites. The satellites are presumed to be completely dark and we have shown here that for Msat/Mhost = 0.2 their effect on the morphology and kinematics of the dwarf galaxies can be severe. Moreover, for larger satellite-to-disk-mass ratios the impact of the merger is notably stronger. Therefore, it might be essential to take into account such events when considering the evolution of dwarf galaxies.
When setting up the simulations of the dwarf galaxies in the simulations presented in this paper we were faced with a number of problems. We found that the standard methods used for setting up simulations of Milky Way-like galaxies could not be applied. The velocity structure especially needed to be revised. As a result of the dominance of the halo potential at all radii, new assumptions have to be made to solve for the velocity structure. In this paper we decided to use the epicyclic approximation as long as it gives physical results, and we assume that the azimuthal velocity is continuous from that point inwards. This solution is not ideal and results in an azimuthal velocity dispersion that has an unphysical bump. This bump disappears, however, when relaxing the disks, and the resulting rotation and dispersions are satisfactory. A possible improvement could be to fit a spline instead of a second order polynomial as we have done.
The concentration of the host halo plays a significant role in how much damage is induced by the satellite, as shown by comparing the disk3 and FNX-analog experiments. A dwarf galaxy with a dark matter density profile that is shallower than seen in dark-matter-only simulations (as perhaps expected because of baryonic effects Mashchenko et al. 2008; Governato et al. 2010, 2012; Pontzen & Governato 2012; Teyssier et al. 2013) is therefore much more vulnerable to minor merger events by dark satellites.
It may be argued that some of the satellites in our simulations (e.g., in the case of disk1, disk2, and disk3) are on the verge of being too massive to be dark. However, the virial mass below which halos are expected to be devoid of stars does not have a sharp transition, but is expected to be around 108–109M⊙ (Gnedin 2000; Hoeft et al. 2006; Crain et al. 2007; Okamoto et al. 2008; Gnedin et al. 2009; Li et al. 2010; Sawala et al. 2013; but see also Taylor & Webster 2005; Warren et al. 2007). If the satellite contained a small amount of baryons we might expect a similar result as in the case that the completely dark satellite would be more concentrated, because for the smallest halos the effects of baryons appear to be small (e.g., Governato et al. 2012). We have tested cases with different dark matter halo concentrations for the dark satellite, and in line with our expectations a more concentrated satellite survives longer and therefore has a stronger effect on (or causes more thickening of) the disk of the host dwarf galaxy.
On the other hand, although we vary the disk mass fraction to lower values (especially disk3) as is expected for dwarf galaxies, one could argue that our disks are still too massive for their halo mass. Following the stellar mass-halo mass relations from either abundance matching (e.g., Moster et al. 2013), or from hydrodynamical cosmological simulations (e.g., Sawala et al. 2014), our lowest stellar disk mass fraction should be a factor of 2–5 smaller. For such a disk the effect of the merger would increase significantly.
An important question is how often encounters such as those described in this paper will take place. Although the subhalo mass function is almost self-similar and independent of host halo mass, higher satellite-to-disk-mass ratios lead to more disruptive events. So the expected fraction for significantly disruptive minor mergers for dwarf galaxies is not only given by the (Msat:Mhost = 1:5) fraction, but also by the fraction for minor encounters with Msat/Mdisk> 1. According to Deason et al. (2014) a significant fraction of the dwarf galaxies in the Local Group (10% for satellites and 15–20% for field dwarfs) have experienced major mergers with stellar mass ratios >0.1. Including dark satellites and broadening the analysis to minor mergers with small pericenters will increase the estimates of dwarf galaxies affected by mergers. Helmi et al. (2012) show that as the galaxy efficiency or disk mass fraction decreases substantially for lower mass halos this implies that such an encounter is much more common than previously expected. They estimate that dwarf galaxies similar to disk3 or FNX-analog experience on average 1.5 encounters over a Hubble time where Msat/Mdisk ≃ 1 and only taking into account encounters where the pericenter lies within 30% of the virial radius of the host (dwarf galaxy) halo. A small first pericentric radius ensures a short timescale for the merger and also a large impact. We plan to further quantify the expected significant merger fraction in future work.
Small galaxies in isolation are generally gas rich, an element we have not considered in our simulations. Previous work has shown that in mergers the presence of gas influences the response of the stellar component to the tidal forces (Moster et al. 2010; Naab et al. 2006), and the torques that arise during the merger can cause an accumulation of gas close to the center giving rise to an increase in star formation or even a starburst (Di Matteo et al. 2007; Teyssier et al. 2010). We plan to report on simulations of dwarf galaxies including gas in the disk and dark satellites in Starkenburg et al. (in prep.).
5. Conclusions
We have studied the response of disky dwarf galaxies to a 1:5 minor merger with a dark satellite using a suite of N-body simulations. Our host halos have masses of 1010M⊙h-1 and 4 × 10⁹M⊙h-1 and the baryon fractions that range from 0.008 to 0.04 are assumed to be in a stellar disk. The satellite is completely dark and has a prograde radial orbit with first pericenter within the half-mass radius of the disk and an inclination of either 30 or 60 degrees.
The structure and kinematics of the disks in our simulations are initialized following a careful adaptation of standard methods to this dwarf scale. We present a method to solve the velocity structure assuming that the potential is dominated by the halo at all radii and only using the epicyclic frequency up to the point where this approximation gives physical results. The resulting velocity profiles after relaxing the disk in isolation are smooth and stable.
In our experiments, the satellite loses mass very quickly while plunging into the denser central regions of the host and is completely disrupted after two to three pericenter passages. All dwarf galaxy disks are significantly disturbed by the minor merger. The most massive disks develop strong bars and thicken because of these bars, and stellar envelopes are formed around the disks. Smaller disks form more extended envelopes with a preferential orientations. This can be seen as tidal debris in what would be the inner stellar halo of the dwarf galaxy. However, in our simulations these tidal features are made of material from the disk instead of in the infalling satellite as is often assumed for observed shells, streams, and plumes.
Our suite of simulations shows that the disk mass fraction is an important parameter in minor mergers and that the disk thickens more when the ratio Msat/Mdisk increases. For the lowest mass disks the final remnants’ vertical structure can no longer be described by a sech2 function. These systems are spheroidal and their radial profiles follow an exponential form. In these experiments, the azimuthal velocities are comparable in magnitude or even lower than the line-of-sight velocity dispersions. The remnant system has properties similar to the Fornax dwarf spheroidal, indicating that mergers between dwarfs and dark satellites may be an additional channel for the formation of small spheroidal systems.
This means that the radial and vertical velocity dispersions no longer have the same ratio throughout the disk, but that the proportionality factor f changes with radius, f = fR = σR/σz, for the inner part of the disk.
Acknowledgments
We are grateful to Laura Sales for many useful discussions and to Carlos Vera-Ciro, Alvaro Villalobos and Volker Springel for providing code. AH acknowledges financial support from the European Research Council under ERC-StG grant GALACTICA-240271.
References
- Allgood, B., Flores, R. A., Primack, J. R., et al. 2006, MNRAS, 367, 1781 [NASA ADS] [CrossRef] [Google Scholar]
- Amorisco, N. C., Evans, N. W., & van de Ven, G. 2014, Nature, 507, 335 [NASA ADS] [CrossRef] [Google Scholar]
- Angulo, R. E., Lacey, C. G., Baugh, C. M., & Frenk, C. S. 2009, MNRAS, 399, 983 [NASA ADS] [CrossRef] [Google Scholar]
- Ashley, T., Simpson, C. E., & Elmegreen, B. G. 2013, AJ, 146, 42 [NASA ADS] [CrossRef] [Google Scholar]
- Athanassoula, E. 2003, MNRAS, 341, 1179 [NASA ADS] [CrossRef] [Google Scholar]
- Athanassoula, E., & Sellwood, J. A. 1986, MNRAS, 221, 213 [NASA ADS] [CrossRef] [Google Scholar]
- Athanassoula, E., Fady, E., Lambert, J. C., & Bosma, A. 2000, MNRAS, 314, 475 [NASA ADS] [CrossRef] [Google Scholar]
- Bekki, K., & Chiba, M. 2006, ApJ, 637, L97 [NASA ADS] [CrossRef] [Google Scholar]
- Benson, A. J., Lacey, C. G., Frenk, C. S., Cole, S., & Baugh, C. M. 2004, in Satellites and Tidal Streams, eds. F. Prada, D. Martinez Delgado, & T. J. Mahoney, ASP Conf. Ser., 327, 125 [Google Scholar]
- Bergvall, N. 2012, in Star Forming Dwarf Galaxies, eds. P. Papaderos, S. Recchi, & G. Hensler, 175 [Google Scholar]
- Binney, J., & Merrifield, M. 1998, Galactic astronomy (Princeton University Press) [Google Scholar]
- Binney, J., & Tremaine, S. 1987, Galactic dynamics (Princeton University Press) [Google Scholar]
- Blanton, M. R., Dalcanton, J., Eisenstein, D., et al. 2001, AJ, 121, 2358 [NASA ADS] [CrossRef] [Google Scholar]
- Breddels, M. A., & Helmi, A. 2013, A&A, 558, A35 [NASA ADS] [CrossRef] [EDP Sciences] [Google Scholar]
- Cannon, J. M., Johnson, M., McQuinn, K. B. W., et al. 2014, ApJ, 787, L1 [NASA ADS] [CrossRef] [Google Scholar]
- Chakrabarti, S., & Blitz, L. 2009, MNRAS, 399, L118 [NASA ADS] [CrossRef] [Google Scholar]
- Coleman, M., Da Costa, G. S., Bland-Hawthorn, J., et al. 2004, AJ, 127, 832 [NASA ADS] [CrossRef] [Google Scholar]
- Crain, R. A., Eke, V. R., Frenk, C. S., et al. 2007, MNRAS, 377, 41 [NASA ADS] [CrossRef] [Google Scholar]
- Dalla Vecchia, C., & Schaye, J. 2008, MNRAS, 387, 1431 [NASA ADS] [CrossRef] [Google Scholar]
- Deason, A., Wetzel, A., & Garrison-Kimmel, S. 2014, ApJ, 794, 115 [NASA ADS] [CrossRef] [Google Scholar]
- Di Matteo, P., Combes, F., Melchior, A.-L., & Semelin, B. 2007, A&A, 468, 61 [NASA ADS] [CrossRef] [EDP Sciences] [Google Scholar]
- Font, A. S., Navarro, J. F., Stadel, J., & Quinn, T. 2001, ApJ, 563, L1 [NASA ADS] [CrossRef] [Google Scholar]
- Gerssen, J., Kuijken, K., & Merrifield, M. R. 1997, MNRAS, 288, 618 [NASA ADS] [CrossRef] [Google Scholar]
- Gnedin, N. Y. 2000, ApJ, 542, 535 [NASA ADS] [CrossRef] [Google Scholar]
- Gnedin, N. Y., Tassis, K., & Kravtsov, A. V. 2009, ApJ, 697, 55 [NASA ADS] [CrossRef] [Google Scholar]
- Governato, F., Brook, C., Mayer, L., et al. 2010, Nature, 463, 203 [NASA ADS] [CrossRef] [PubMed] [Google Scholar]
- Governato, F., Zolotov, A., Pontzen, A., et al. 2012, MNRAS, 422, 1231 [NASA ADS] [CrossRef] [Google Scholar]
- Helmi, A., Sales, L. V., Starkenburg, E., et al. 2012, ApJ, 758, L5 [NASA ADS] [CrossRef] [Google Scholar]
- Hernquist, L. 1990, ApJ, 356, 359 [NASA ADS] [CrossRef] [Google Scholar]
- Hernquist, L. 1993, ApJS, 86, 389 [NASA ADS] [CrossRef] [Google Scholar]
- Hoeft, M., Yepes, G., Gottlöber, S., & Springel, V. 2006, MNRAS, 371, 401 [NASA ADS] [CrossRef] [Google Scholar]
- Hopkins, P. F., Hernquist, L., Cox, T. J., Younger, J. D., & Besla, G. 2008, ApJ, 688, 757 [NASA ADS] [CrossRef] [Google Scholar]
- Hunter, D. A., Elmegreen, B. G., Oh, S.-H., et al. 2011, AJ, 142, 121 [NASA ADS] [CrossRef] [Google Scholar]
- Kannan, R., Macciò, A. V., Pasquali, A., Moster, B. P., & Walter, F. 2012, ApJ, 746, 10 [NASA ADS] [CrossRef] [Google Scholar]
- Karachentsev, I. D., Karachentseva, V. E., & Huchtmeier, W. K. 2006, A&A, 451, 817 [NASA ADS] [CrossRef] [EDP Sciences] [Google Scholar]
- Karachentsev, I. D., Karachentseva, V. E., Huchtmeier, W. K., Makarov, D. I., & Kaisin, S. S. 2008, in Dark Galaxies and Lost Baryons, eds. J. I. Davies & M. J. Disney, IAU Symp. 244, 235 [Google Scholar]
- Karachentsev, I. D., Makarov, D. I., Karachentseva, V. E., & Melnyk, O. V. 2011, Astrophys. Bull., 66, 1 [NASA ADS] [CrossRef] [Google Scholar]
- Karachentsev, I. D., Makarova, L. N., Makarov, D. I., Tully, R. B., & Rizzi, L. 2015, MNRAS, 447, L85 [NASA ADS] [CrossRef] [Google Scholar]
- Kaufmann, T., Wheeler, C., & Bullock, J. S. 2007, MNRAS, 382, 1187 [NASA ADS] [CrossRef] [Google Scholar]
- Kazantzidis, S., Magorrian, J., & Moore, B. 2004, ApJ, 601, 37 [NASA ADS] [CrossRef] [Google Scholar]
- Kazantzidis, S., Łokas, E. L., Mayer, L., Knebe, A., & Klimentowski, J. 2011, ApJ, 740, L24 [NASA ADS] [CrossRef] [Google Scholar]
- Kim, J. H., Peirani, S., Kim, S., et al. 2014, ApJ, 789, 90 [NASA ADS] [CrossRef] [Google Scholar]
- Klimentowski, J., Łokas, E. L., Knebe, A., et al. 2010, MNRAS, 402, 1899 [NASA ADS] [CrossRef] [Google Scholar]
- Klypin, A., Kravtsov, A. V., Valenzuela, O., & Prada, F. 1999, ApJ, 522, 82 [Google Scholar]
- Kormendy, J., & Freeman, K. C. 2014, in IAU Symp. 311, eds. M. Cappellari, & S. Courteau (Cambridge Univ. Press), in press [arXiv:1407.7876] [Google Scholar]
- Lelli, F., Verheijen, M., & Fraternali, F. 2014, MNRAS, 445, 1694 [NASA ADS] [CrossRef] [Google Scholar]
- Li, Y.-S., De Lucia, G., & Helmi, A. 2010, MNRAS, 401, 2036 [NASA ADS] [CrossRef] [Google Scholar]
- Łokas, E. L., Ebrová, I., Pino, A. d., & Semczuk, M. 2014, MNRAS, 445, L6 [NASA ADS] [CrossRef] [Google Scholar]
- Lora, V., Just, A., Sánchez-Salcedo, F. J., & Grebel, E. K. 2012, ApJ, 757, 87 [NASA ADS] [CrossRef] [Google Scholar]
- Macciò, A. V., Dutton, A. A., & van den Bosch, F. C. 2008, MNRAS, 391, 1940 [NASA ADS] [CrossRef] [Google Scholar]
- Makarov, D., Makarova, L., Sharina, M., et al. 2012, MNRAS, 425, 709 [NASA ADS] [CrossRef] [Google Scholar]
- Martínez-Delgado, D., Romanowsky, A. J., Gabany, R. J., et al. 2012, ApJ, 748, L24 [NASA ADS] [CrossRef] [Google Scholar]
- Mashchenko, S., Wadsley, J., & Couchman, H. M. P. 2008, Science, 319, 174 [NASA ADS] [CrossRef] [Google Scholar]
- Mayer, L., Governato, F., Colpi, M., et al. 2001, ApJ, 547, L123 [NASA ADS] [CrossRef] [Google Scholar]
- Mayer, L., Mastropietro, C., Wadsley, J., Stadel, J., & Moore, B. 2006, MNRAS, 369, 1021 [NASA ADS] [CrossRef] [Google Scholar]
- McConnachie, A. W. 2012, AJ, 144, 4 [NASA ADS] [CrossRef] [Google Scholar]
- Mo, H. J., Mao, S., & White, S. D. M. 1998, MNRAS, 295, 319 [Google Scholar]
- Mo, H., van den Bosch, F. C., & White, S. 2010, Galaxy Formation and Evolution (Cambridge University Press) [Google Scholar]
- Moore, B., Ghigna, S., Governato, F., et al. 1999, ApJ, 524, L19 [Google Scholar]
- Moster, B. P., Macciò, A. V., Somerville, R. S., Johansson, P. H., & Naab, T. 2010, MNRAS, 403, 1009 [NASA ADS] [CrossRef] [Google Scholar]
- Moster, B. P., Naab, T., & White, S. D. M. 2013, MNRAS, 428, 3121 [NASA ADS] [CrossRef] [Google Scholar]
- Muñoz-Cuartas, J. C., Macciò, A. V., Gottlöber, S., & Dutton, A. A. 2011, MNRAS, 411, 584 [NASA ADS] [CrossRef] [Google Scholar]
- Naab, T., Jesseit, R., & Burkert, A. 2006, MNRAS, 372, 839 [NASA ADS] [CrossRef] [Google Scholar]
- Navarro, J. F., Frenk, C. S., & White, S. D. M. 1996, ApJ, 462, 563 [NASA ADS] [CrossRef] [Google Scholar]
- Nidever, D. L., Ashley, T., Slater, C. T., et al. 2013, ApJ, 779, L15 [NASA ADS] [CrossRef] [Google Scholar]
- Okamoto, T., Gao, L., & Theuns, T. 2008, MNRAS, 390, 920 [NASA ADS] [CrossRef] [Google Scholar]
- Pontzen, A., & Governato, F. 2012, MNRAS, 421, 3464 [NASA ADS] [CrossRef] [Google Scholar]
- Quinn, P. J., Hernquist, L., & Fullagar, D. P. 1993, ApJ, 403, 74 [NASA ADS] [CrossRef] [Google Scholar]
- Robertson, B. E., & Kravtsov, A. V. 2008, ApJ, 680, 1083 [NASA ADS] [CrossRef] [Google Scholar]
- Sánchez-Janssen, R., Méndez-Abreu, J., & Aguerri, J. A. L. 2010, MNRAS, 406, L65 [NASA ADS] [Google Scholar]
- Sawala, T., Frenk, C. S., Crain, R. A., et al. 2013, MNRAS, 431, 1366 [NASA ADS] [CrossRef] [Google Scholar]
- Sawala, T., Frenk, C. S., Fattahi, A., et al. 2014, MNRAS, submitted [arXiv:1404.3724] [Google Scholar]
- Schaye, J., & Dalla Vecchia, C. 2008, MNRAS, 383, 1210 [NASA ADS] [CrossRef] [EDP Sciences] [Google Scholar]
- Springel, V. 2005, MNRAS, 364, 1105 [NASA ADS] [CrossRef] [Google Scholar]
- Springel, V., Yoshida, N., & White, S. D. M. 2001, New A, 6, 79 [NASA ADS] [CrossRef] [Google Scholar]
- Springel, V., Di Matteo, T., & Hernquist, L. 2005, MNRAS, 361, 776 [NASA ADS] [CrossRef] [Google Scholar]
- Springel, V., Wang, J., Vogelsberger, M., et al. 2008, MNRAS, 391, 1685 [NASA ADS] [CrossRef] [Google Scholar]
- Taylor, E. N., & Webster, R. L. 2005, ApJ, 634, 1067 [NASA ADS] [CrossRef] [Google Scholar]
- Teyssier, R., Chapon, D., & Bournaud, F. 2010, ApJ, 720, L149 [NASA ADS] [CrossRef] [Google Scholar]
- Teyssier, R., Pontzen, A., Dubois, Y., & Read, J. I. 2013, MNRAS, 429, 3068 [NASA ADS] [CrossRef] [Google Scholar]
- Toomre, A. 1964, ApJ, 139, 1217 [NASA ADS] [CrossRef] [Google Scholar]
- Toth, G., & Ostriker, J. P. 1992, ApJ, 389, 5 [NASA ADS] [CrossRef] [Google Scholar]
- van den Bosch, F. C., & Jiang, F. 2014, MNRAS, submitted [arXiv:1403.6835] [Google Scholar]
- van den Bosch, F. C., Tormen, G., & Giocoli, C. 2005, MNRAS, 359, 1029 [NASA ADS] [CrossRef] [Google Scholar]
- van der Kruit, P. C., & Freeman, K. C. 2011, ARA&A, 49, 301 [NASA ADS] [CrossRef] [Google Scholar]
- Velazquez, H., & White, S. D. M. 1999, MNRAS, 304, 254 [NASA ADS] [CrossRef] [Google Scholar]
- Villalobos, Á., & Helmi, A. 2008, MNRAS, 391, 1806 [NASA ADS] [CrossRef] [Google Scholar]
- Wagner-Kaiser, R., De Maio, T., Sarajedini, A., & Chakrabarti, S. 2014, MNRAS, 443, 3260 [NASA ADS] [CrossRef] [Google Scholar]
- Warren, B. E., Jerjen, H., & Koribalski, B. S. 2007, AJ, 134, 1849 [NASA ADS] [CrossRef] [Google Scholar]
- Westfall, K. B., Bershady, M. A., Verheijen, M. A. W., et al. 2011, ApJ, 742, 18 [NASA ADS] [CrossRef] [Google Scholar]
- Yoachim, P., & Dalcanton, J. J. 2006, AJ, 131, 226 [NASA ADS] [CrossRef] [Google Scholar]
- Yozin, C., & Bekki, K. 2012, ApJ, 756, L18 [NASA ADS] [CrossRef] [Google Scholar]
- Zemp, M., Gnedin, O. Y., Gnedin, N. Y., & Kravtsov, A. V. 2011, ApJS, 197, 30 [NASA ADS] [CrossRef] [Google Scholar]
All Tables
All Figures
|
Fig. 1 Circular (dashed lines) and azimuthal (dotted lines) velocities of all the disks when relaxed in isolation: the initial conditions (black), after 1 Gyr (blue), and after 2 Gyr (red). |
| In the text | |
|
Fig. 2 Radial (solid lines), vertical (dashed lines), and azimuthal (dotted lines) velocity dispersions of all the disks when relaxed in isolation: the initial conditions (black), after 1 Gyr (blue), and after 2 Gyr (red). |
| In the text | |
|
Fig. 3 Distance between the center of the dwarf galaxy and its satellite with time for all our simulations: the most massive disk (disk1; black), the intermediate disk (disk2; blue), the least massive disk (disk3; red), and the Fornax-analog (green) for two different inclinations of the satellite orbit with respect to the disk and two sets of initial scale heights as indicated by the top right inset. The orbits show the center of mass trajectory defined by the 100 most bound particles in the satellite. The satellite becomes completely unbound within 2 Gyr. |
| In the text | |
|
Fig. 4 Percentage of mass still bound to the satellite as a function of time for all simulations consisting of four different dwarfs each with two different initial scale heights and two different orbits for the satellite: the most massive disk (disk1; black), the intermediate disk (disk2; blue), the least massive disk (disk3; red), and the Fornax-analog (green). The color and line coding is the same as in Fig. 3 |
| In the text | |
|
Fig. 5 Edge-on and face-on particle distributions of the two most massive disks before the merger (left) up to around 5 Gyr after the first pericenter of the satellite (6 Gyr; right) in steps of 2 Gyr. The orbit of the satellite has an inclination of 60 degrees. The top two panels are for the most massive disk (disk1), and the bottom two for the intermediate disk (disk2), both with z0 = 0.1Rd initially. The first and third rows show the disks edge-on and the second and fourth rows show the disks face-on. To show the features better we plot 5% of the particles within 0.5 kpc h-1, 10% for radii between 0.5 and 1.0 kpc h-1, 20% for radii between 1.0 and 1.5 kpc h-1, and 50% with radii between 1.5 and 2.0 kpc h-1; every particle is plotted for larger radii. |
| In the text | |
|
Fig. 6 Edge-on and face-on particle distributions of the two least massive disks before the merger (left) up to around 5 Gyr after the first pericenter of the satellite (6 Gyr; right) in steps of 2 Gyr. The orbit of the satellite has an inclination of 60 degrees. The top two panels are for the least massive disk (disk3), and the bottom two for the FNX-analog, both with z0 = 0.1Rd initially. The first and third rows show the disks edge-on and the second and fourth rows show the disks face-on. To show the features better we plot 5% of the particles within 0.5 kpc h-1, 10% for radii between 0.5 and 1.0 kpc h-1, 20% with radii between 1.0 and 1.5 kpc h-1, and 50% of the particles with radii between 1.5 ans 2.0 kpc h-1; every particle is plotted for larger radii. |
| In the text | |
|
Fig. 7 Face-on and edge-on surface brightness maps of the final snapshots for the simulations with the two most massive disks (top: disk1, bottom: disk2). The first two columns are for z0 = 0.1Rd, while those on the right have z0 = 0.2Rd initially. The first and third columns are for the 60-degree inclination satellite, the second and fourth for the 30-degree. |
| In the text | |
|
Fig. 8 Face-on and edge-on surface brightness maps of the final snapshots for the simulations with the two least massive disks (top: disk3, bottom: Fornax-analog). The first two columns are for z0 = 0.1Rd, while those on the right have z0 = 0.2Rd for disk3, and z0 = 0.3Rd for the FNX-analog initially. The first and third columns are for the 60-degree inclination satellite, the second and fourth for the 30-degree. |
| In the text | |
|
Fig. 9 Relative increase in principal axis ratios between initial and final snapshot for all merger simulations. Top: intermediate axis over major axis (b/a); bottom: minor axis over major axis (c/a). The axis ratios are computed with the major axis length equal to 1 kpc h-1 for the panels on the left and equal to 3 kpc h-1for the panels on the right. Shown are 16 simulations of four disky dwarf galaxies with two sets of initial scale heights and two different satellite orbits: the most massive disk (disk1; black), the intermediate disk (disk2; blue), the least massive disk (disk3; red), and the FNX-analog (green). The color and line coding is the same as in Figs. 3 and 4. Note that the b/a and c/a values are relative to the initial value so they can both become greater than 1. |
| In the text | |
|
Fig. 10 Evolution of the vertical and radial density profiles for the different thin disks (z0 = 0.1Rd initially) with the satellite on the 60 degree orbit: disk1 (left), disk2 (middle left), disk3 (middle right), and FNX-analog (right). Density profiles (solid lines) are shown for the initial relaxed disk (0 Gyr) up to 6 Gyr later (about 5 Gyr after the first pericentric passage of the satellite) in steps of 1 Gyr. The dotted lines in the top row show the maximum likelihood sech2 profiles; in the bottom row the same for an exponential profile, taking into account all disk particles. |
| In the text | |
|
Fig. 11 Change in vertical second order moment of all star particles located near 2.5Rd (the solar radius in a Milky Way-like host), normalized by disk scale length, versus the ratio of satellite mass to host disk mass for all simulations presented here. In addition we have included results from the literature for similar studies of minor mergers. The FNX-analog simulations are not presented because they fall above the vertical range of this plot. The red symbols indicate that the values were read off from a plot and not taken from a table in the paper in question. Triangles pointing upward denote initially thinner disks, while the initially thicker disk are denoted by downward pointing triangles. The dotted and dashed lines show a linear and quadratic fit, respectively, to the mean values of all Msat/Mdisk bins. |
| In the text | |
|
Fig. 12 Circular velocity (dashed lines) and average rotation (dotted lines) of all the disks before the merger (black) and 6 Gyr later for both orbits (30-degree inclination in blue, and 60-degree inclination in red). In all cases the disks are first aligned such that the total angular momentum vector of all particles within the half-mass radius of the disk is perpendicular to the plane in which the average rotational velocity is measured. All particles considered have | z | < 0.05 kpc h-1 and the bins have a variable bin size, but a fixed number of 400 particles each. |
| In the text | |
|
Fig. 13 Radial (solid lines), vertical (dashed lines), and azimuthal (dotted lines) velocity dispersions of all the disks before the merger (black) and 6 Gyr later for both orbits (30-degree inclination in blue, and 60-degree inclination in red). In all cases the disks are first aligned such that the total angular momentum vector of all particles within the half-mass radius of the disk is perpendicular to the plane in which the velocity dispersions are measured. All particles considered have | z | < 0.05 kpc h-1 and the bins have a variable bin size, but a fixed number of 400 particles each. |
| In the text | |
Current usage metrics show cumulative count of Article Views (full-text article views including HTML views, PDF and ePub downloads, according to the available data) and Abstracts Views on Vision4Press platform.
Data correspond to usage on the plateform after 2015. The current usage metrics is available 48-96 hours after online publication and is updated daily on week days.
Initial download of the metrics may take a while.