Fig. 9
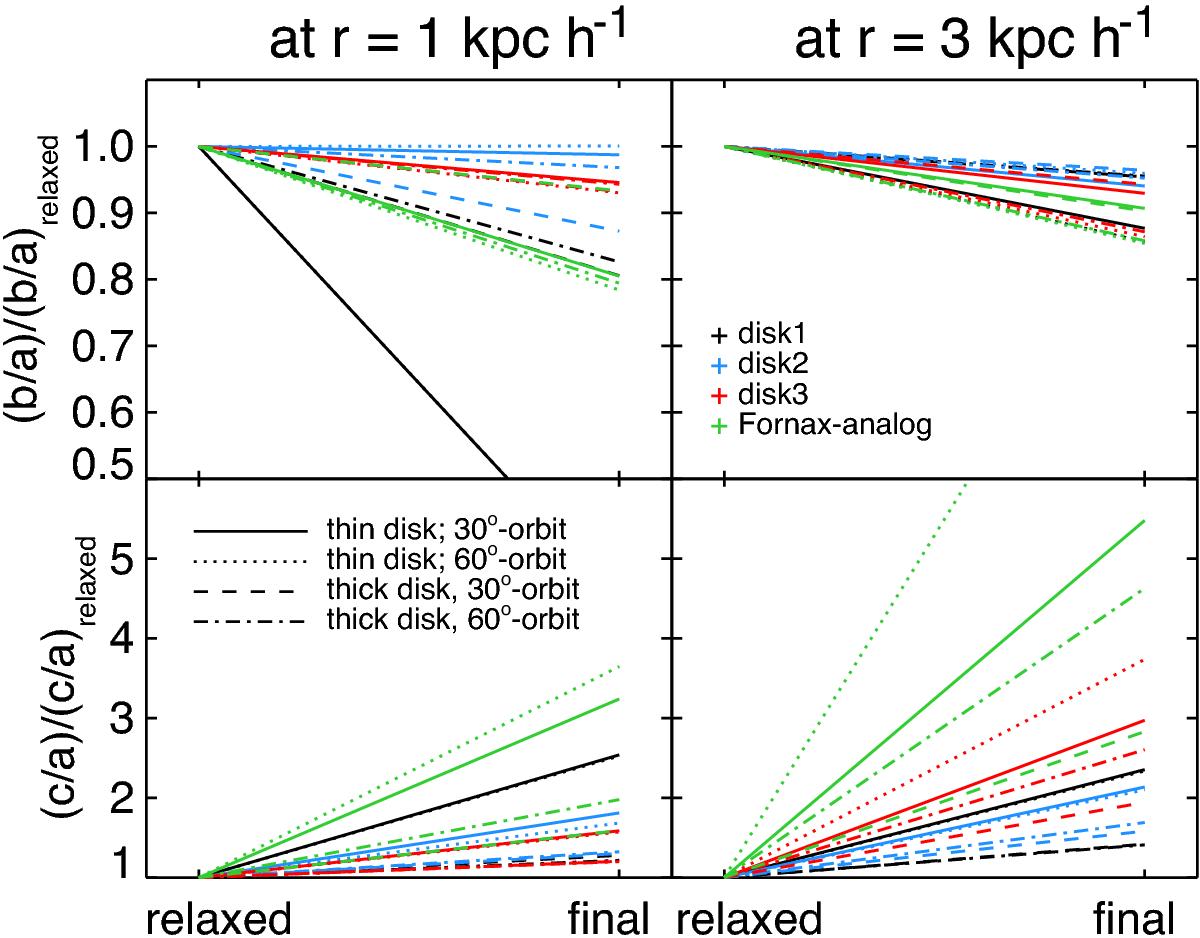
Relative increase in principal axis ratios between initial and final snapshot for all merger simulations. Top: intermediate axis over major axis (b/a); bottom: minor axis over major axis (c/a). The axis ratios are computed with the major axis length equal to 1 kpc h-1 for the panels on the left and equal to 3 kpc h-1for the panels on the right. Shown are 16 simulations of four disky dwarf galaxies with two sets of initial scale heights and two different satellite orbits: the most massive disk (disk1; black), the intermediate disk (disk2; blue), the least massive disk (disk3; red), and the FNX-analog (green). The color and line coding is the same as in Figs. 3 and 4. Note that the b/a and c/a values are relative to the initial value so they can both become greater than 1.
Current usage metrics show cumulative count of Article Views (full-text article views including HTML views, PDF and ePub downloads, according to the available data) and Abstracts Views on Vision4Press platform.
Data correspond to usage on the plateform after 2015. The current usage metrics is available 48-96 hours after online publication and is updated daily on week days.
Initial download of the metrics may take a while.