Fig. 10
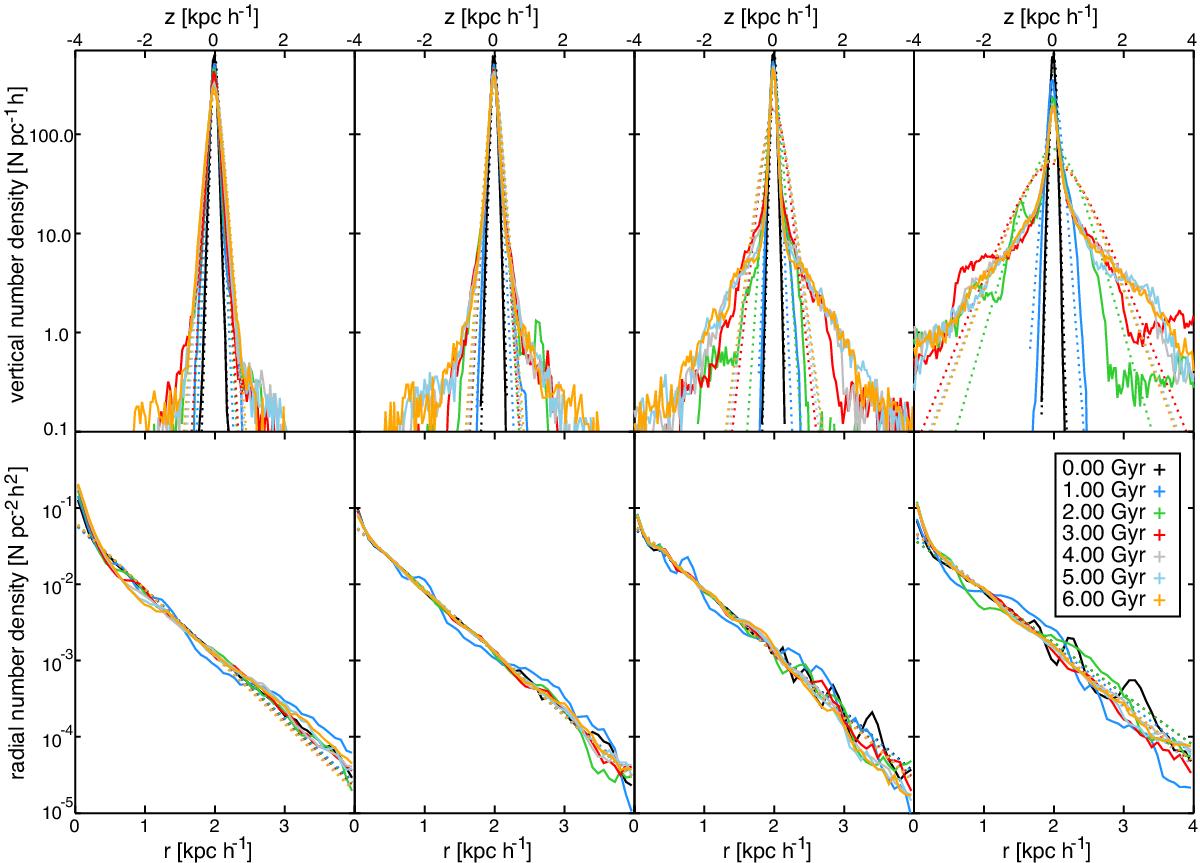
Evolution of the vertical and radial density profiles for the different thin disks (z0 = 0.1Rd initially) with the satellite on the 60 degree orbit: disk1 (left), disk2 (middle left), disk3 (middle right), and FNX-analog (right). Density profiles (solid lines) are shown for the initial relaxed disk (0 Gyr) up to 6 Gyr later (about 5 Gyr after the first pericentric passage of the satellite) in steps of 1 Gyr. The dotted lines in the top row show the maximum likelihood sech2 profiles; in the bottom row the same for an exponential profile, taking into account all disk particles.
Current usage metrics show cumulative count of Article Views (full-text article views including HTML views, PDF and ePub downloads, according to the available data) and Abstracts Views on Vision4Press platform.
Data correspond to usage on the plateform after 2015. The current usage metrics is available 48-96 hours after online publication and is updated daily on week days.
Initial download of the metrics may take a while.