Fig. 11
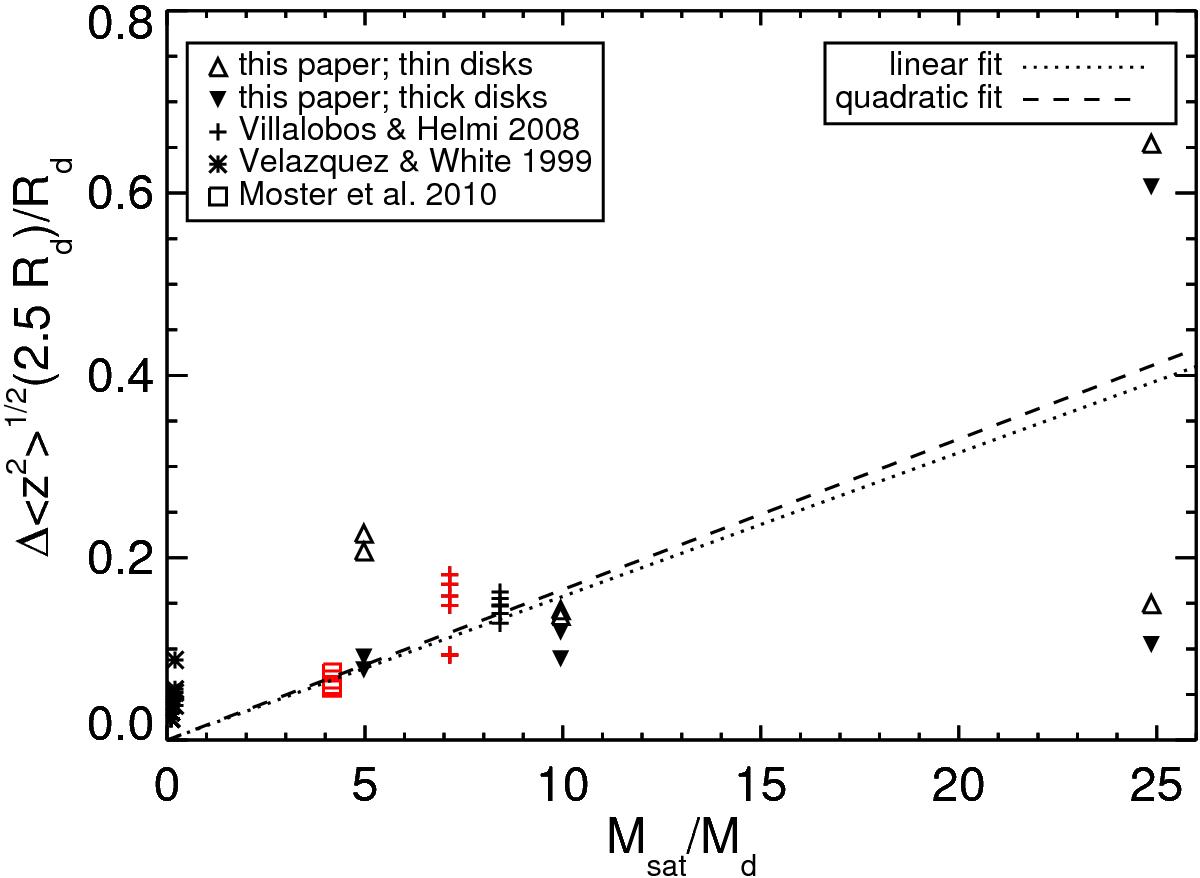
Change in vertical second order moment of all star particles located near 2.5Rd (the solar radius in a Milky Way-like host), normalized by disk scale length, versus the ratio of satellite mass to host disk mass for all simulations presented here. In addition we have included results from the literature for similar studies of minor mergers. The FNX-analog simulations are not presented because they fall above the vertical range of this plot. The red symbols indicate that the values were read off from a plot and not taken from a table in the paper in question. Triangles pointing upward denote initially thinner disks, while the initially thicker disk are denoted by downward pointing triangles. The dotted and dashed lines show a linear and quadratic fit, respectively, to the mean values of all Msat/Mdisk bins.
Current usage metrics show cumulative count of Article Views (full-text article views including HTML views, PDF and ePub downloads, according to the available data) and Abstracts Views on Vision4Press platform.
Data correspond to usage on the plateform after 2015. The current usage metrics is available 48-96 hours after online publication and is updated daily on week days.
Initial download of the metrics may take a while.