| Issue |
A&A
Volume 575, March 2015
|
|
|---|---|---|
| Article Number | A8 | |
| Number of page(s) | 6 | |
| Section | Extragalactic astronomy | |
| DOI | https://doi.org/10.1051/0004-6361/201424828 | |
| Published online | 11 February 2015 | |
Diffuse radio emission in the complex merging galaxy cluster Abell2069
1
Thüringer Landessternwarte (TLS), Sternwarte 5,
07778
Tautenburg,
Germany
e-mail:
This email address is being protected from spambots. You need JavaScript enabled to view it.
2
ASTRON – Netherlands Institute for Radio Astronomy,
Oude Hoogeveensedijk 4,
7991 PD
Dwingeloo, The
Netherlands
3
Hamburger Sternwarte, Gojenbergsweg 112,
21029
Hamburg,
Germany
4
Harvard-Smithsonian Center for Astrophysics, 60 Garden
Street, Cambridge,
MA
02138,
USA
5
Argelander Institut für Radioastronomie, Universität
Bonn, Auf dem Hügel
71, 53121
Bonn,
Germany
Received: 18 August 2014
Accepted: 18 December 2014
Abstract
Context. Galaxy clusters with signs of a recent merger in many cases show extended diffuse radio features. This emission originates from relativistic electrons that suffer synchrotron losses due to the intracluster magnetic field. The mechanisms of particle acceleration and the properties of the magnetic field are still poorly understood.
Aims. We search for diffuse radio emission in galaxy clusters. Here, we study the complex galaxy cluster Abell 2069, for which X-ray observations indicate a recent merger.
Methods. We investigate the cluster’s radio continuum emission by deep Westerbork Synthesis Radio Telescope (WSRT) observations at 346 MHz and Giant Metrewave Radio Telescope (GMRT) observations at 322 MHz.
Results. We find an extended diffuse radio feature roughly coinciding with the main component of the cluster. We classify this emission as a radio halo and estimate its lower limit flux density at 25 ± 9 mJy. Moreover, we find a second extended diffuse source located at the cluster’s companion and estimate its flux density at 15 ± 2 mJy. We speculate that this is a small halo or a mini-halo. If true, this cluster is the first example of a double-halo in a single galaxy cluster.
Key words: magnetic fields / radiation mechanisms: non-thermal / turbulence / galaxies: clusters: individual: Abell 2069 / galaxies: clusters: intracluster medium
© ESO, 2015
1. Introduction
Diffuse radio emission has been found in about 100 galaxy clusters. Depending on the location in the cluster, morphology, and spectral properties, one distinguishes radio relics and radio halos (see Feretti et al. 2012, for a review). There is strong evidence that both relics and halos are related to a recent merger event in galaxy clusters (Cassano et al. 2010, 2013; Akamatsu et al. 2012). Scenarios for the formation of radio halos can be subdivided into “hadronic models” where secondary electrons, generated by hadronic collisions of relativistic protons with thermal nuclei, cause the radio emission (e.g., Dennison 1980; Blasi & Colafrancesco 1999) and “turbulence models” in which electrons are reaccelerated by the turbulence in the intracluster medium in the aftermath of the cluster merger (Brunetti et al. 2001; Petrosian 2001). The “hadronic model” is disfavored by several observational evidences, e.g., the nondetection of γ-ray emission in nearby galaxy clusters (Brunetti 2009; Ackermann et al. 2010, 2014; Brunetti et al. 2012; Zandanel & Ando 2014), the discovery of ultra-steep spectrum halos (Brunetti et al. 2008), and the radial profile of some giant radio halos (e.g., Zandanel et al. 2014). Moreover, some merging clusters show halo emission while other merging systems do not. This observational fact may provide further constraints on the origin of radio halos (Cassano et al. 2010, 2013; Russell et al. 2011). For a comprehensive theoretical overview of the scenarios of the formation of radio halos, see the review by Brunetti & Jones (2014).
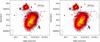 |
Fig. 1 Left: colorscale: X-ray surface brightness at 0.5−7 keV in linear scale smoothed with a 2D Gaussian of σ = 3′′. The observation was taken with the Chandra ACIS-I. The cluster components are labeled with “A” and “B”. Black contours: WSRT 346 MHz image after subtracting compact sources. The noise level is σrms ≈ 1.0 mJy/beam. Contour levels are drawn at [− 3.0, 3.0, 4.2 , 6.0, 8.5, 12.0] mJy. The negative contour is drawn with a dashed line. Blue dashed line: region where the radio flux density related to the main cluster component A was measured. The skymodel for subtraction is based on the measured flux densities in the GMRT image at 322 MHz, listed in Table 1. The shape of the restoring beam is 182′′ × 91′′ with a position angle of 0°. Right: image obtained using a more aggressive subtraction procedure. The shape of the restoring beam is 170′′ × 85′′ with a position angle of 0°. |
In some galaxy clusters without a recent merger but with a cool core small radio halos have also been found (Feretti et al. 2012; Giacintucci et al. 2014, for a recent compilation). This emission is referred to as “mini-halo”. Cold fronts, as found in Abell 2069 (Owers et al. 2009), have been observed in some clusters possessing a mini-halo. It has been suggested that the cold fronts are related to gas sloshing, which in turn generates turbulence in the cluster core, which then reaccelerates relativistic electrons (Gitti et al. 2002, 2004; Mazzotta & Giacintucci 2008; ZuHone et al. 2013). Hadronic scenarios as described above have also been suggested for mini-halos (Pfrommer & Enßlin 2004; Keshet & Loeb 2010; Fujita & Ohira 2013) and are studied in detailed simulations (ZuHone et al. 2014). The γ-ray emission is significantly lower for mini-halos than for giant halos. Hence, current γ-ray observations do not achieve enough sensitivity to provide further constraints on the hadronic origin of mini-halos (Brunetti & Jones 2014). The giant radio halo found in the cool-core cluster CL1821+643 (Bonafede et al. 2014) could be an example of a transitional stage between radio halos and mini-halos. Similarly, a mini-halo in a merging system may also provide evidence that giant halos and mini-halos are closely related to each other.
In this paper we present radio observations of the Abell 2069 galaxy cluster complex with the WSRT at 346 MHz and the GMRT at 322 MHz. We assume a ΛCDM cosmology with H0 = 71 km s-1 Mpc-1, Ωm = 0.27, and ΩΛ = 0.73. For a redshift z = 0.116 this translates to 2.076 kpc/′′.
2. Abell 2069
The cluster Abell 2069 is a complex galaxy cluster of richness class 2 at a redshift of z = 0.116 (Struble & Rood 1999). Together with five other clusters, it belongs to the so-called “A2069-supercluster” (z = 0.11; Einasto et al. 1997). The Corona Borealis supercluster (Small et al. 1997a,b) is located at the foreground (z = 0.07). Abell 2069 is a merger system with two bright elliptical galaxies (Gioia et al. 1982) in the center with a projected distance of about 55 kpc. In X-ray observations two components, in the following denoted A and B, are visible and ≈1 Mpc separated from each other (see Fig. 1). The cluster component B has a peculiar velocity of 485 km s-1 with respect to the mean cluster redshift and shows a cold front (Owers et al. 2009). Properties of Abell 2069 are summarized in Table 1.
Cluster properties and flux densities of compact sources in Abell 2069 as measured with the GMRT at 322 MHz.
Searching for radio halos Farnsworth et al. (2013) studied the cluster with the Green Bank Telescope (GBT) at 1.4 GHz and discovered extended emission in Abell 2069. However, because of the very large beam size of the GBT conclusions about the morphology or the internal structure of the emission are limited. Furthermore, unidentified compact sources may contribute to their flux density estimate.
3. Observations and data reduction
We observed the galaxy cluster Abell 2069 for 36 h in P-band with the Westerbork Synthesis Radio Telescope (WSRT). We performed the observation during three different nights with a duration of 12 h each. We observed in the frequency range from 311 to 381 MHz, with a central frequency of 346 MHz and a spectral resolution of 78.125 kHz. To maximize the uv-coverage, we observed with a different array configuration each night. The WSRT allows us to move four antennas1. Most adjacent antennas have a distance of 144 m. With a shortest baseline of a length of 36 m the instrument is sensitive for large-scale structures up to ~40′. This observation was part of the WSRT legacy project in which ten clusters were observed (Drabent et al., in prep.).
In addition, we have observed Abell 2069 with the Giant Metrewave Radio Telescope (GMRT) for 4.8 h. Here we have observed in the frequency range from 306 to 339 MHz, with a central frequency of 322 MHz and a spectral resolution of 130.208 kHz. Details of all observations are listed in Table 2.
Observational details.
3C 147 (WSRT) and 3C 286 (GMRT) were observed for 15 min before and after the target observation for flux density calibration.
We performed radio-frequency interference (RFI) mitigation using the AOFlagger (Offringa 2010) and optimized the default strategy for the WSRT as well as for the GMRT P-band observations. Unfortunately, in the GMRT observation all baselines shorter than about 1500 m are heavily affected by RFI. A total of 30% of the WSRT data and 40% of the GMRT data have been flagged.
Calibration, imaging, and self-calibration were carried out with the Common Astronomy Software Applications2 (CASA) package. For the WSRT we have corrected for amplitude variations based on the system temperature information recorded during the observations. We used the observations of 3C 147 and 3C 286 to correct for the bandpass and the flux density scale according to Scaife & Heald (2012). Because of the excellent phase stability of the WSRT backend, a few iterations of self-calibration were sufficient to correct for remaining phase variations. We carried out the initial phase calibration for the GMRT data with a skymodel based on positions in the Faint Images of the Radio Sky at Twenty-Centimeters (FIRST) catalog (Becker et al. 2012), using 36 sources that contribute most to the visibilities. For self-calibration and imaging, we applied Briggs weighting with a robustness parameter of 0.0 in CASA, which offers a compromise between high-resolution and the best signal-to-noise-ratio per beam. With the final calibrated data we achieve an rms noise level of about 0.5 mJy/beam for the WSRT images with a 108′′ × 52′′-beam, and 0.2 mJy/beam for the GMRT images with a 14′′ × 7′′-beam. Both radio maps obtained with this procedure are depicted in Fig. 2.
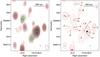 |
Fig. 2 Left: WSRT 346 MHz radio map imaged with Briggs weighting (robust = 0.0 in CASA). The noise level is σrms ≈ 0.5 mJy/beam. Contour levels are drawn at [1.5, 3.0, 9.0, 18, 36] mJy. There is no negative flux density below −1.5 mJy within the depicted area. The shape of the restoring beam is 108′′ × 52′′ with a position angle of 0°. Right: red contours: see the left image. Grayscale: GMRT 322 MHz radio map imaged with Briggs weighting (robust = 0.0 in CASA). The map is logarithmically scaled. Flux density cutoff is set to 3 × σrms with σrms ≈ 0.2 mJy/beam. The shape of the restoring beam (denoted with the blue ellipse) is 14′′ × 7′′ with a position angle of 73°. |
Throughout our flux density measurements we assume a flux density scale uncertainty of 5% for 3C 147 and 2.5% for 3C 286 according to Scaife & Heald (2012). All errors given below take noise uncertainties based on the rms level of the radio maps into account. Since we could not correct for system temperature variations of the GMRT, we adopt an average amplitude instability of 10%.
We complemented our analysis by using Chandra ACIS-I archival data (ObsID: 4965). The actual exposure time amounts to 55.4 ks. For the data reduction we used the Chandra analysis software CIAO 4.6 and CALDB 4.5.9. The exposure-corrected image is created with the task “fluximage”.
4. Results and discussion
We have detected extended diffuse emission in both components A and B of Abell 2069 (see Fig. 1). In the following we describe the extraction of the diffuse emission in more detail. In Fig. 2 we compare the maps of the WSRT (left image) and the GMRT (right image) observations. In both images several sources within the cluster area and its vicinity are evident. The high-resolution GMRT image reveals that most of the sources visible in the WSRT image are compact. For instance, the sources “B”, “F” and “I” show similar flux densities in both images. All measured flux densities of the GMRT image are presented in Table 1.
The GMRT image shows that the unresolved luminous source “G” in the WSRT image is composed of three distinct sources, where the extended source “G2” dominates. Neither in the FIRST (Becker et al. 2012) survey, the NRAO VLA Sky Survey (NVSS; Condon et al. 1998) at 1.4 GHz, nor in the VLA Low-Frequency Sky Survey (VLSS; Cohen et al. 2007) at 74 MHz has a source been reported at this location. The morphology of “G2” suggests that we see projected superimposed lobes of a radio galaxy. Possibly, while the galaxy is moving through the intracluster medium both lobes could have been bent to the north. At the southern end of the emission’s tail we identified the faint galaxy SDSS J152358+29551 in the Sloan Digital Sky Survey (SDSS; Ahn et al. 2012) at r-band, see the brown cross in Fig. 3. For this galaxy a photometric redshift of zphoto = 0.100 ± 0.042 was determined. Therefore, it could be a member of the galaxy cluster.
The peak positions of the sources “E1” and “E2” coincide with the foreground optical galaxies MCG+05-36-028 and WISEPC J152419+2956 (both z = 0.076), respectively. They thus belong to a cluster member of the Corona Borealis Supercluster (Gioia et al. 1982).
In the case of the sources “HA” and “HB” visible in the WSRT image no corresponding compact sources could be found in the GMRT image. The sources “D1”, “D2”, and “K”, which are located at the brightest cluster galaxy of the corresponding cluster component, are too faint ( mJy). This suggests that “HA” and “HB” are extended diffuse radio features. To better recover diffuse emission, we imaged with natural weighting after subtracting compact sources.
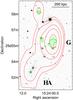 |
Fig. 3 Zoom into the “G”/“HA” complex. Red contours: see the red contours in Fig. 2. Green contours: 322 MHz GMRT observation. The noise level is σrms ≈ 0.2 mJy/beam. Contour levels are drawn at [− 0.75, 0.75, 1.1, 1.5 , 2.1] mJy. Background: SDSS-III (data release 10) r-band image. Brown cross: position of the potential host galaxy producing the radio emission “G2”. |
To achieve this we used the deep WSRT observation, which also offers good coverage of the short uv-spacings. The GMRT image serves as a skymodel to remove all visible compact sources in the area of Abell 2069. Since the center frequencies of both observations are slightly different, we assume an overall spectral index of all sources of α = −0.8. We then subtracted our skymodel in the uv-plane from the calibrated WSRT data and deconvolved the data again now using natural weighting. The latter places more emphasis on shorter baselines, so extended emission is expected to be better recovered.
The resulting radio map, depicted in the left image of Fig. 1, shows extended emission in the main component of Abell 2069 as well as a distinct feature in the subcomponent B. The emission in A is apparently extended toward the cluster component B. The extended radio emission of the main component A with a largest linear scale (LLS) of ≈ 900 kpc is roughly elongated along the semi-major axis of the corresponding elliptical X-ray structure. The peak flux is shifted to the northwest. This might be partly caused by not entirely subtracting the source “G”. Imaging the WSRT data with compact sources subtracted and with uniform weighting for higher resolution shows residual emission of 14 ± 2 mJy at the position of “G”. This indicates that the source “G” in the GMRT observation does not show all the flux density as observed with the WSRT. We therefore increased the flux density of “G” in our skymodel by 14 mJy and subtracted it again in the uv-plane from the calibrated WSRT data, see right image of Fig. 1. We now find a remaining LLS of ≈750 kpc and a radio-X-ray offset of 120 kpc (fractional offset of 0.16).
The elongated X-ray morphology of the component A and the presence of two brightest cluster galaxies indicate a recent merger. Since the extended radio emission in A shows roughly a similar orientation as the X-ray emission with only a moderate shift in position, we classify the emission as radio halo. Radio halos of similar size have recently been discovered in the galaxy cluster Abell 1689 (Vacca et al. 2011) and CL 0217+70 (Brown et al. 2011). The latter halo also shows a slight offset to the corresponding X-ray peak.
For the cluster component B we can only slightly constrain the morphology of the source “HB” since its size is comparable to the beam width. Comparing the profile of “HB” to the restoring beam profile, we find an extent of the source of a few ten arcseconds. This corresponds to a LLS of the order of 50 to 100 kpc.
In our maps both radio features in component A and B are connected by a bridge. We speculate that this is an effect of the large beam size.
We derive a total extended flux density within the black contours of 54 ± 9 mJy at 346 MHz. Note, because of the flux density uncertainties of the subtracted compact sources, we have additionally included 10% of the subtracted flux density to the error estimates. We measure a flux density of 39 ± 8 mJy for the diffuse flux associated with the cluster main component A (in the following denoted with “HA”) within the region enclosed by the blue dashed line (see left image of Fig. 1). In the map obtained with the more aggressive subtraction of “G” (see above and right image of Fig. 1) we measure a flux density of 25 ± 9 mJy. While in the first procedure part of the flux density of “G” possibly remains in the subtracted image, with more aggressive subtraction we may also remove part of the diffuse emission of the halo. The maps (depicted in Fig. 1) thus represent an upper and a lower limit of the flux density distribution of “HA”. For the source “HB” we measure a flux density of 15 ± 2 mJy in both maps of Fig. 1.
Our findings confirm the discovery of diffuse emission by Farnsworth et al. (2013). After subtracting NVSS sources they recovered 28.8 ± 7.2 mJy of diffuse flux density at 1.4 GHz. They subtracted all sources visible in the NVSS image down to a flux density threshold of 1.35 mJy. Furthermore, they estimated that the recovered flux density may contain 8−13 mJy because of faint radio sources below the threshold. Our GMRT image at 322 MHz corroborates the presence of several sources which are not or only marginally recognized in the NVSS (see Table 1). However, the total flux density of 11 mJy in the newly discovered sources is small in comparison to 66 mJy of all in the NVSS marginally visible sources. Comparing our upper (54 ± 9 mJy) and our lower (40 ± 11 mJy) limit of the total diffuse flux density (“HA”+“HB”) at 346 MHz with the estimated upper (≈20 mJy) and the lower (≈15 mJy) limit at 1.4 GHz by Farnsworth et al. (2013; derived by taking 8−13 mJy of potential contamination of the flux density measurement into account), we estimate a spectral index between α ≈ −0.5...−1.0. This is shallower than the spectral indices of known halos of α = −0.9...−1.9 (Feretti et al. 2012). We note that flux densities in Abell 2069 are only measured with large uncertainties because of the low surface brightness of the diffuse emission. The area of the lowest contour of the GBT map of Abell 2069 at 1.4 GHz by Farnsworth et al. (2013; depicted in Fig. 9 of their paper) is covered by ~40 beams in our radio maps with natural weighting (see Fig.1). In our map the flux density uncertainty due to rms noise of an extended source spread over an area of 40beams would be ≈19 mJy. However, most of the emission originates from the two cluster components A and B, which is also in agreement with the GBT map by Farnsworth et al. (2013). Assuming a spectral index of  , we estimate a radio power of P1.4 GHz = 2...3 × 1023 W Hz-1 .
The dynamical state of the whole cluster appears to be rather complex. The offset between the X-ray and radio peak of “HA” may indicate that the major merger in the main component A is still in an early or very late stage (Govoni et al. 2009). The evolution of the radio halo morphology during a galaxy cluster merger has been shown by recent simulations by Donnert et al. (2013). Moreover, given the low peculiar velocity, A and B are potentially undergoing a merger. It is not known if B is still in its first approach or if it already passed the core of the main cluster. If the latter is true, it is possible that the subcluster’s cool core has not been disrupted during the core passage (Poole et al. 2008). Thus we can only speculate about the origin of the source “HB”, which resides in the rather poor X-ray environment of B. Only a few halos have been found so far in such poor environments (Feretti et al. 2012). However, in this particular case the interaction of B with the much more massive component A may induce more energy, subsequently available for particle acceleration, into the intracluster medium of B than would be possible by a merger activity of an isolated cluster of similar size as B. Alternatively, a minor merger in B could have introduced turbulence in the volume of B. Interestingly, Owers et al. (2009) have found a cold front in the cluster component B. Mazzotta & Giacintucci (2008) reported a spatial correlation between radio emission and their cold fronts for two clusters, RX J1720+26 and MS 1455+22, which both possess a mini-halo. It has been suggested that gas sloshing induces turbulence for mini-halos, which eventually causes radio emission (ZuHone et al. 2013). Instead of originating from turbulent electron acceleration, the diffuse emission in B might be also caused by highly relativistic electrons generated by hadronic collisions of the cosmic-ray protons with the ambient thermal protons (Zandanel et al. 2014). Spectral studies of “HB” over a large frequency range might help to discriminate between both scenarios (ZuHone et al. 2014). Finally, it is also possible that “HB” is caused by fossil plasma ejected during a former active phase of an active galactic nuclei (AGN) in B.
In case the source is a halo this would be the second discovery of a double-halo system (Murgia et al. 2010), and furthermore, it would be the first case in which a double-halo system is located within two components of a single galaxy cluster.
5. Summary
We present deep radio observations of the complex galaxy cluster Abell 2069 carried out with the WSRT at 346 MHz and a radio observation with the GMRT at 322 MHz. The cluster consists of a main component (A) with clear signs for a recent merger and a smaller companion nearby (B). We have found extended emission in both components. The emission in the main component is elongated roughly along the same axis as the X-ray surface brightness and has a LLS of ≈750 kpc. We classify the diffuse emission in the cluster’s main component as a radio halo and estimate its lower limit flux density to be 25 ± 9 mJy.
We discovered extended diffuse emission in the companion B as well. Its flux density amounts to 15 ± 2 mJy and shows a LLS of the order of 50−100 kpc. With the available data the nature of the source remains uncertain. Chandra observations have revealed a cold front in B. Those fronts have been found for several clusters with radio mini-halos. Alternatively, this diffuse emission might be caused by fossil plasma ejected by an AGN, or turbulence might be induced by the interaction between A and B.
Our observations reveal that Abell 2069 shows, besides known intricated dynamics and a complex X-ray surface brightness, a richness of radio features including extended diffuse emission. Further studies of this cluster may help to shed light on how the interaction during cluster mergers causes diffuse radio emission originating from the intracluster medium.
Acknowledgments
The authors thank the anonymous referee for useful comments and suggestions which have significantly improved the manuscript. M.H. and U.K. acknowledge financial support by the DFG, in the framework of the DFG Forschergruppe 1254 “Magnetisation of Interstellar and Intergalactic Media: The Prospects of Low-Frequency Radio Observations”. R.J.W. is supported by NASA through the Einstein Postdoctoral grant number PF2-130104 awarded by the Chandra X-ray Center, which is operated by the Smithsonian Astrophysical Observatory for NASA under contract NAS8-03060. This research has made use of data obtained from the Chandra Data Archive and the Chandra Source Catalog, and software provided by the Chandra X-ray Center (CXC) in the application packages CIAO, ChIPS, and Sherpa. Funding for SDSS-III has been provided by the Alfred P. Sloan Foundation, the Participating Institutions, the National Science Foundation, and the US Department of Energy Office of Science. SDSS-III is managed by the Astrophysical Research Consortium for the Participating Institutions of the SDSS-III Collaboration.
References
- Ackermann, M., Ajello, M., Allafort, A., et al. 2010, ApJ, 717, L71 [NASA ADS] [CrossRef] [Google Scholar]
- Ackermann, M., Ajello, M., Albert, A., et al. 2014, ApJ, 787, 18 [NASA ADS] [CrossRef] [Google Scholar]
- Ahn, C. P., Alexandroff, R., Allen de Prieto, C., et al. 2012, ApJS, 203, 21 [NASA ADS] [CrossRef] [Google Scholar]
- Akamatsu, H., de Plaa, J., Kaastra, J., et al. 2012, PASJ, 64, 49 [NASA ADS] [Google Scholar]
- Becker, R. H., Helfand, D. J., White, R. L., Gregg, M. D., & Laurent-Muehlheisen, S. A. 2012, VizieR Online Data Catalog, VIII/090 [Google Scholar]
- Blasi, P., & Colafrancesco, S. 1999, Astropart. Phys., 12, 169 [NASA ADS] [CrossRef] [Google Scholar]
- Bonafede, A., Intema, H. T., Brüggen, M., et al. 2014, MNRAS, 444, 44 [Google Scholar]
- Brown, S., Duesterhoeft, J., & Rudnick, L. 2011, ApJ, 727, L25 [NASA ADS] [CrossRef] [Google Scholar]
- Brunetti, G. 2009, A&A, 508, 599 [NASA ADS] [CrossRef] [EDP Sciences] [Google Scholar]
- Brunetti, G., & Jones, T. W. 2014, Int. J. Mod. Phys. D, 23, 30007 [Google Scholar]
- Brunetti, G., Setti, G., Feretti, L., & Giovannini, G. 2001, MNRAS, 320, 365 [NASA ADS] [CrossRef] [Google Scholar]
- Brunetti, G., Giacintucci, S., Cassano, R., et al. 2008, Nature, 455, 944 [NASA ADS] [CrossRef] [Google Scholar]
- Brunetti, G., Blasi, P., Reimer, O., et al. 2012, MNRAS, 426, 956 [NASA ADS] [CrossRef] [Google Scholar]
- Cassano, R., Ettori, S., Giacintucci, S., et al. 2010, ApJ, 721, L82 [NASA ADS] [CrossRef] [Google Scholar]
- Cassano, R., Ettori, S., Brunetti, G., et al. 2013, ApJ, 777, 141 [NASA ADS] [CrossRef] [Google Scholar]
- Cohen, A. S., Lane, W. M., Cotton, W. D., et al. 2007, AJ, 134, 1245 [NASA ADS] [CrossRef] [Google Scholar]
- Condon, J. J., Cotton, W. D., Greisen, E. W., et al. 1998, AJ, 115, 1693 [NASA ADS] [CrossRef] [Google Scholar]
- Dennison, B. 1980, ApJ, 239, L93 [NASA ADS] [CrossRef] [Google Scholar]
- Donnert, J., Dolag, K., Brunetti, G., & Cassano, R. 2013, MNRAS, 429, 3564 [NASA ADS] [CrossRef] [Google Scholar]
- Einasto, M., Tago, E., Jaaniste, J., Einasto, J., & Andernach, H. 1997, A&AS, 123, 119 [NASA ADS] [CrossRef] [EDP Sciences] [Google Scholar]
- Farnsworth, D., Rudnick, L., Brown, S., & Brunetti, G. 2013, ApJ, 779, 189 [NASA ADS] [CrossRef] [Google Scholar]
- Feretti, L., Giovannini, G., Govoni, F., & Murgia, M. 2012, A&ARv, 20, 54 [Google Scholar]
- Fujita, Y., & Ohira, Y. 2013, MNRAS, 428, 599 [NASA ADS] [CrossRef] [Google Scholar]
- Giacintucci, S., Markevitch, M., Venturi, T., et al. 2014, ApJ, 781, 9 [NASA ADS] [CrossRef] [Google Scholar]
- Gioia, I. M., Maccacaro, T., Geller, M. J., et al. 1982, ApJ, 255, L17 [NASA ADS] [CrossRef] [Google Scholar]
- Gitti, M., Brunetti, G., & Setti, G. 2002, A&A, 386, 456 [NASA ADS] [CrossRef] [EDP Sciences] [Google Scholar]
- Gitti, M., Brunetti, G., Feretti, L., & Setti, G. 2004, A&A, 417, 1 [NASA ADS] [CrossRef] [EDP Sciences] [Google Scholar]
- Govoni, F., Murgia, M., Markevitch, M., et al. 2009, A&A, 499, 371 [NASA ADS] [CrossRef] [EDP Sciences] [Google Scholar]
- Keshet, U., & Loeb, A. 2010, ApJ, 722, 737 [NASA ADS] [CrossRef] [Google Scholar]
- Mazzotta, P., & Giacintucci, S. 2008, ApJ, 675, L9 [NASA ADS] [CrossRef] [Google Scholar]
- Murgia, M., Govoni, F., Feretti, L., & Giovannini, G. 2010, A&A, 509, A86 [NASA ADS] [CrossRef] [EDP Sciences] [Google Scholar]
- Offringa, A. R. 2010, AOFlagger RFI Software, astrophys. Source Code Library [Google Scholar]
- Owers, M. S., Nulsen, P. E. J., Couch, W. J., & Markevitch, M. 2009, ApJ, 704, 1349 [NASA ADS] [CrossRef] [Google Scholar]
- Petrosian, V. 2001, ApJ, 557, 560 [NASA ADS] [CrossRef] [Google Scholar]
- Pfrommer, C., & Enßlin, T. A. 2004, A&A, 413, 17 [NASA ADS] [CrossRef] [EDP Sciences] [Google Scholar]
- Poole, G. B., Babul, A., McCarthy, I. G., Sanderson, A. J. R., & Fardal, M. A. 2008, MNRAS, 391, 1163 [NASA ADS] [CrossRef] [Google Scholar]
- Russell, H. R., van Weeren, R. J., Edge, A. C., et al. 2011, MNRAS, 417, L1 [NASA ADS] [CrossRef] [Google Scholar]
- Scaife, A. M. M., & Heald, G. H. 2012, MNRAS, 423, L30 [NASA ADS] [CrossRef] [Google Scholar]
- Small, T. A., Sargent, W. L. W., & Hamilton, D. 1997a, ApJS, 111, 1 [NASA ADS] [CrossRef] [Google Scholar]
- Small, T. A., Sargent, W. L. W., & Hamilton, D. 1997b, ApJ, 487, 512 [NASA ADS] [CrossRef] [Google Scholar]
- Struble, M. F., & Rood, H. J. 1999, ApJS, 125, 35 [NASA ADS] [CrossRef] [Google Scholar]
- Vacca, V., Govoni, F., Murgia, M., et al. 2011, A&A, 535, A82 [NASA ADS] [CrossRef] [EDP Sciences] [Google Scholar]
- Zandanel, F., & Ando, S. 2014, MNRAS, 440, 663 [NASA ADS] [CrossRef] [Google Scholar]
- Zandanel, F., Pfrommer, C., & Prada, F. 2014, MNRAS, 438, 124 [NASA ADS] [CrossRef] [Google Scholar]
- ZuHone, J. A., Markevitch, M., Brunetti, G., & Giacintucci, S. 2013, ApJ, 762, 78 [NASA ADS] [CrossRef] [Google Scholar]
- ZuHone, J., Brunetti, G., Giacintucci, S., & Markevitch, M. 2014, ApJ, submitted [arXiv:1403.6743] [Google Scholar]
All Tables
Cluster properties and flux densities of compact sources in Abell 2069 as measured with the GMRT at 322 MHz.
All Figures
|
Fig. 1 Left: colorscale: X-ray surface brightness at 0.5−7 keV in linear scale smoothed with a 2D Gaussian of σ = 3′′. The observation was taken with the Chandra ACIS-I. The cluster components are labeled with “A” and “B”. Black contours: WSRT 346 MHz image after subtracting compact sources. The noise level is σrms ≈ 1.0 mJy/beam. Contour levels are drawn at [− 3.0, 3.0, 4.2 , 6.0, 8.5, 12.0] mJy. The negative contour is drawn with a dashed line. Blue dashed line: region where the radio flux density related to the main cluster component A was measured. The skymodel for subtraction is based on the measured flux densities in the GMRT image at 322 MHz, listed in Table 1. The shape of the restoring beam is 182′′ × 91′′ with a position angle of 0°. Right: image obtained using a more aggressive subtraction procedure. The shape of the restoring beam is 170′′ × 85′′ with a position angle of 0°. |
| In the text | |
|
Fig. 2 Left: WSRT 346 MHz radio map imaged with Briggs weighting (robust = 0.0 in CASA). The noise level is σrms ≈ 0.5 mJy/beam. Contour levels are drawn at [1.5, 3.0, 9.0, 18, 36] mJy. There is no negative flux density below −1.5 mJy within the depicted area. The shape of the restoring beam is 108′′ × 52′′ with a position angle of 0°. Right: red contours: see the left image. Grayscale: GMRT 322 MHz radio map imaged with Briggs weighting (robust = 0.0 in CASA). The map is logarithmically scaled. Flux density cutoff is set to 3 × σrms with σrms ≈ 0.2 mJy/beam. The shape of the restoring beam (denoted with the blue ellipse) is 14′′ × 7′′ with a position angle of 73°. |
| In the text | |
|
Fig. 3 Zoom into the “G”/“HA” complex. Red contours: see the red contours in Fig. 2. Green contours: 322 MHz GMRT observation. The noise level is σrms ≈ 0.2 mJy/beam. Contour levels are drawn at [− 0.75, 0.75, 1.1, 1.5 , 2.1] mJy. Background: SDSS-III (data release 10) r-band image. Brown cross: position of the potential host galaxy producing the radio emission “G2”. |
| In the text | |
Current usage metrics show cumulative count of Article Views (full-text article views including HTML views, PDF and ePub downloads, according to the available data) and Abstracts Views on Vision4Press platform.
Data correspond to usage on the plateform after 2015. The current usage metrics is available 48-96 hours after online publication and is updated daily on week days.
Initial download of the metrics may take a while.