Fig. 1
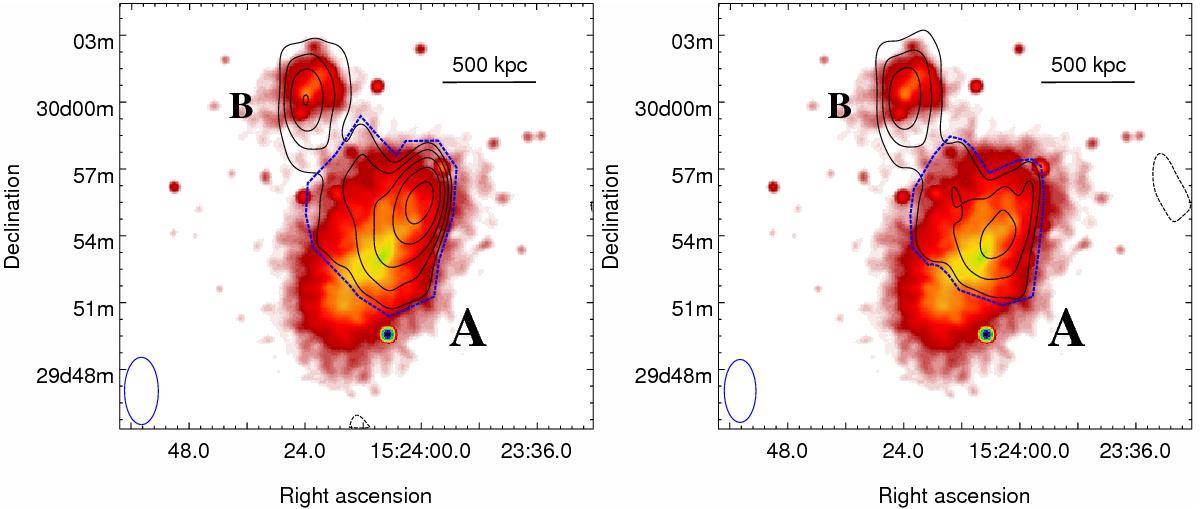
Left: colorscale: X-ray surface brightness at 0.5−7 keV in linear scale smoothed with a 2D Gaussian of σ = 3′′. The observation was taken with the Chandra ACIS-I. The cluster components are labeled with “A” and “B”. Black contours: WSRT 346 MHz image after subtracting compact sources. The noise level is σrms ≈ 1.0 mJy/beam. Contour levels are drawn at [− 3.0, 3.0, 4.2 , 6.0, 8.5, 12.0] mJy. The negative contour is drawn with a dashed line. Blue dashed line: region where the radio flux density related to the main cluster component A was measured. The skymodel for subtraction is based on the measured flux densities in the GMRT image at 322 MHz, listed in Table 1. The shape of the restoring beam is 182′′ × 91′′ with a position angle of 0°. Right: image obtained using a more aggressive subtraction procedure. The shape of the restoring beam is 170′′ × 85′′ with a position angle of 0°.
Current usage metrics show cumulative count of Article Views (full-text article views including HTML views, PDF and ePub downloads, according to the available data) and Abstracts Views on Vision4Press platform.
Data correspond to usage on the plateform after 2015. The current usage metrics is available 48-96 hours after online publication and is updated daily on week days.
Initial download of the metrics may take a while.