Fig. 3
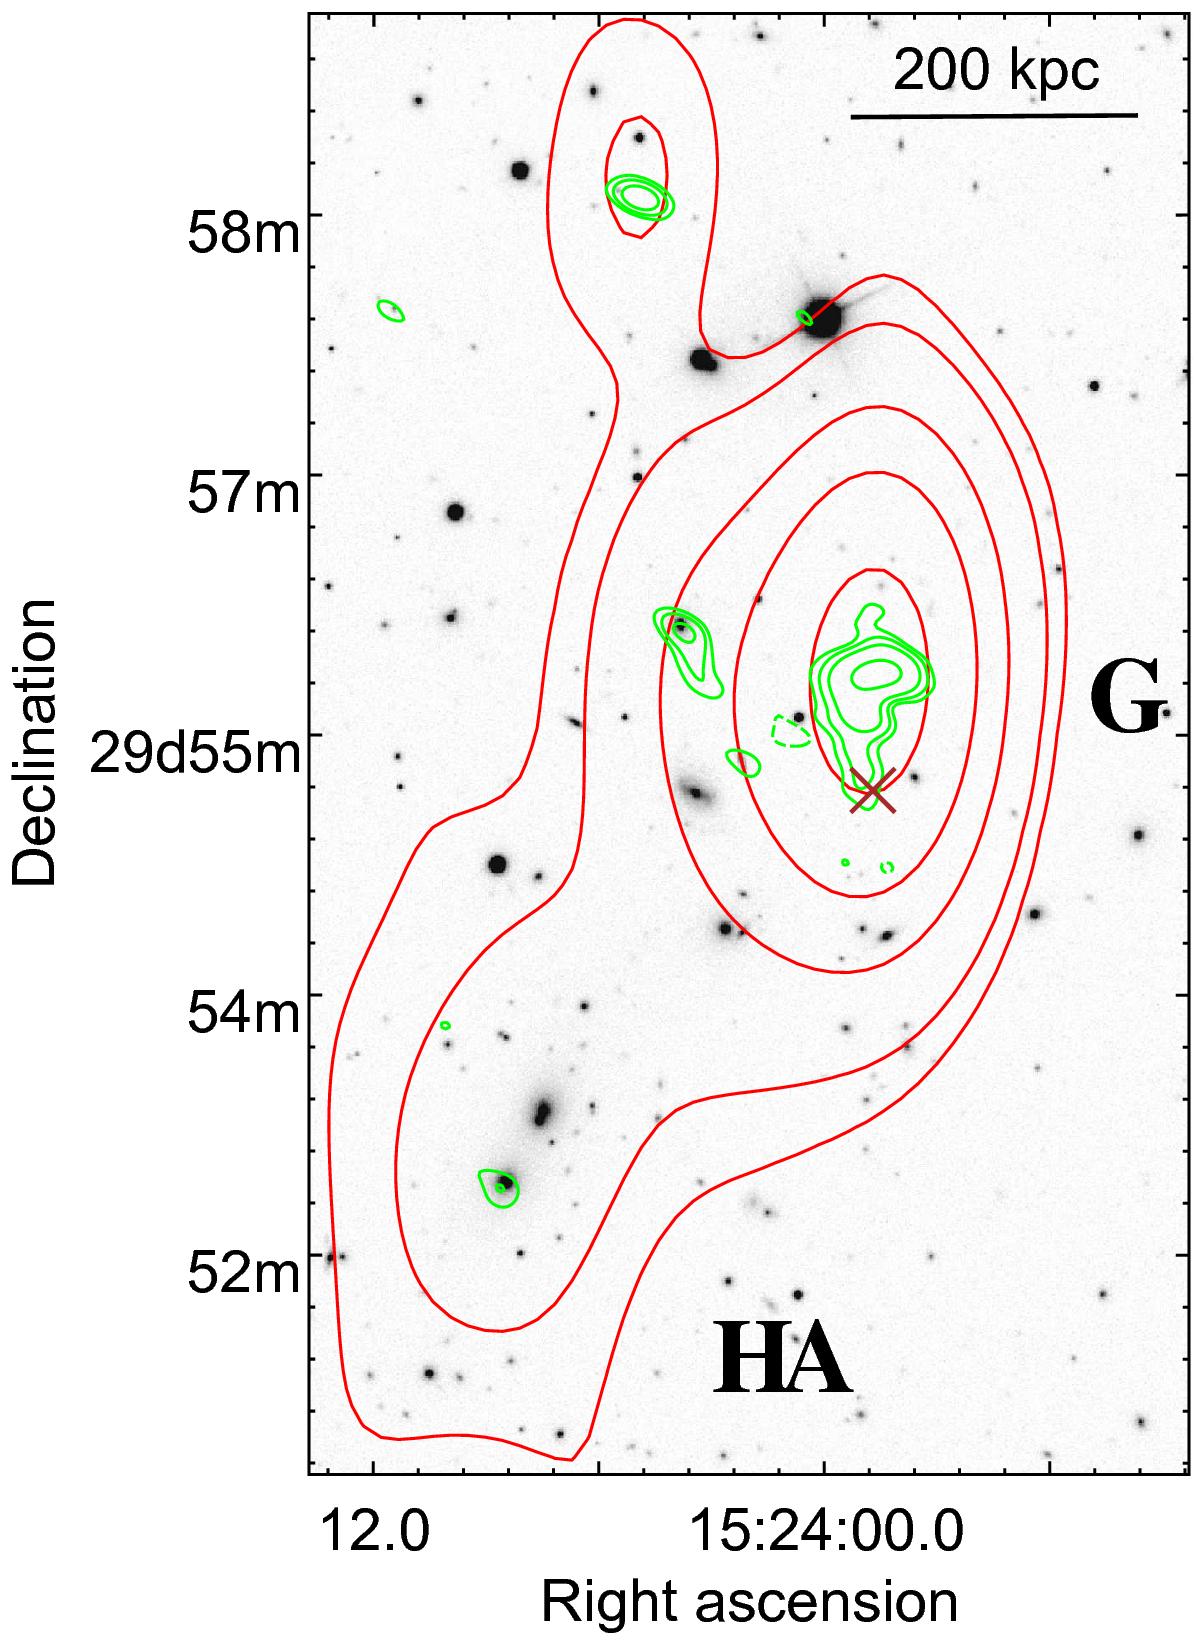
Zoom into the “G”/“HA” complex. Red contours: see the red contours in Fig. 2. Green contours: 322 MHz GMRT observation. The noise level is σrms ≈ 0.2 mJy/beam. Contour levels are drawn at [− 0.75, 0.75, 1.1, 1.5 , 2.1] mJy. Background: SDSS-III (data release 10) r-band image. Brown cross: position of the potential host galaxy producing the radio emission “G2”.
Current usage metrics show cumulative count of Article Views (full-text article views including HTML views, PDF and ePub downloads, according to the available data) and Abstracts Views on Vision4Press platform.
Data correspond to usage on the plateform after 2015. The current usage metrics is available 48-96 hours after online publication and is updated daily on week days.
Initial download of the metrics may take a while.