| Issue |
A&A
Volume 575, March 2015
|
|
|---|---|---|
| Article Number | L5 | |
| Number of page(s) | 5 | |
| Section | Letters | |
| DOI | https://doi.org/10.1051/0004-6361/201424404 | |
| Published online | 17 February 2015 | |
High-resolution observations of the outer disk around T Chamaeleontis: the view from ALMA
1
Centro de Astrobiología (INTA-CSIC), ESAC Campus, PO Box 78,
28691
Villanueva de la Cañada,
Spain
e-mail:
This email address is being protected from spambots. You need JavaScript enabled to view it.
2
Joint ALMA Observatory (JAO), Alonso de Córdova 3107, Vitacura, Santiago de Chile,
Chile
3
European Southern Observatory, 85748
Garching bei München,
Germany
4
Instituto de Astrofísica de Andalucía, CSIC,
Glorieta de la Astronomía
s/n, 18008
Granada,
Spain
5
UMI-FCA, CNRS/INSU France (UMI 3386), and Dpto. de Astronomía,
Universidad de Chile, Casilla
36- D Santiago,
Chile
6
Univ. Grenoble Alpes, IPAG, 38000
Grenoble,
France
7
CNRS, IPAG, 38000
Grenoble,
France
8
Research School of Astronomy and Astrophysics, Australian National
University, Canberra
ACT
2611,
Australia
9 Sydney Institute for Astronomy, School of Physics, University
of Sydney, NSW 2006, Australia
10
LESIA, CNRS UMR-8109, Observatoire de Paris, UPMC, Univ. Paris Diderot,
5 place Jules
Janssen, 92195
Meudon,
France
Received: 14 June 2014
Accepted: 26 January 2015
Abstract
Context. Transitional disks are circumstellar disks with dust gaps thought to be related in some cases to planet formation. They can shed light on the planet formation process by the analysis of their gas and dust properties. T Cha is a young star surrounded by a transitional disk with signatures of planet formation.
Aims. The aim of this work is to spatially resolve the outer disk around T Cha and to derive its main properties.
Methods. We have obtained high-resolution and high-sensitivity ALMA observations in the CO(3–2), 13CO(3–2), and CS(7–6) emission lines to reveal the spatial distribution of the gaseous disk around the star. In order to study the dust within the disk we have also obtained continuum images at 850 μm from the line-free channels.
Results. We have spatially resolved the outer disk around T Cha. Using the CO(3−2) emission we derive a radius of ~230 AU. We also report the detection of the 13CO(3−2) and the CS(7−8) molecular emissions, which show smaller radii than the CO(3−2) detection. The continuum observations at 850 μm allow the spatial resolution of the dusty disk, which shows two emission bumps separated by ~40 AU, consistent with the presence of a dust gap in the inner regions of the disk, and an outer radius of ~80 AU. Therefore, T Cha is surrounded by a compact dusty disk and a larger and more diffuse gaseous disk, as previously observed in other young stars. The continuum intensity profiles are different at both sides of the disk suggesting possible dust asymmetries. We derive an inclination of i(°) = 67 ± 5, and a position angle of PA(°) = 113 ± 6, for both the gas and dust disks. The comparison of the ALMA data with radiative transfer models shows that the gas and dust components can only be simultaneously reproduced when we include a tapered edge prescription for the surface density profile. The best model suggests that most of the disk mass is placed within a radius of R< 50 AU. Finally, we derive a dynamical mass for the central object of M∗ = 1.5 ± 0.2 M⊙, comparable to the one estimated with evolutionary models for an age of ~10 Myr.
Key words: stars: pre-main sequence / stars: individual: T Chamaeleontis / protoplanetary disks / techniques: interferometric
© ESO, 2015
1. Introduction
T Chamaeleontis (T Cha) is a young (~7 ± 5 Myr) nearby (108 pc) T Tauri star in the ϵ-Cha association, surrounded by a transition disk (Alcala et al., 1993; Brown et al., 2007; Torres et al., 2008; Murphy et al., 2013). There is evidence of a dust gap within the disk, and a yet unconfirmed substellar companion inside the gap (see Huélamo et al., 2011; Olofsson et al., 2013). If confirmed, the disk around T Cha can give us important clues about the physical conditions for substellar formation at early evolutionary phases.
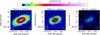 |
Fig. 1 Integrated emission maps of the CO(3–2), 13CO(3–2), and the CS(7–6) transitions (from left to right). The black contours represent the continuum emission at 850 μm at 5, 15, 30, 45, 60, 75, 90, and 110σ where 1σ is 0.7 mJy beam-1. We detect two emission bumps separated by 40 AU and an outer dust radius of 79 AU. The white ellipses are the synthesized beams for the spectral emission lines and the green ellipse is the synthesized beam for the continuum map. The white dashed line in the left panel represents the axis where the position–velocity diagram in Fig. 4 has been obtained. |
T Cha is surrounded by a very narrow inner disk that extends from 0.13 to 0.17 AU (Olofsson et al., 2013), and an outer disk whose main properties have been inferred from the modeling of its spectral energy distribution (SED; e.g. Brown et al., 2007). Cieza et al. (2011) showed that the models are highly degenerate and can fit the SED of T Cha equally well either with a very compact outer dust disk (a few AUs wide) or a much larger but more tenuous disk, with a very steep surface density profile. Both families of models suggest a very peculiar outer disk with little or no dust beyond ~40 AU. The cold gas in the T Cha outer disk has been studied by Sacco et al. (2014). Their spatially unresolved observations suggest the presence of a gaseous disk with an outer radius of RCO ~ 80 AU in Keplerian rotation.
Overall, the disk around T Cha shows properties similar to the so-called faint disks, characterized by weak millimeter continuum emission that can be the result of different properties or processes (e.g. Piétu et al., 2014). In the case of T Cha there is evidence of dust clearing, grain growth, and a high disk inclination (Brown et al., 2007; Pascucci & Sterzik, 2009).
In this work we present high-quality observations of T Cha obtained with the Atacama Large Millimeter Array (ALMA), which have allowed us to spatially resolve the outer disk around T Cha for the first time. ALMA has allowed us to derive basic parameters of the outer disk, to break the degeneracy of radiative transfer models based on SED fitting, and to understand if it is peculiar in comparison with other circumstellar disks.
2. Observations
The observations were performed on 2012 July 01, 26, and November 03 at Band 7, as part of the ALMA Cycle 0 program 2011.0.00921.S. The field of view was ~ 18′′. A total of three data sets were collected, using between 18 and 23 antennas of 12 m diameter and accounting for 6 h of total integration time including overheads and calibration. Weather conditions were good and stable, with an average precipitable water vapor of 0.7 mm. The system temperature varied from 150 to 250 K.
The correlator was set to four spectral windows in dual polarization mode, centered at 345.796 GHz (CO(3−2)), 342.883 GHz (CS(7−6)), 332.505 GHz (SO2(4(3,1)–3(2,2))), and 330.588 GHz (13CO(3−2)). The effective bandwidth used was 468.75 MHz, providing a velocity resolution of ~0.11 km s-1 after Hanning smoothing.
The ALMA calibration includes simultaneous observations of the 183 GHz water line with water vapor radiometers, which measure the water column in the antenna beam, later used to reduce the atmospheric phase noise. Amplitude calibration was done using Juno and Titan, and quasars J1256−057 and J1147−6753 were used to calibrate the bandpass and the complex gain fluctuations, respectively. Data reduction was performed using version 4.1 of the Common Astronomy Software Applications package (CASA). We applied self-calibration using the continuum and we used the task CLEAN to image the self-calibrated visibilities. The continuum image was produced by combining all of the line-free channels using uniform weighting (synthesized beam 0.52″ × 0.34″, PA ~ 29°; rms = 0.7 mJy beam-1). For the CO(3–2) line we used Briggs weighting (beam 0.64″ × 0.48″, PA ~ 31°; rms per channel = 9 mJy beam-1), and for the rest of the lines we used natural weighting, providing a synthesized beam ~0.8″ × 0.6″, PA ~ 25° and an rms per channel of 11 mJy beam-1 for the  line, and 7 mJy beam-1 for the CS and the SO2 lines.
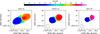 |
Fig. 2 Intensity-weighted mean velocity maps (first-order moment, 2σ cut for CO(3–2) and 13CO(3–2), and 1.5σ cut for CS(7–6)). |
3. Results and discussion
3.1. Molecular emission line detections
Molecular line emission is detected for the transitions CO(3−2), 13CO(3–2), and CS(7−6). All of them are spatially resolved for the first time for T Cha. No detection was found for SO2(4(3,1)−3(2,2)), with a 3σ upper limit of 20 mJy.
Figure 1 shows the integrated emission maps of the three detected molecules while Fig. 2 shows the intensity-weighted mean velocity maps. The CO(3–2) emission is spatially well resolved along the major and the minor axes. The integrated intensity averaged over the whole emission area above 3σ is 12.46 ± 0.11 Jy km s-1, in agreement with the value reported by Sacco et al. (2014) from the fit with a Keplerian disk model profile to single-dish observations. Considering contours above 3σ, the outer radius extends to 2.1′′ which, after deconvolution with the synthesized beam, corresponds to an outer radius RCO ~ 230 AU. The inclination (i) and the position angle (PA) of the gaseous disk have been estimated by fitting a Gaussian to the CO(3–2) integrated emission map, providing values of i = 67 ± 5° and PA = 113 ± 6°.
The 13CO(3–2) emission line shows an integrated intensity of 4.31 ± 0.07 Jy km s-1 (above 3σ contour). The region of emission is spatially resolved, with a radius R13CO ~ 170 AU after deconvolution with the synthesized beam.
The radial intensity profiles of the CO(3−2) and 13CO(3−2) transitions are shown in Fig. 3. They have been computed using slices along the semi-major axis of the disk (dashed white line in Fig. 1, left panel) in the gas emission maps. We do not see a significant difference in the profiles at the two sides of the disk (NE and SW), which suggests a symmetric distribution of the gas.
Gas emission from CS(7–6) is also spatially resolved and shows a deconvolved radius of RCS ~ 100 AU. The integrated intensity emission above 3σ is 0.54±0.08 Jy km s-1. To our knowledge, this is the first time that such a high transition of the CS molecule has been spatially resolved in a disk around a late-type star (the first detection in a Herbig star was reported by van der Plas et al., 2014). Sulfur-bearing molecules (like CS and SO2) studies are scarce (e.g. Dutrey et al. 2011; Guilloteau et al. 2012), but interesting since this type of molecules are present in comets (e.g. Hale-Bopp, Ikeda et al. 2002; and Shoemaker-Levy/9, Matthews et al. 2002) and their presence in the inner part of the disks offers the possibility of studying the chemical composition of the planet-forming regions. So far, only a few CS detections at lower frequency transitions have been reported in disks surrounding K5 to M0 stars (Dutrey et al., 2011; Kastner et al., 2013). Here we show for the first time a spatially resolved detection of the CS(7–6) transition around a K0 star.
The gas detected in the disk surrounding T Cha shows a velocity profile consistent with a Keplerian rotation pattern, which can be seen in all the molecular transitions observed (see Fig. 2). CO(3–2) emission is detected at velocities between −5.0 to 16.5 km s-1, 13CO(3–2) between −3.0 and 15.0 km s-1, and CS(7–6) between 0.0 to 11.0 km s-1. In Fig. 4 we have represented a position–velocity diagram along the major axis of the gaseous disk traced by CO(3–2). The systemic velocity is 5.95 ± 0.22 km s-1. In that plot an absorption feature at velocities near 4.7 km s-1 can be seen, which is very likely produced by a foreground molecular cloud in the same line of sight as T Cha (Nehmé et al., 2008). By comparing the position–velocity diagram with a Keplerian velocity profile (Fig. 4), we show that the emission is compatible with Keplerian rotation around a 1.3−1.7 M⊙ object in a disk inclined at 67 degrees. This mass range is in good agreement with estimations from evolutionary tracks for an age of ~10 Myr (e.g. Schisano et al., 2009; Murphy et al., 2013).
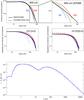 |
Fig. 3 Top and middle panels: continuum and gas radial intensity profiles. The blue (SE) and red (NW) data points are the ALMA data (over 5σ) at both sides of the disk. In the case of the continuum we have also included the average profile (green data). The solid black lines show the best model using a tapered edge prescription for the surface density, while the dashed lines show the best model using a truncated power law. The upper panels show the continuum data, including a zoom of the outer regions, while the middle panels include the CO profiles. Bottom panel: the observed SED and the fit from the tapered edge model presented here. |
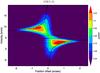 |
Fig. 4 Position–velocity diagram along the disk major axis (see exact axis represented in Fig. 1, left panel). The best fit to the data correspond to a Keplerian velocity profile for a systemic velocity of 5.95 km s-1; an inclination of i(°) = 67; and a central mass of 1.3 (dotted), 1.5 (solid) and 1.7 M⊙ (dashed). |
3.2. Continuum emission at 850μm
Continuum emission at 850 μm is detected centered at the position RA(J2000) = 11h57m13 42, Dec(J2000) = −79°21′31″696. The flux density integrated over the disk structure above 5σ is S850 μm = 198 ± 4 mJy.
Figure 1 shows the dusty outer disk around T Cha represented by black contours. The disk is spatially resolved in its major axis with a projected diameter of 1.50′′ (measured at the 5σ contour level), which corresponds to an outer dust disk radius of Rout ~ 80 AU after deconvolution with the synthesized beam, and adopting a distance of 108 pc. Two local peaks are observed at a projected separation of 0.37” (40 AU at 108 pc), which is close to the beam size, and suggest the presence of a gap in the inner regions of the disk as predicted by SED modeling.
In Fig. 3 we have represented the continuum radial intensity profiles at both sides of the disk, together with the average profile, including only datapoints above 5σ. As in the case of the gas molecules, they have been computed using slices along the semi-major axis of the disk (dashed white line in Fig. 1, left panel) in the continuum emission maps. We can see a significant difference between the profiles at both sides, with the NW side being slightly larger than the SE side, suggesting asymmetries within the dusty disk. Finally, the i and PA values that we derive using the continuum emission at 850 μm are similar to those estimated with the CO(3–2) observations.
3.3. Comparison with radiative transfer models
Our ALMA observations reveal that T Cha is surrounded by a compact dusty disk with a sharp outer edge at ~80 AU and a larger gaseous disk with an outer radius of ~230 AU. This trend, a compact dust disk with a larger and more diffuse gaseous disk, has already been observed in a significant number of circumstellar disks (e.g. Isella et al., 2007; Hughes et al., 2008; Andrews et al., 2012; de Gregorio-Monsalvo et al., 2013; Piétu et al., 2014).
Cieza et al. (2011) used the radiative transfer code MCFOST (Pinte et al., 2006, 2009) to model the SED of T Cha. They showed that there are two families of dust disk models that can reproduce equally well the SED: very small disks (a few AUs width) or much larger (Rout ~ 300 AU) but with a very steep surface density profile (with an exponent of α ≤ −2, for a power-law prescription). The large degeneracy between these two disk parameters, Rout and α, did not present a clear choice between the two scenarios. Olofsson et al. (2013) used MCFOST to fit the SED together with near-IR interferometric data. They fixed Rout = 25 AU, and α = −1, and found a best-fit model with a narrow dust outer disk (Rin = 12 ± 2 AU).
Our ALMA data shows that models with a power-law surface density, like the ones used in these two works, cannot reproduce both the CO and continuum data. We nevertheless first consider this type of model to discuss the ALMA data in the context of previous results.
We also modeled the SED of T Cha with MCFOST. The starting point is the model grid presented by Cieza et al. (2011) and refined by Olofsson et al. (2013). Basically, the disk is composed of two subdisks: an inner and an outer disk with a density structure defined by a power law surface density profile with exponent α, Σ(r) = Σ0 (r/r0)α, and a scale height of h(r) = h0(r/r0)β, with β being the disk flaring index, and h0 the scale height at a reference radius r0 = 50 AU. Each disk extends from an inner radius, Rin to an outer radius, Rout. The grain size distribution in each disk is defined by dn(a) ∝ apda, between amin and amax. The temperature structure in the disk is calculated by considering the dust opacity only. The dust properties are computed assuming the Mie theory. Finally, the total dust mass in the disk (including all grain sizes) is represented by Mdust.
To calculate the CO channel maps and surface brightness distribution, we assume a constant gas-to-dust mass ratio of 100 throughout the disk (both radially and vertically). We adopted a standard CO abundance with respect to H2 (10-4), set constant through the disk where Tdust> 20 K and equal to zero where Tdust< 20 K to mimic the effect of CO freeze out. The 12CO/13CO ratio is set to 76. The level populations are calculated assuming Tgas = Tdust at each point in the disk. The radial and vertical temperature profiles and the radiation field estimated by the Monte Carlo simulation are used to calculate level populations for the CO molecule and to produce the SED, continuum images, and line emission surface brightness profiles, as well as kinematics with a ray-tracing method. The kinematics are calculated assuming the disk is in pure Keplerian rotation.
We adopted the inner disk parameters from Olofsson et al. (2013). For the outer disk, we fixed two parameters obtained from the ALMA data, Rout and i, selecting the grid values closer to the ALMA measurements (80 AU and 68°, respectively). We explored Rin, β, h°@50 AU, amax, α, and Mdust, using the same parameter range shown in Cieza et al. (2011). For the SED, we have fitted the same observational dataset displayed in that work. The adopted stellar parameters are Teff = 5400 K, Av = 1.5, and d = 108 pc (Torres et al., 2008; Schisano et al., 2009). The best disk model, that is, the one with the minimum χ2, provides parameters of α = −2.5, β = 1.07, h0@50 AU = 6 AU, Rin = 19 AU, amax = 1000, and a disk dust mass of Mdust ~ 1 × 10⁻⁵ M⊙.
Since SED modeling is highly degenerate, the best-fit model is unlikely to be a unique solution. Therefore, we performed a Bayesian analysis to estimate the validity range for each of the explored parameters (Press et al., 1992; Pinte et al., 2007). The result is shown in Fig. 5, where we show the Bayesian probability distributions for the different disk parameters. While Mdust, Rin, and h0 seem well constrained, this is not the case for α: it shows a local peak at α = −2.5, but a relatively flat distribution. We conclude that, even fixing Rout, α remains unconstrained by the SED modeling.
With our ALMA observations we have partially broken the (α, Rout) degeneracy commonly encountered with SED fitting by measuring Rout. The resolution reached by our observations does not allow us to accurately constrain the surface density profile, but with Rin ~ 20 AU and a disk width of ~60 AU, we exclude surface density profile shallower than −1. According to the observed Rout, we can also discard the family of models with very narrow dusty rings, and the extreme case of a very large disk (Rout ~ 300 AU) with α ~ −3.
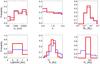 |
Fig. 5 Bayesian probability distributions of the disk parameters of T Cha. The blue lines show the results without fixing any parameters, while the red lines show the results after fixing the outer disk radius and the disk inclination. |
If we take the gas emission into account, the model fails to simultaneously fit the gas and dust profiles (see Fig. 3), as already observed in other spatially resolved circumstellar disks (e.g. Hughes et al., 2008). As discussed by the authors, a power law density profile cannot reproduce the different extent of the gas and dust emission observed in circumstellar disks while a tapered edge model, in which the surface density falls off gradually, can in principle reconcile the observed profiles. We therefore ran the MCFOST code, but using a tapered exponential edge in the surface density distribution. In this case, the density profile is represented by a function defined by the characteristic radius Rc (the radius out of which the brightness drops towards zero) and γ (the surface density index): Σ(r) = Σ0(r/r0)− γexp(−(r/r0)2−γ).
For this model, we also adopted the inner disk parameters from Olofsson et al. (2013), and varied only the prescription for the outer disk. We fixed the disk inclination to 68°, the dust mass to Mdust = 9 × 10⁻⁵ M⊙ (de Gregorio-Monsalvo et al., in prep.), and we explored the rest of the disk parameters: we sampled a range of γ values between 0 and 2, Rc between 40 and 100 AU, Rin between 12 and 30 AU, the scale height at 50 AU (h0@50 AU) between 3 and 6 AU, and the flaring index, β, between 1.0 and 1.1. Finally, to take into account the difference in brightness between both sides of the disk in the continuum, we explored models that pass between the two observed profiles.
The result is given in Fig. 3 where we show the best model that can fit simultaneously the two disk components and the observed SED. The model shows γ = 0.5 and Rc = 50 AU for both the gas and the dust. We also derive these parameters: Rin = 20 AU, h0@50 AU = 4 AU, and β = 1.0. This model is consistent with having the gas and the dust well mixed and mainly located at a radius smaller than 50 AU, as suggested by Cieza et al. (2011) based on the steep drop of the SED at sub-mm wavelengths.
Figure 3 shows that our best model does not perfectly fit the CO line profiles, which can be related either to the underlying chemistry (we assumed ISM abundances and very simple CO freeze-out) or to the model prescriptions. In fact, tapered-edge models sometimes fail to reproduce simultaneously the observed dust and gas profiles obtained from very high spatial resolution and sensitivity observations (see Andrews et al., 2012; de Gregorio-Monsalvo et al., 2013), and suggests that other processes such as grain growth and radial migration should be taken into account. Given that the disk is barely resolved in our data, we expect future, higher spatial resolution observations to provide stronger constraints on the relative location of the gas and dust, and on the departure from point-symmetry.
4. Conclusions
High spatial resolution and high sensitivity ALMA observations have allowed us to spatially resolve the outer disk around the young and isolated object T Cha. The target is surrounded by a compact dusty disk and a ~3 times larger gaseous disk. Our main results can be summarized as follows.
-
We have spatially resolved the gaseous disk of T Cha in three different molecular emission lines: CO(3–2), 13CO(3−2), and CS(7–8). Using the CO(3−2) image we derive an outer radius of Rgas,out ~ 230 AU, an inclination of i(°) = 67 ± 5, and a position angle of PA(°) = 113 ± 6. The line intensity profiles are similar at both sides of the disk in the CO molecules, consistent with a uniform distribution of the gas.
-
The disk around T Cha is in Keplerian rotation, and the estimated dynamical mass of the central object, M∗ = 1.5 ± 0.2 M⊙, is in good agreement with previous estimations based on evolutionary tracks.
-
The dusty disk is resolved in the continuum observations at 850 μm and it shows a similar i and PA to the gaseous disk. The continuum intensity profile displays two emission bumps separated by 40 AU, suggesting the presence of an inner dust gap as predicted by SED modeling, and an outer radius of ~80 AU. The profiles are different at both sides of the disk, which points towards asymmetries in the dust distribution. These data allow us to rule out both the very small and large Rout families of SED models.
-
Radiative transfer models including a truncated power law prescription for the surface density profile cannot reproduce simultaneously the gas and dust profiles. We can fit both components simultaneously using a tapered-edge model prescription for the surface density. The best model provides values of γ = 0.5, and Rc = 50 AU, which is consistent with having most of the disk mass within the inner 50 AU.
Acknowledgments
This paper makes use of the following ALMA data: ADS/JAO.ALMA#2011.0.00921.S. ALMA is a partnership of ESO (representing its member states), NSF (USA) and NINS (Japan), together with NRC (Canada) and NSC and ASIAA (Taiwan), in cooperation with the Republic of Chile. The Joint ALMA Observatory is operated by ESO, AUI/NRAO and NAOJ. The National Radio Astronomy Observatory is a facility of the National Science Foundation operated under cooperative agreement by Associated Universities, Inc. This research has been funded by Spanish grants AYA2010-21161-C02-02 and AYA2012-38897-C02-01. I.d.G. and E.M. acknowledge support from MICINN (Spain) AYA2011-30228-C03 grant (including FEDER funds). C.P. acknowledges support from the Millennium Science Initiative (Chilean Ministry of Economy), through grant Nucleus P10-022-F and from the European Commission′s 7th Framework Program (contract 284405).
References
- Alcala, J. M., Covino, E., Franchini, M., et al. 1993, A&A, 272, 225 [NASA ADS] [Google Scholar]
- Andrews, S. M., Wilner, D. J., Hughes, A. M., et al. 2012, ApJ, 744, 162 [NASA ADS] [CrossRef] [Google Scholar]
- Brown, J. M., Blake, G. A., Dullemond, C. P., et al. 2007, ApJ, 664, L107 [NASA ADS] [CrossRef] [Google Scholar]
- Cieza, L. A., Olofsson, J., Harvey, P. M., et al. 2011, ApJ, 741, L25 [NASA ADS] [CrossRef] [Google Scholar]
- de Gregorio-Monsalvo, I., Ménard, F., Dent, W., et al. 2013, A&A, 557, A133 [NASA ADS] [CrossRef] [EDP Sciences] [Google Scholar]
- Dutrey, A., Wakelam, V., Boehler, Y., et al. 2011, A&A, 535, A104 [NASA ADS] [CrossRef] [EDP Sciences] [Google Scholar]
- Guilloteau, S., Dutrey, A., Wakelam, V., et al. 2012, A&A, 548, A70 [NASA ADS] [CrossRef] [EDP Sciences] [Google Scholar]
- Huélamo, N., Lacour, S., Tuthill, P., et al. 2011, A&A, 528, L7 [NASA ADS] [CrossRef] [EDP Sciences] [Google Scholar]
- Hughes, A. M., Wilner, D. J., Qi, C., & Hogerheijde, M. R. 2008, ApJ, 678, 1119 [NASA ADS] [CrossRef] [Google Scholar]
- Ikeda, M., Kawaguchi, K., Takakuwa, S., et al. 2002, A&A, 390, 363 [NASA ADS] [CrossRef] [EDP Sciences] [Google Scholar]
- Isella, A., Testi, L., Natta, A., et al. 2007, A&A, 469, 213 [CrossRef] [EDP Sciences] [Google Scholar]
- Kastner, J., Punzi, K., Rodriguez, D., et al. 2013, in Protostars and Planets VI Posters, 22 [Google Scholar]
- Matthews, H. E., Marten, A., Moreno, R., & Owen, T. 2002, ApJ, 580, 598 [NASA ADS] [CrossRef] [Google Scholar]
- Murphy, S. J., Lawson, W. A., & Bessell, M. S. 2013, MNRAS, 435, 1325 [NASA ADS] [CrossRef] [Google Scholar]
- Nehmé, C., Gry, C., Boulanger, F., et al. 2008, A&A, 483, 471 [NASA ADS] [CrossRef] [EDP Sciences] [Google Scholar]
- Olofsson, J., Benisty, M., Le Bouquin, J.-B., et al. 2013, A&A, 552, A4 [NASA ADS] [CrossRef] [EDP Sciences] [Google Scholar]
- Pascucci, I., & Sterzik, M. 2009, ApJ, 702, 724 [NASA ADS] [CrossRef] [Google Scholar]
- Piétu, V., Guilloteau, S., Di Folco, E., Dutrey, A., & Boehler, Y. 2014, A&A, 564, A95 [NASA ADS] [CrossRef] [EDP Sciences] [Google Scholar]
- Pinte, C., Ménard, F., Duchêne, G., & Bastien, P. 2006, A&A, 459, 797 [NASA ADS] [CrossRef] [EDP Sciences] [Google Scholar]
- Pinte, C., Fouchet, L., Ménard, F., Gonzalez, J.-F., & Duchêne, G. 2007, A&A, 469, 963 [NASA ADS] [CrossRef] [EDP Sciences] [Google Scholar]
- Pinte, C., Harries, T. J., Min, M., et al. 2009, A&A, 498, 967 [NASA ADS] [CrossRef] [EDP Sciences] [Google Scholar]
- Press, W. H., Teukolsky, S. A., Vetterling, W. T., & Flannery, B. P. 1992, Numerical recipes in FORTRAN. The art of scientific computing, 2nd edn. (Cambridge University Press) [Google Scholar]
- Sacco, G. G., Kastner, J. H., Forveille, T., et al. 2014, A&A, 561, A42 [NASA ADS] [CrossRef] [EDP Sciences] [Google Scholar]
- Schisano, E., Covino, E., Alcalá, J. M., et al. 2009, A&A, 501, 1013 [NASA ADS] [CrossRef] [EDP Sciences] [Google Scholar]
- Torres, C. A. O., Quast, G. R., Melo, C. H. F., & Sterzik, M. F. 2008, in Young Nearby Loose Associations, ed. B. Reipurth, 757 [Google Scholar]
- van der Plas, G., Casassus, S., Ménard, F., et al. 2014, ApJ, 792, L25 [Google Scholar]
All Figures
|
Fig. 1 Integrated emission maps of the CO(3–2), 13CO(3–2), and the CS(7–6) transitions (from left to right). The black contours represent the continuum emission at 850 μm at 5, 15, 30, 45, 60, 75, 90, and 110σ where 1σ is 0.7 mJy beam-1. We detect two emission bumps separated by 40 AU and an outer dust radius of 79 AU. The white ellipses are the synthesized beams for the spectral emission lines and the green ellipse is the synthesized beam for the continuum map. The white dashed line in the left panel represents the axis where the position–velocity diagram in Fig. 4 has been obtained. |
| In the text | |
|
Fig. 2 Intensity-weighted mean velocity maps (first-order moment, 2σ cut for CO(3–2) and 13CO(3–2), and 1.5σ cut for CS(7–6)). |
| In the text | |
|
Fig. 3 Top and middle panels: continuum and gas radial intensity profiles. The blue (SE) and red (NW) data points are the ALMA data (over 5σ) at both sides of the disk. In the case of the continuum we have also included the average profile (green data). The solid black lines show the best model using a tapered edge prescription for the surface density, while the dashed lines show the best model using a truncated power law. The upper panels show the continuum data, including a zoom of the outer regions, while the middle panels include the CO profiles. Bottom panel: the observed SED and the fit from the tapered edge model presented here. |
| In the text | |
|
Fig. 4 Position–velocity diagram along the disk major axis (see exact axis represented in Fig. 1, left panel). The best fit to the data correspond to a Keplerian velocity profile for a systemic velocity of 5.95 km s-1; an inclination of i(°) = 67; and a central mass of 1.3 (dotted), 1.5 (solid) and 1.7 M⊙ (dashed). |
| In the text | |
|
Fig. 5 Bayesian probability distributions of the disk parameters of T Cha. The blue lines show the results without fixing any parameters, while the red lines show the results after fixing the outer disk radius and the disk inclination. |
| In the text | |
Current usage metrics show cumulative count of Article Views (full-text article views including HTML views, PDF and ePub downloads, according to the available data) and Abstracts Views on Vision4Press platform.
Data correspond to usage on the plateform after 2015. The current usage metrics is available 48-96 hours after online publication and is updated daily on week days.
Initial download of the metrics may take a while.