Fig. 1
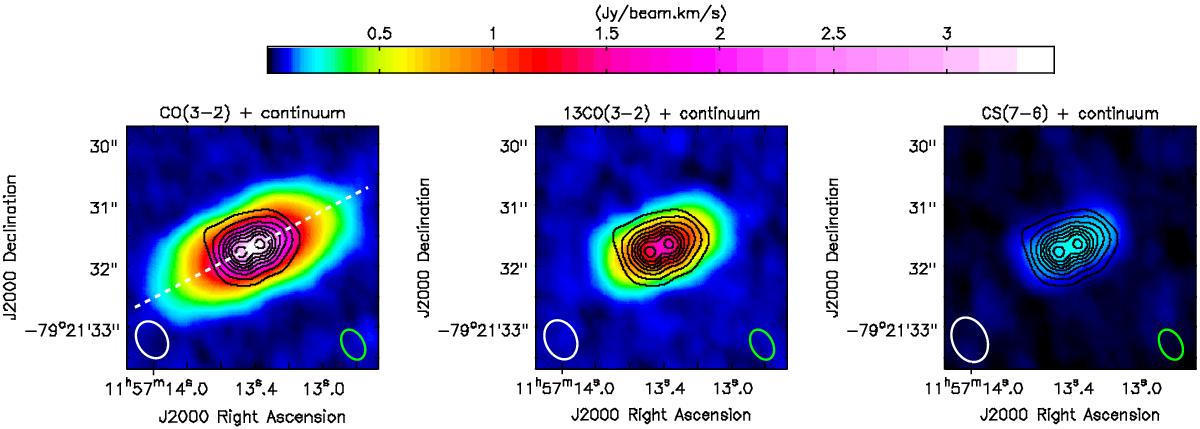
Integrated emission maps of the CO(3–2), 13CO(3–2), and the CS(7–6) transitions (from left to right). The black contours represent the continuum emission at 850 μm at 5, 15, 30, 45, 60, 75, 90, and 110σ where 1σ is 0.7 mJy beam-1. We detect two emission bumps separated by 40 AU and an outer dust radius of 79 AU. The white ellipses are the synthesized beams for the spectral emission lines and the green ellipse is the synthesized beam for the continuum map. The white dashed line in the left panel represents the axis where the position–velocity diagram in Fig. 4 has been obtained.
Current usage metrics show cumulative count of Article Views (full-text article views including HTML views, PDF and ePub downloads, according to the available data) and Abstracts Views on Vision4Press platform.
Data correspond to usage on the plateform after 2015. The current usage metrics is available 48-96 hours after online publication and is updated daily on week days.
Initial download of the metrics may take a while.