Fig. 3
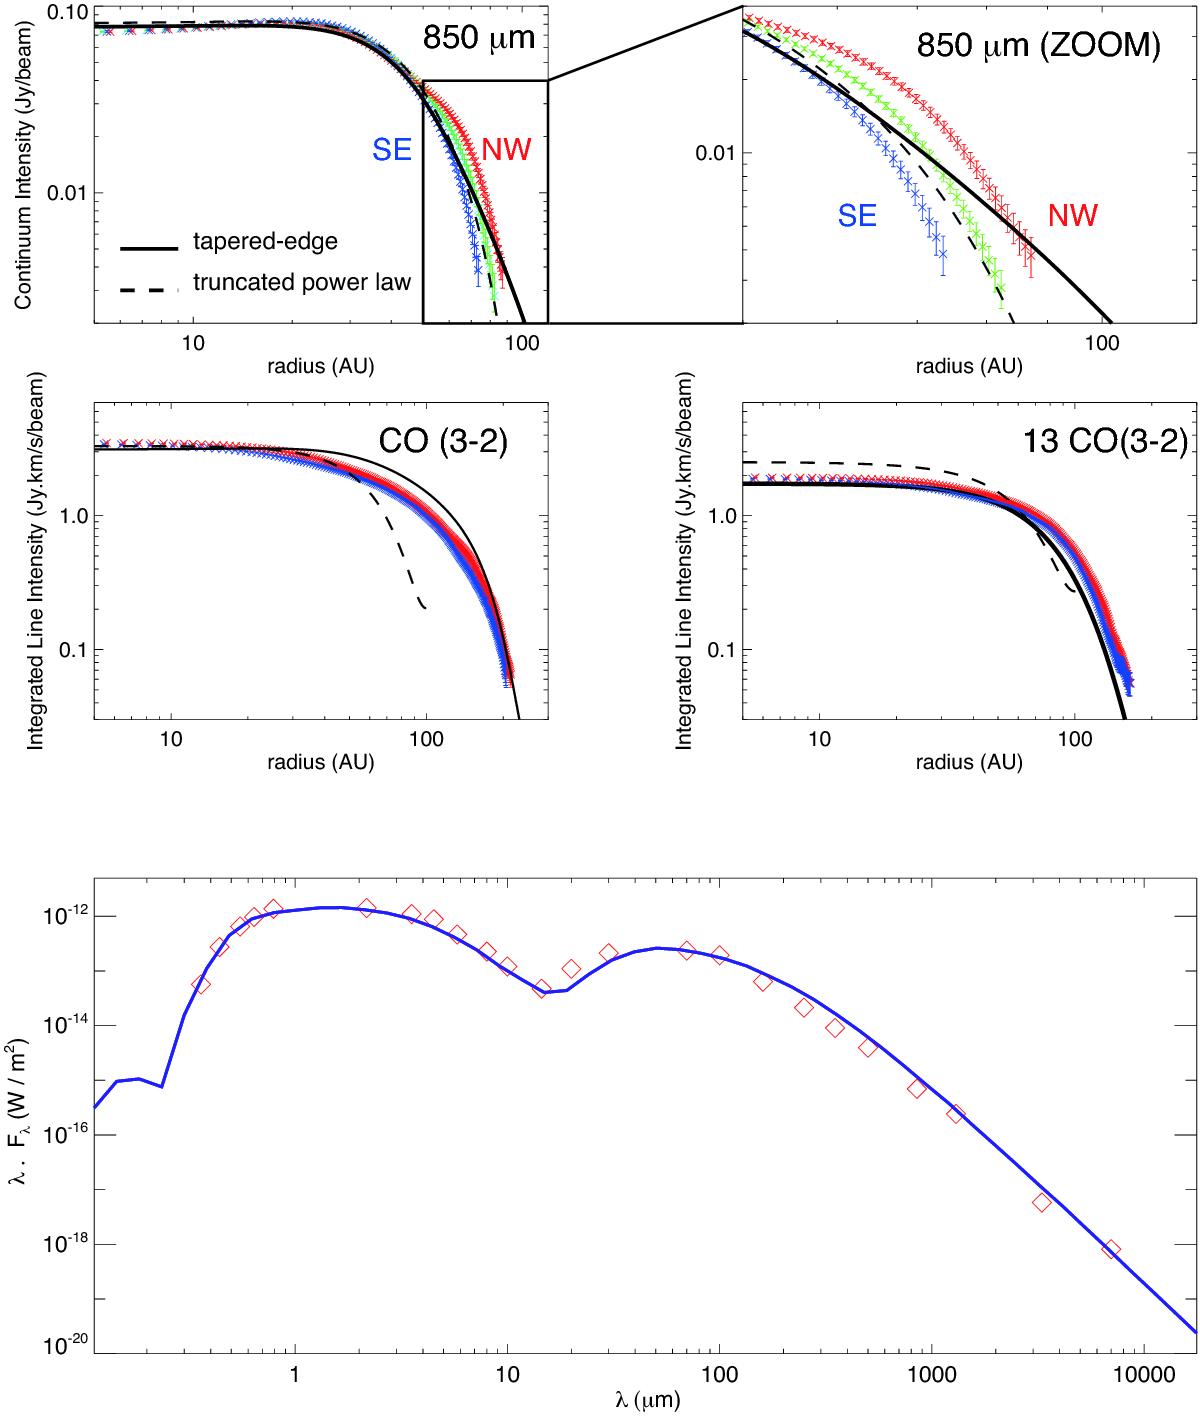
Top and middle panels: continuum and gas radial intensity profiles. The blue (SE) and red (NW) data points are the ALMA data (over 5σ) at both sides of the disk. In the case of the continuum we have also included the average profile (green data). The solid black lines show the best model using a tapered edge prescription for the surface density, while the dashed lines show the best model using a truncated power law. The upper panels show the continuum data, including a zoom of the outer regions, while the middle panels include the CO profiles. Bottom panel: the observed SED and the fit from the tapered edge model presented here.
Current usage metrics show cumulative count of Article Views (full-text article views including HTML views, PDF and ePub downloads, according to the available data) and Abstracts Views on Vision4Press platform.
Data correspond to usage on the plateform after 2015. The current usage metrics is available 48-96 hours after online publication and is updated daily on week days.
Initial download of the metrics may take a while.