| Issue |
A&A
Volume 574, February 2015
|
|
|---|---|---|
| Article Number | A100 | |
| Number of page(s) | 7 | |
| Section | Interstellar and circumstellar matter | |
| DOI | https://doi.org/10.1051/0004-6361/201425070 | |
| Published online | 30 January 2015 | |
H.E.S.S. detection of TeV emission from the interaction region between the supernova remnant G349.7+0.2 and a molecular cloud
1
Universität Hamburg, Institut für Experimentalphysik,
Luruper Chaussee 149,
22761
Hamburg, Germany
2
Max-Planck-Institut für Kernphysik, PO Box 103980, 69029
Heidelberg,
Germany
3
Dublin Institute for Advanced Studies,
31 Fitzwilliam Place,
Dublin 2,
Ireland
4 National Academy of Sciences of the Republic of Armenia,
Marshall Baghramian Avenue, 24, 0019 Yerevan, Republic of Armenia
5
Yerevan Physics Institute, 2 Alikhanian Brothers St., 375036
Yerevan,
Armenia
6
Institut für Physik, Humboldt-Universität zu Berlin,
Newtonstr. 15, 12489
Berlin,
Germany
7 University of Namibia, Department of Physics, 13301 Private
Bag, Windhoek, Namibia
8
University of Durham, Department of Physics,
South Road, Durham
DH1 3LE,
UK
9
GRAPPA, Anton Pannekoek Institute for Astronomy, University of
Amsterdam, Science Park
904, 1098 XH
Amsterdam, The
Netherlands
10
ObserwatoriumAstronomiczne, Uniwersytet Jagielloński, ul. Orla
171, 30-244
Kraków,
Poland
11
Now at Harvard-Smithsonian Center for Astrophysics, 60 Garden St.,
MS-20, Cambridge,
MA
02138,
USA
12
Department of Physics and Electrical Engineering, Linnaeus
University, 351
95
Växjö,
Sweden
13
Institut für Theoretische Physik, Lehrstuhl IV: Weltraum und
Astrophysik, Ruhr-Universität Bochum, 44780
Bochum,
Germany
14
GRAPPA, Anton Pannekoek Institute for Astronomy and Institute of
High-Energy Physics, University of Amsterdam, Science Park 904, 1098 XH
Amsterdam, The
Netherlands
15
Institut für Astro- und Teilchenphysik,
Leopold-Franzens-Universität Innsbruck, 6020
Innsbruck,
Austria
16
Laboratoire Leprince-Ringuet, École Polytechnique,
CNRS/IN2P3, 91128
Palaiseau,
France
17
Now at Santa Cruz Institute for Particle Physics, Department of
Physics, University of California at Santa Cruz, Santa Cruz, CA
95064,
USA
18
Centre for Space Research, North-West University,
2520
Potchefstroom, South
Africa
19
LUTH, Observatoire de Paris, CNRS, Université Paris
Diderot, 5 Place Jules
Janssen, 92190
Meudon,
France
20
LPNHE, Université Pierre et Marie Curie Paris 6, Université Denis
Diderot Paris 7, CNRS/IN2P3, 4
Place Jussieu, 75252
Paris Cedex 5,
France
21
Institut für Astronomie und Astrophysik, Universität
Tübingen, Sand 1,
72076
Tübingen,
Germany
22
Laboratoire Univers et Particules de Montpellier, Université
Montpellier 2, CNRS/IN2P3, CC 72,
Place Eugène Bataillon, 34095
Montpellier Cedex 5,
France
23
DSM/Irfu, CEA Saclay, 91191
Gif-Sur-Yvette Cedex,
France
24
Astronomical Observatory, The University of Warsaw,
Al. Ujazdowskie 4, 00-478
Warsaw,
Poland
25
Instytut Fizyki Ja¸drowej PAN, ul. Radzikowskiego
152, 31-342
Kraków,
Poland
26
School of Physics, University of the Witwatersrand,
1 Jan Smuts Avenue, Braamfontein,
2050
Johannesburg, South
Africa
27
Landessternwarte, Universität Heidelberg,
Königstuhl, 69117
Heidelberg,
Germany
28
Oskar Klein Centre, Department of Physics, Stockholm University,
Albanova University Center, 10691
Stockholm,
Sweden
29
School of Chemistry & Physics, University of
Adelaide, 5005
Adelaide,
Australia
30
APC, AstroParticule et Cosmologie, Université Paris Diderot,
CNRS/IN2P3, CEA/Irfu, Observatoire de Paris, Sorbonne Paris Cité, 10 rue Alice Domon et Léonie
Duquet, 75205
Paris Cedex 13,
France
31
Univ. Grenoble Alpes, IPAG, and CNRS, IPAG, 38000
Grenoble,
France
32
Department of Physics and Astronomy, The University of Leicester,
University Road, Leicester, LE1
7RH, UK
33
Nicolaus Copernicus Astronomical Center, ul. Bartycka
18, 00-716
Warsaw,
Poland
34
Institut für Physik und Astronomie, Universität
Potsdam, Karl-Liebknecht-Strasse
24/25, 14476
Potsdam,
Germany
35
Laboratoire d’Annecy-le-Vieux de Physique des Particules,
Université de Savoie, CNRS/IN2P3, 74941
Annecy-le-Vieux,
France
36
DESY, 15738
Zeuthen,
Germany
37
Université Bordeaux 1, CNRS/IN2P3, Centre d’Études Nucléaires de Bordeaux
Gradignan, 33175
Gradignan,
France
38
Universität Erlangen-Nürnberg, Physikalisches
Institut, Erwin-Rommel-Str.
1, 91058
Erlangen,
Germany
39
Centre for Astronomy, Faculty of Physics, Astronomy and
Informatics, Nicolaus Copernicus University, Grudziadzka 5, 87-100
Torun,
Poland
40
Department of Physics, University of the Free State,
PO Box 339, 9300
Bloemfontein, South
Africa
41
GRAPPA, Institute of High-Energy Physics, University of
Amsterdam, Science Park
904, 1098 XH
Amsterdam, The
Netherlands
Received: 28 September 2014
Accepted: 24 November 2014
G349.7+0.2 is a young Galactic supernova remnant (SNR) located at the distance of 11.5 kpc and observed across the entire electromagnetic spectrum from radio to high energy (HE; 0.1 GeV <E< 100 GeV) γ-rays. Radio and infrared observations indicate that the remnant is interacting with a molecular cloud. In this paper, the detection of very high energy (VHE, E> 100 GeV) γ-ray emission coincident with this SNR with the High Energy Stereoscopic System (H.E.S.S.) is reported. This makes it one of the farthest Galactic SNR ever detected in this domain. An integral flux F(E> 400 GeV) = (6.5 ± 1.1stat ± 1.3syst) × 10−13 ph cm−2 s−1 corresponding to ~0.7% of that of the Crab Nebula and to a luminosity of ~1034 erg s−1 above the same energy threshold, and a steep photon index ΓVHE = 2.8 ± 0.27stat ± 0.20syst are measured. The analysis of more than 5 yr of Fermi-LAT data towards this source shows a power-law like spectrum with a best-fit photon index ΓHE = 2.2 ± 0.04stat+0.13−0.31 sys. The combined γ-ray spectrum of G349.7+0.2 can be described by either a broken power-law (BPL) or a power-law with exponential (or sub-exponential) cutoff (PLC). In the former case, the photon break energy is found at Ebr,γ = 55+70−30 GeV, slightly higher than what is usually observed in the HE/VHE γ-ray emitting middle-aged SNRs known to be interacting with molecular clouds. In the latter case, the exponential (respectively sub-exponential) cutoff energy is measured at Ecut,γ = 1.4+1.6−0.55 (respectively 0.35+0.75−0.21) TeV. A pion-decay process resulting from the interaction of the accelerated protons and nuclei with the dense surrounding medium is clearly the preferred scenario to explain the γ-ray emission. The BPL with a spectral steepening of 0.5−1 and the PLC provide equally good fits to the data. The product of the average gas density and the total energy content of accelerated protons and nuclei amounts to nHWp ~ 5 × 1051 erg cm−3.
Key words: gamma rays: general / ISM: supernova remnants / ISM: clouds
© ESO, 2015
1. Introduction
The question of the origin of galactic cosmic rays (CRs) dates back one century. In the 1930s, Baade & Zwicky (1934) proposed supernovae (SNe) as probable sources of Galactic CRs. According to the diffusive shock acceleration (DSA) theory (e.g. Bell 1978a,b) particles are accelerated at the supernova remnant (SNR) shock waves. The spectrum of the accelerated particles follows a power-law shape with exponential cutoffs and spectral indices of p ~ 2, compatible with radio measurements. Such spectra have also been observed in γ-rays from several isolated SNRs (e.g. Aharonian et al. 2007). However, recent Fermi-LAT observations of SNRs interacting with molecular clouds (MC) have revealed spectral breaks above a few GeV (Abdo et al. 2009, 2010a,b,c; Ackermann et al. 2013; Castro et al. 2013).
G349.7+0.2 is a bright Galactic SNR with a small angular size of ~2.5′ × 2′ (Green 2009) and a roughly circular morphology similar in radio (Shaver et al. 1985) and X-rays (Slane et al. 2002; Lazendic et al. 2005). The brightness enhancement seen towards the southwest of the SNR suggests that G349.7+0.2 is expanding into a density gradient caused by a HI cloud. Indeed, the coincidence of G349.7+0.2 with a dense MC (Dubner et al. 2004) and the detection of five OH (1720 MHz) masers towards the centre of the SNR (Frail et al. 1996) and of line emissions from several molecular transitions (Reynoso & Mangum 2000; Lazendic et al. 2010) provide evidence in support of an interaction between the SNR and the MC. These masers and molecular line emissions are measured at similar velocities which, together with HI absorption measurements, originally placed the SNR at a distance of ~22.4 kpc. Tian & Leahy (2014) have revised the kinematic distance to ~11.5 kpc based on updated knowledge of the kinematics in the inner Galaxy (Dame & Thaddeus 2008; Rodriguez-Fernandez & Combes 2008) together with high-resolution 21 cm HI (from the Southern Galactic Plane Survey, SGPS; McClure-Griffiths et al. 2012) and CO data (Reynoso & Mangum 2000). Thus, G349.7+0.2 is located at the near edge of the Far 3 kpc Arm rather than on the far side of the Galaxy. This distance estimate was confirmed by Yasumi et al. (2014). At the revised distance, the SNR radius and age are ~3.8 pc and ~1800 yr, respectively. The overall X-ray emission of G349.7+0.2 is best fit with two thermal components from the shocked SN ejecta and circumstellar material, and results in a blast wave velocity estimate of ~700−900 km s-1 (Slane et al. 2002; Lazendic et al. 2005). In the high-energy (HE; 0.1 GeV <E< 100 GeV) γ-ray domain, Castro & Slane (2010) discovered an unresolved γ-ray source coincident with G349.7+0.2 based on Fermi-LAT observations, designated as 2FGL J1718.1-3725 in the two-year Fermi-LAT catalog (Nolan et al. 2012). The spectrum was best fit with a simple power-law with ΓHE = 2.1 ± 0.1, and the addition of an exponential cutoff was found to only marginally improve the fit.
Details of the data set for the analysis of G349.7+0.2.
In this paper the detection of very high energy (VHE, E> 100 GeV) γ-ray emission coincident with this SNR in observations with the High Energy Stereoscopic System (H.E.S.S.) experiment is reported. H.E.S.S. observations and data analysis results are presented in Sect. 2, together with the analysis of more than 5 yr of Fermi-LAT data towards G349.7+0.2. Based on all the available multi-wavelength data, the SNR-MC scenario to account for the broadband spectral energy distribution of G349.7+0.2 is discussed in Sect. 3, in the light of recent theoretical works aimed at explaining the γ-ray spectrum of such interacting SNRs.
2. Analysis
2.1. H.E.S.S. observations
H.E.S.S. is an array of five imaging atmospheric Cherenkov telescopes (IACTs) located in the Khomas Highland of Namibia at an altitude of 1800 m above sea level (Aharonian et al. 2006a). The fifth telescope (28-m diameter) started operation in September 2012. All H.E.S.S. data used in this paper have been taken with the four-telescope array, which detects γ-rays above an energy threshold of ~100 GeV and covers a field of view of 5°diameter. The primary particle direction and energy are reconstructed with event-by-event resolutions of ~0.1° and ~15%, respectively.
The data set for the source analysis includes observations taken from 2004 to 2012 and is summarized in Table 1. Two data sets are made up of Galactic Scan runs from previous Galactic Plane surveys in 2004 and 2008 (Carrigan et al. 2013). A set of 24 dedicated runs were taken using the so-called wobble mode for which the source is alternatively offset from the pointing direction by a small distance varying from 0.40° to 0.75°. This method allows for the evaluation of the signal and the background from the same observation. A fourth data set is composed of wobble runs dedicated to the observation of other nearby sources, in particular RX J1713.7−3946 (Aharonian et al. 2007) located at ~2.5° from G349.7+0.2. The total data set comprises 113 h of observations (live time) after applying quality cuts.
Data have been analysed with the Model Analysis as described in de Naurois & Rolland (2009) and using Standard cuts. The analysis has been cross-checked with an independent data calibration chain and multivariate analysis method (Ohm et al. 2009). The extraction region is defined as a circular region of radius θ = 0.1° centred on the nominal position of the X-ray source G349.7+0.2 from the Chandra Supernova Remnant Catalog1:  ,
,  . After background subtraction with the reflected background method (Berge et al. 2007), an excess of 163 VHE γ-rays is detected within the analysis region, which corresponds to a significance level of 6.6σ according to Eq. (17) from Li & Ma (1983). Given the existence of GeV emission and a source extent of ~2.5′ × 2′ (much smaller than the H.E.S.S. PSF), an unresolved VHE γ-ray signal was expected and only one source position and extent have been tested. The excess is point-like within the H.E.S.S. point spread function (PSF) uncertainties and the best fit position of the VHE emission within the extraction region is found to be
  ,
,  , compatible with the X-ray position of G349.7+0.2. An upper limit on the source extent of 0.04° (95% confidence level, CL), larger than the SNR size seen in radio and X-rays, is obtained based on the log-likelihood method profile.
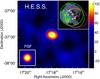 |
Fig. 1 H.E.S.S. γ-ray excess map of G349.7+0.2. The image is smoothed with a Gaussian with a width of 0.06° corresponding to the PSF of the analysis (shown in the bottom left inset). The color scale represents the excess counts per surface area of π(0.06°)2. Pixels within this area are correlated. The solid green and dashed white circles denote the G349.7+0.2 radio shell and the H.E.S.S. ON region, respectively. The upper right inset represents the Chandra image of G349.7+0.2 with the five OH (1720 MHz) masers (white crosses) delineating the associated MC as found by Dubner et al. (2004). The best fit position together with its 2σ CL contours of the TeV emission are marked with a magenta inverted triangle and magenta dashed contours, respectively. The Fermi-LAT best fit position and its 2σ CL contours are shown as a yellow triangle and a yellow dashed contour. The green circle denoting the G349.7+0.2 extent is reproduced in the inset for scaling. |
Figure 1 shows the excess count image smoothed with a Gaussian of width 0.06° which corresponds to the 68% containment radius of the H.E.S.S. PSF for this analysis. The SNR G349.7+0.2 and the H.E.S.S. analysis region are indicated by solid green and white dashed circles, respectively. As seen in the inset image, the 2σ error contours of the H.E.S.S. best fit position show that the position of the VHE source is compatible with the whole SNR as observed with Chandra as well as with the five OH (1720 MHz) masers.
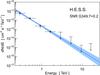 |
Fig. 2 H.E.S.S. forward folded spectrum of G349.7+0.2. The blue line is the best fit of a power-law to the data as a function of the energy (unfolded from the H.E.S.S. response functions). The blue bowtie is the uncertainty of the fit given at 68% CL. Upper limits are given at 99% CL. |
The energy spectrum of the VHE emission coincident with G349.7+0.2 is extracted above 220 GeV and fitted using the forward folding technique described in Piron et al. (2001). The resolution-unfolded spectrum is shown on Fig. 2. The spectrum is well described by a power-law defined as dΦ/dE ∝ E−Γ with a photon index of ΓVHE = 2.8 ± 0.27stat ± 0.20syst (χ2/nd.o.f. = 54.1/56). The integrated photon flux above 400 GeV is F(E> 400 GeV) = (6.5 ± 1.1stat ± 1.3syst) × 10-13 ph cm-2 s-1 which corresponds to 0.7% of the Crab Nebula flux (Aharonian et al. 2006a) and to a luminosity of ~1034 erg s-1 above the same energy threshold. Spectral models of a curved power-law and a power-law with exponential cutoff do not improve the fit of the spectrum significantly.
2.2. Fermi-LAT observations
The LAT detector is the main instrument on board the Fermi Gamma-Ray Space Telescope. It consists of a pair-conversion imaging telescope detecting γ-ray photons in the energy range between 20 MeV and ≳300 GeV, as described by Atwood et al. (2009). The LAT has a effective area of ~8000 cm2 on-axis above 1 GeV, a field of view of ~2.4 sr and an angular resolution of ~0.6° (68% containment radius) at 1 GeV for events converting in the front section of the tracker2.
A GeV γ-ray excess associated with G349.7+0.2 was first reported by Castro & Slane (2010) using 1 year of Fermi-LAT data. Since this discovery, several improvements have been made both in the instrument response functions (IRFs) and in the data analysis software. The following analysis was performed using 5.25 yr of data collected from 2008 August 4 to 2013 November 6. The latest version of the publicly available Fermi Science Tools3(v9r32p5) was used, with the P7REP_SOURCE_V15 IRFs and the user package enrico (Sanchez & Deil 2013). Events at normal incidence (cos(θ) > 0.975), with zenith angles smaller than 100°, and flagged as source class events were selected to perform a binned likelihood analysis. A region of 10° around the position of G349.7+0.2 was analysed. All sources from the Fermi-LAT two-year source catalog (Nolan et al. 2012) within 12° around the target were added. The ones closer than 8° (i.e. the 95% containment radius of the LAT PSF for front- and back-converted events at 200 MeV), and with a significance larger than 3, were modeled simultaneously (with fixed positions). Additionally, the Galactic and extra-galactic diffuse models were used with their respective normalization treated as free parameter. The likelihood analysis was performed with the gtlike tool. To determine the significance of the signal, the test-statistic (TS) method was used:  , where Lps and Lnull are the maximum likelihood value for a model with and without an additional source, respectively.
For the spatial analysis, γ-ray events with 5 GeV<Eγ< 300 GeV were selected. Such a selection provides a good instrument PSF and both low source confusion and background level from the Galactic γ-ray diffuse emission. The TS in this energy band is ~102. The source position, determined by gtfindsrc tool, is  ,
,  . The systematic errors are estimated according to the 2FGL catalog (Nolan et al. 2012). The Fermi-LAT source is compatible with the H.E.S.S. position at less than 1σ and is consistent with the radio shell of G349.7+0.2, as shown on Fig. 1. The Fermi-LAT residual count map shows no evidence of a significant source extension after point like source subtraction.
For the spectral analysis, front- and back-converted events in the 0.2−300 GeV energy range were selected. The lower bound was chosen in order to reduce both the systematic uncertainties on the Fermi-LAT PSF and acceptance, and the level of Galactic γ-ray diffuse emission. In the following the effect of the underlying Galactic diffuse emission on the source flux was estimated by varying artificially the normalization of the Galactic background model by ±6% from the best-fit value. The systematic uncertainties related to the IRFs are not estimated here as they are usually smaller than those arising from the Galactic diffuse emission in the ~0.1−50 GeV energy range. A point-like power-law model at the position of the SNR was used and the best fit parameters were determined by the likelihood method. The source TS value from this analysis is ~201 and the best fit photon index  . The energy flux at the decorrelation energy E0 = 3.8 GeV is
  . The flux in the full energy range is
  . Analyses assuming log-parabola and smoothed broken power-law spectrum models were performed in the same energy range. No improvement of the fit was found indicating that there is no significant deviation from a pure spectral power-law. A binned spectral analysis was also performed following the same method described above in each energy bin. The resulting spectrum is shown in Fig. 3 and discussed in Sect. 3. A 99% CL upper limit was calculated in the bins with a signal significance lower than 3σ. The statistical uncertainties are given at 1σ.
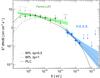 |
Fig. 3 γ-ray spectrum of G349.7+0.2. The H.E.S.S. (blue) and Fermi-LAT (green) spectra are shown with their 68% CL bowtie. For the Fermi-LAT spectral points the statistical errors are marked green while the statistical errors including the systematic errors are grey. The H.E.S.S. points are given with their statistical errors only. The π0-decay emission spectra obtained with the best fit proton distributions are shown as dotted and dashed lines for the broken power-law (BPL) distributions with steepening Δp = 0.5 and 1, respectively, and as a solid line for the power-law with exponential cutoff (PLC) distribution. |
2.3. Combined analysis
The γ-ray source detected with Fermi-LAT and H.E.S.S. towards G349.7+0.2 shows that the object is a luminous Galactic SNR, with luminosities in the 0.2−300 GeV energy range and above 400 GeV of LHE ~ 3 × 1035 erg s-1 and LVHE ~ 1034 erg s-1, respectively, assuming a distance of 11.5 kpc. The VHE spectrum from G349.7+0.2 is well fitted with a steep power-law shape with photon index ΓVHE = 2.8 ± 0.27stat ± 0.20syst, which represents a steepening from the one measured at HE by Fermi-LAT (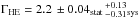 ) of
) of 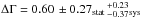 . The position of the spectral break is estimated through a likelihood ratio test statistic (Rolke et al. 2005) applied to the H.E.S.S. and Fermi-LAT data, taking both statistical and systematic uncertainties into account:
 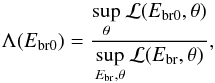 (1)where Ebr0 is the tested hypothesis. The supremum in the denominator is determined over the full parameter space. The spectral indices and the normalization of the photon spectrum are considered as nuisance parameters represented by the θ variable. They are set free. The minimum of the likelihood ratio is reached at the photon energy Ebr,γ = 55 GeV, and the 68% confidence interval is [ 25;125 ] GeV. The γ-ray spectral steepening is thus precisely at the transition between the Fermi-LAT and H.E.S.S. domains. A cutoff e−(E/Ecut)β, where Ecut is the cutoff energy and β defines the spectral shape in the cutoff region could also accommodate the steep and faint VHE spectrum at these intermediate energies. Following the same method as for the broken power-law γ-ray spectrum, the spectral turnover is found to be at
  (respectively
  ) TeV assuming a power-law photon spectrum with an exponential (respectively sub-exponential, β = 0.5) cutoff. The shape of the cutoff in the photon spectra with respect to that in the particle spectrum depends on the emission process, and exponential cutoffs in the particle spectrum typically result in sub-exponential cutoffs in the photon spectrum for pion decay (Kelner et al. 2006) and inverse Compton emission (Lefa et al. 2012). A power-law particle spectrum is predicted by DSA4, and a cutoff is generally formed. Such a spectrum can be interpreted as the emission from accelerated particles at the SNR shock, the cutoff being due to either escape of the highest energy particles or limitation of the acceleration because of the SNR age or radiative losses (for leptons) (Aharonian et al. 2007). On the other hand, γ-ray broken power-law spectra with Ebr,γ ~ 1−20 GeV have been observed in several SNRs known to be interacting with MCs (see Jiang et al. 2010, and references therein), such as W28 (Aharonian et al. 2008; Abdo et al. 2010a), W51C (Abdo et al. 2009; Aleksić et al. 2012), W49B (Abdo et al. 2010c; Brun et al. 2011), IC 443 (Acciari et al. 2009; Ackermann et al. 2013) or W41 (Aharonian et al. 2006b; Castro et al. 2013). The CR spectral shape (broken power-law and exponential cutoff power-law) underlying this γ-ray spectrum will be investigated in the following sections in view of the γ-ray emission scenarios.
3. Discussion
3.1. Multi-wavelength considerations
In order to address the question of the origin of the γ-ray emission from G349.7+0.2, the published radio and X-ray data from the SNR have been assembled. Radio flux densities are provided by Green (2009) (Fν(1 GHz) = 20 Jy) and Clark & Caswell (1976) (Fν(408 MHz) = 31 Jy, Fν(5 GHz) = 9.1 Jy). X-ray observations of G349.7+0.2 with Chandra have revealed the thermal nature of the SNR emission, from both the ejecta and shocked circumstellar medium (Lazendic et al. 2005). A power-law (non-thermal) component was estimated to contribute to less than 2.6% (at 3σ CL) of the total flux in the 0.5−10 keV range for any photon index between 1.5 and 3. This translates into a flux upper limit of 1.7 × 10⁻¹¹ erg cm-2 s-1. A post-shock Hydrogen density of ~7 cm-3, leading to an ISM density of ~1.7 cm-3 under the assumption of a strong shock was derived from the soft component of the SNR thermal X-ray spectrum (Lazendic et al. 2005). From 12CO observations, Dubner et al. (2004) reported that G349.7+0.2 is associated with a MC, whose total mass and average density are estimated to be of MMC ~ 5 × 10³M⊙ and nMC ~ 2 × 104 cm-3 at 11.5 kpc, respectively. Another density estimate comes from the presence of 5 OH (1720 MHz) masers (Frail et al. 1996) and strong H2 lines (Hewitt et al. 2009) towards the centre of the remnant, both tracers originating from shocked molecular region of very high density (n ~ 104..6 cm-3). As discussed by Lazendic et al. (2005) and Castro & Slane (2010), these differences in density estimates indicate that the SNR is expanding in an inhomogeneous, likely clumpy, medium.
3.2. SNR shell emission
To quantify the total amount of energy required to explain the γ-ray spectrum, a simple time-independent one-zone model of accelerated particles and their associated broadband emission spectra is compared to the multi-wavelength (radio and X-ray) data described in the previous section. A power-law with exponential cutoff model for the CRs spectrum is adopted: dN/ dE ∝ E−pexp(−E/Ecut). Typical values for the SN explosion energy and for the fraction that goes into CR acceleration are assumed: ESN = 1051 erg and ϵCR ~ 0.1 (i.e. Wp + We = ϵCRESN, where Wp,e are the total amount of explosion energy going into protons and electrons acceleration, respectively). Photon spectra from non-thermal Bremsstrahlung (NBr), Inverse Compton (IC) and proton-proton (p-p, followed by π0 → 2γ) processes are computed according to Blumenthal & Gould (1970); Baring et al. (1999); Kafexhiu et al. (2014) (the hadronic emission is multiplied by the factor ~1.5 to take into account nuclei heavier than Hydrogen, Dermer 1986).
A NBr-dominated scenario requires an electron to proton ratio Kep ≥ 0.2, which is much higher than the values expected from CR abundances and from the modeling of the broadband emission from several SNRs, which lie in the ~10-2−10-3 range (Katz & Waxman 2008). The IC-dominated scenario requires a spectral shape much harder than the one observed at GeV energies. Moreover, values of both the energy content in radiating electrons (We ~ 8 × 1050 (d/11.5 kpc)2 erg) and the magnetic field (B ≤ 4 μG) for IC on CMB are unrealistic. The optical interstellar radiation field from Porter et al. (2008) has a negligible effect on the IC emission in this region of the Galaxy, while the previous parameters change to We ~ 1050 (d/11.5 kpc)2 erg and B ≤ 8 μG, when accounting for the infrared interstellar radiation fields. However the energy density of the different photon fields from Porter et al. (2008) is known to be subject to large uncertainties at small scales. Because of the large electron to proton ratio and the low magnetic field required in NBr- and IC-dominated scenarios, the leptonic origin of the γ-ray emission is disfavored.
The π0 decay dominated scenario leads to a product of the average gas density and the total energy content of accelerated hadrons of nHWp ~ 5 × 1051 (d/11.5 kpc)2 erg cm-3, similar to what has been derived for W51C (Abdo et al. 2009) and W49B (Abdo et al. 2010c). To constrain the parameters of the primary proton distribution, its resulting photon spectrum from p-p interactions (computed using the parametrization of Kafexhiu et al. 2014) is compared to the observed photon spectrum through a Markov chain Monte Carlo (MCMC) fitting procedure using the gammafit package5. The best-fit proton spectral parameters are a spectral index  and a cutoff energy of
  TeV. With an ISM density of ~1.7 cm-3, as discussed in the previous section, the π0 decay scenario would require a too large energy content in the accelerated protons and nuclei of ~3 × 1051 erg. Thus the γ-ray emission coincident with G349.7+0.2 clearly can not arise from the whole SNR shell assumed to evolve in an homogeneous ~1.7 cm-3 ISM, but rather from the region of the SNR-MC interaction. The π0-decay emission spectrum obtained with the best fit proton distribution is shown on Fig. 3. In the standard modelings of gamma-ray emission from MC illuminated by CRs from a nearby, non-interacting, source, the VHE emission from these escaping CRs is expected to be harder than the HE emission from particles still confined in the source (Gabici et al. 2009; Ellison & Bykov 2011). This is opposite to what is observed here from G349.7+0.2. Together with the CR energetics constraints, another scenario, in which the particular interaction region between the blast wave and the cloud at the origin of the HE/VHE emission, must be investigated.
3.3. SNR-MC interaction scenario
As mentioned in Sect. 2.3, spectral breaks at ~1−20 GeV have recently been observed in several interacting SNRs. These spectral features are not a priori predicted by the DSA theory and several theoretical scenarios have been put forward in order to explain γ-ray spectral breaks. They can be due to either acceleration effects on particles residing within the interacting SNR (Inoue et al. 2010; Uchiyama et al. 2010; Malkov et al. 2011, 2012; Tang et al. 2011) or diffusion of particles escaping from the SNR shock and diffusing in the MC (Li & Chen 2010; Ohira et al. 2011; Li & Chen 2012; Aharonian & Atoyan 1996). In particular ion-neutral collisions occurring when fast shocks interact with partially ionized material can lead to Alfvén wave damping (O’C Drury et al. 1996; Ptuskin & Zirakashvili 2003, 2005) and hence, to the reduction of the confinement of the highest energy particles which escape the system. As shown by Malkov et al. (2011) in the case of W44, and recently generalized by Malkov et al. (2012; see their Eq. (4)), a break naturally occurs at a few GeV, above which the particle spectrum steepens by one power Δp = 1. Ohira et al. (2011) have reinvestigated the distribution of CRs escaping from a SNR assumed to be of finite size, based on the escape-limited model of CR acceleration described in Ohira et al. (2010). In this model, once the forward shock approaches the MC modeled as a shell surrounding the SNR (more precisely, when the distance between the shock front and the MC inner radius equals the diffusion length of the escaping CRs) all particles are expected to escape from the SNR because of wave damping. Besides the breaks arising from the finiteness of the source and emission regions, another break, interpreted as the maximum particle energy in the SNR when it encounters the MC, is found. Both scenarios could reproduce the γ-ray spectrum from G349.7+0.2, though at the expense of several free parameters related to the diffusion and the MC properties.
The scenarios cited above assume that the γ-ray emission arises from hadronic interactions of accelerated protons and nuclei with the surrounding dense medium. To constrain the spectral shape of the accelerated particles within these scenarios, the same MCMC method as described in Sect. 3.2 was employed assuming a broken power-law for the proton spectrum. Two values were considered for the spectral steepening above the break energy: Δp = 1 as predicted by Malkov et al. (2011) and Δp = 0.5 as the spectral steepening appears to be lower than 1 in some γ-ray emitting SNR-MC systems (e.g. W28, IC 443, Abdo et al. 2010a; Ackermann et al. 2013). The best-fit parameters are a HE spectral index of  (respectively
  ) and a break energy
  (respectively
  ) TeV for a steepening Δp = 1 (respectively Δp = 0.5). The resulting γ-ray spectra are shown in Fig. 3.
One can compare the Bayesian information criterion BIC = −2log (L) + k × log (N), where k is the number of free parameters in the model, and N the number of observations, obtained for the two broken power-laws and the power-law with exponential cutoff discussed in Sect. 3.2. The three hypothesis provide equally good fits to the γ-ray data (ΔBIC< 2) and lead to γ-ray spectra consistent with the γ-ray parameters given in Sect. 3.1.
4. Conclusion
H.E.S.S. observations have led to the discovery of the distant, MC-interacting, SNR G349.7+0.2 in the VHE γ-ray domain. Although faint (F(E> 400 GeV) ~ 0.7% of the Crab Nebula), its flux corresponds to a luminosity of ~1034 erg s-1, owing to its location in the Far 3 kpc Arm of the Galactic centre, at ~11.5 kpc. The point-like shape of the VHE emission does not allow for an investigation of the morphology. Nonetheless, the combined Fermi-LAT and H.E.S.S. spectrum, together with several other observational lines of evidence, strongly suggest that the γ-ray emission results from the interaction between the SNR and the adjacent MC. By taking into account radio and X-ray data, the leptonically dominated scenarios for the origin of the γ-ray emission are strongly disfavored, and π0 decay from hadronic interactions requires a total energy content in CRs nHWp ~ 5 × 1051 (d/11.5 kpc)2 erg cm-3. Although the γ-ray spectrum and the inferred proton distributions are statistically compatible with a broken power-law and a power-law with exponential cutoff, the former shape is reminiscent of most of the γ-ray-emitting SNRs known to be interacting with MCs.
More information about the performance of the LAT can be found at the FSSC: http://fermi.gsfc.nasa.gov/ssc
Non-linear acceleration effects in CR modified shocks may even give rise to slightly concave spectra. An even more pronounced concave shape, steep at HE and hard at VHE γ-rays (Gabici et al. 2009) or a parabolic shape peaking at VHE (Ellison & Bykov 2011), may occur in the case of a MC illuminated by CRs escaping from a nearby SNR.
Acknowledgments
The support of the Namibian authorities and of the University of Namibia in facilitating the construction and operation of H.E.S.S. is gratefully acknowledged, as is the support by the German Ministry for Education and Research (BMBF), the Max Planck Society, the German Research Foundation (DFG), the French Ministry for Research, the CNRS-IN2P3 and the Astroparticle Interdisciplinary Programme of the CNRS, the U.K. Science and Technology Facilities Council (STFC), the IPNP of the Charles University, the Czech Science Foundation, the Polish Ministry of Science and Higher Education, the South African Department of Science and Technology and National Research Foundation, and by the University of Namibia. We appreciate the excellent work of the technical support staff in Berlin, Durham, Hamburg, Heidelberg, Palaiseau, Paris, Saclay, and in Namibia in the construction and operation of the equipment.
References
- Abdo, A. A., Ackermann, M., Ajello, M., et al. 2009, ApJ, 706, L1 [NASA ADS] [CrossRef] [Google Scholar]
- Abdo, A. A., Ackermann, M., Ajello, M., et al. 2010a, ApJ, 718, 348 [NASA ADS] [CrossRef] [Google Scholar]
- Abdo, A. A., Ackermann, M., Ajello, M., et al. 2010b, Science, 327, 1103 [NASA ADS] [CrossRef] [PubMed] [Google Scholar]
- Abdo, A. A., Ackermann, M., Ajello, M., et al. 2010c, ApJ, 722, 1303 [NASA ADS] [CrossRef] [Google Scholar]
- Acciari, V. A., Aliu, E., Arlen, T., et al. 2009, ApJ, 698, L133 [NASA ADS] [CrossRef] [Google Scholar]
- Ackermann, M., Ajello, M., Allafort, A., et al. 2013, Science, 339, 807 [NASA ADS] [CrossRef] [PubMed] [Google Scholar]
- Aharonian, F. A., & Atoyan, A. M. 1996, A&A, 309, 917 [NASA ADS] [Google Scholar]
- Aharonian, F., Akhperjanian, A. G., Bazer-Bachi, A. R., et al. 2006a, A&A, 457, 899 [NASA ADS] [CrossRef] [EDP Sciences] [Google Scholar]
- Aharonian, F., Akhperjanian, A. G., Bazer-Bachi, A. R., et al. 2006b, ApJ, 636, 777 [NASA ADS] [CrossRef] [Google Scholar]
- Aharonian, F., Akhperjanian, A. G., Bazer-Bachi, A. R., et al. 2007, A&A, 464, 235 [NASA ADS] [CrossRef] [EDP Sciences] [Google Scholar]
- Aharonian, F., Akhperjanian, A. G., Bazer-Bachi, A. R., et al. 2008, A&A, 481, 401 [NASA ADS] [CrossRef] [EDP Sciences] [MathSciNet] [PubMed] [Google Scholar]
- Aleksić, J., Alvarez, E. A., Antonelli, L. A., et al. 2012, A&A, 541, A13 [NASA ADS] [CrossRef] [EDP Sciences] [Google Scholar]
- Atwood, W. B., Abdo, A. A., Ackermann, M., et al. 2009, ApJ, 697, 1071 [NASA ADS] [CrossRef] [Google Scholar]
- Baade, W., & Zwicky, F. 1934, Proc. Nat. Acad. Sci., 20, 259 [Google Scholar]
- Baring, M. G., Ellison, D. C., Reynolds, S. P., Grenier, I. A., & Goret, P. 1999, ApJ, 513, 311 [NASA ADS] [CrossRef] [Google Scholar]
- Bell, A. R. 1978a, MNRAS, 182, 147 [NASA ADS] [CrossRef] [Google Scholar]
- Bell, A. R. 1978b, MNRAS, 182, 443 [NASA ADS] [CrossRef] [Google Scholar]
- Berge, D., Funk, S., & Hinton, J. 2007, A&A, 466, 1219 [NASA ADS] [CrossRef] [EDP Sciences] [Google Scholar]
- Blumenthal, G. R., & Gould, R. J. 1970, Rev. Mod. Phys., 42, 237 [NASA ADS] [CrossRef] [Google Scholar]
- Brun, F., de Naurois, M., Hofmann, W., et al. 2011 [arXiv:1104.5003] [Google Scholar]
- Carrigan, S., Brun, F., Chaves, R. C. G., et al. 2013 [arXiv:1307.4690] [Google Scholar]
- Castro, D., & Slane, P. 2010, ApJ, 717, 372 [NASA ADS] [CrossRef] [Google Scholar]
- Castro, D., Slane, P., Carlton, A., & Figueroa-Feliciano, E. 2013, ApJ, 774, 36 [NASA ADS] [CrossRef] [Google Scholar]
- Clark, D. H., & Caswell, J. L. 1976, MNRAS, 174, 267 [NASA ADS] [CrossRef] [Google Scholar]
- Dame, T. M., & Thaddeus, P. 2008, ApJ, 683, L143 [NASA ADS] [CrossRef] [Google Scholar]
- de Naurois, M., & Rolland, L. 2009, Astropart. Phys., 32, 231 [NASA ADS] [CrossRef] [Google Scholar]
- Dermer, C. D. 1986, A&A, 157, 223 [NASA ADS] [Google Scholar]
- Dubner, G., Giacani, E., Reynoso, E., & Parón, S. 2004, A&A, 426, 201 [NASA ADS] [CrossRef] [EDP Sciences] [Google Scholar]
- Ellison, D. C., & Bykov, A. M. 2011, ApJ, 731, 87 [NASA ADS] [CrossRef] [Google Scholar]
- Frail, D. A., Goss, W. M., Reynoso, E. M., et al. 1996, AJ, 111, 1651 [NASA ADS] [CrossRef] [Google Scholar]
- Gabici, S., Aharonian, F. A., & Casanova, S. 2009, MNRAS, 396, 1629 [NASA ADS] [CrossRef] [Google Scholar]
- Green, D. A. 2009, BASI, 37, 45 [NASA ADS] [Google Scholar]
- Hewitt, J. W., Rho, J., Andersen, M., & Reach, W. T. 2009, ApJ, 694, 1266 [NASA ADS] [CrossRef] [MathSciNet] [Google Scholar]
- Inoue, T., Yamazaki, R., & Inutsuka, S.-I. 2010, ApJ, 723, L108 [NASA ADS] [CrossRef] [Google Scholar]
- Jiang, B., Chen, Y., Wang, J., et al. 2010, ApJ, 712, 1147 [NASA ADS] [CrossRef] [Google Scholar]
- Kafexhiu, E., Aharonian, F., Taylor, A. M., & Vila, G. S. 2014 [arXiv:1406.7369] [Google Scholar]
- Katz, B., & Waxman, E. 2008, J. Cosmol. Astropart. Phys., 1, 18 [Google Scholar]
- Kelner, S. R., Aharonian, F. A., & Bugayov, V. V. 2006, Phys. Rev. D, 74, 4018 [Google Scholar]
- Lazendic, J. S., Slane, P. O., Hughes, J. P., Chen, Y., & Dame, T. M. 2005, ApJ, 618, 733 [NASA ADS] [CrossRef] [Google Scholar]
- Lazendic, J. S., Wardle, M., Whiteoak, J. B., Burton, M. G., & Green, A. J. 2010, MNRAS, 409, 371 [NASA ADS] [CrossRef] [Google Scholar]
- Lefa, E., Kelner, S. R., & Aharonian, F. A. 2012, ApJ, 753, 176 [NASA ADS] [CrossRef] [Google Scholar]
- Li, H., & Chen, Y. 2010, MNRAS, 409, L35 [NASA ADS] [CrossRef] [Google Scholar]
- Li, H., & Chen, Y. 2012, MNRAS, 421, 935 [NASA ADS] [CrossRef] [Google Scholar]
- Li, T.-P., & Ma, Y.-Q. 1983, ApJ, 272, 317 [NASA ADS] [CrossRef] [Google Scholar]
- Malkov, M. A., Diamond, P. H., & Sagdeev, R. Z. 2011, Nature Commun., 2, 194 [Google Scholar]
- Malkov, M. A., Diamond, P. H., & Sagdeev, R. Z. 2012, Phys. Plasmas, 19, 2901 [Google Scholar]
- McClure-Griffiths, N. M., Dickey, J. M., Gaensler, B. M., et al. 2012, ApJS, 199, 12 [NASA ADS] [CrossRef] [Google Scholar]
- Nolan, P. L., Abdo, A. A., Ackermann, M., et al. 2012, ApJS, 199, 31 [NASA ADS] [CrossRef] [Google Scholar]
- O’C Drury, L., Duffy, P., & Kirk, J. G. 1996, A&A, 309, 1002 [NASA ADS] [Google Scholar]
- Ohira, Y., Murase, K., & Yamazaki, R. 2010, A&A, 513, A17 [NASA ADS] [CrossRef] [EDP Sciences] [Google Scholar]
- Ohira, Y., Murase, K., & Yamazaki, R. 2011, MNRAS, 410, 1577 [NASA ADS] [Google Scholar]
- Ohm, S., van Eldik, C., & Egberts, K. 2009, Astropart. Phys., 31, 383 [NASA ADS] [CrossRef] [Google Scholar]
- Piron, F., Djannati-Atai, A., Punch, M., et al. 2001, A&A, 374, 895 [NASA ADS] [CrossRef] [EDP Sciences] [Google Scholar]
- Porter, T. A., Moskalenko, I. V., Strong, A. W., Orlando, E., & Bouchet, L. 2008, ApJ, 682, 400 [NASA ADS] [CrossRef] [Google Scholar]
- Ptuskin, V. S., & Zirakashvili, V. N. 2003, A&A, 403, 1 [NASA ADS] [CrossRef] [EDP Sciences] [Google Scholar]
- Ptuskin, V. S., & Zirakashvili, V. N. 2005, A&A, 429, 755 [NASA ADS] [CrossRef] [EDP Sciences] [MathSciNet] [PubMed] [Google Scholar]
- Reynoso, E. M., & Mangum, J. G. 2000, ApJ, 545, 874 [NASA ADS] [CrossRef] [Google Scholar]
- Rodriguez-Fernandez, N. J., & Combes, F. 2008, A&A, 489, 115 [NASA ADS] [CrossRef] [EDP Sciences] [Google Scholar]
- Rolke, W. A., López, A. M., & Conrad, J. 2005, Nucl. Instrum. Meth. Phys. Res. A, 551, 493 [Google Scholar]
- Sanchez, D. A., & Deil, C. 2013 [arXiv:1307.4534] [Google Scholar]
- Shaver, P. A., Salter, C. J., Patnaik, A. R., van Gorkom, J. H., & Hunt, G. C. 1985, Nature, 313, 113 [NASA ADS] [CrossRef] [Google Scholar]
- Slane, P., Chen, Y., Lazendic, J. S., & Hughes, J. P. 2002, ApJ, 580, 904 [NASA ADS] [CrossRef] [Google Scholar]
- Tang, Y. Y., Fang, J., & Zhang, L. 2011, ApJ, 739, 11 [NASA ADS] [CrossRef] [Google Scholar]
- Tian, W. W., & Leahy, D. A. 2014, ApJ, 783, L2 [NASA ADS] [CrossRef] [Google Scholar]
- Uchiyama, Y., Blandford, R. D., Funk, S., Tajima, H., & Tanaka, T. 2010, ApJ, 723, L122 [NASA ADS] [CrossRef] [Google Scholar]
- Yasumi, M., Nobukawa, M., Nakashima, S., et al. 2014, PASJ, 66, 689 [Google Scholar]
All Tables
All Figures
|
Fig. 1 H.E.S.S. γ-ray excess map of G349.7+0.2. The image is smoothed with a Gaussian with a width of 0.06° corresponding to the PSF of the analysis (shown in the bottom left inset). The color scale represents the excess counts per surface area of π(0.06°)2. Pixels within this area are correlated. The solid green and dashed white circles denote the G349.7+0.2 radio shell and the H.E.S.S. ON region, respectively. The upper right inset represents the Chandra image of G349.7+0.2 with the five OH (1720 MHz) masers (white crosses) delineating the associated MC as found by Dubner et al. (2004). The best fit position together with its 2σ CL contours of the TeV emission are marked with a magenta inverted triangle and magenta dashed contours, respectively. The Fermi-LAT best fit position and its 2σ CL contours are shown as a yellow triangle and a yellow dashed contour. The green circle denoting the G349.7+0.2 extent is reproduced in the inset for scaling. |
| In the text | |
|
Fig. 2 H.E.S.S. forward folded spectrum of G349.7+0.2. The blue line is the best fit of a power-law to the data as a function of the energy (unfolded from the H.E.S.S. response functions). The blue bowtie is the uncertainty of the fit given at 68% CL. Upper limits are given at 99% CL. |
| In the text | |
|
Fig. 3 γ-ray spectrum of G349.7+0.2. The H.E.S.S. (blue) and Fermi-LAT (green) spectra are shown with their 68% CL bowtie. For the Fermi-LAT spectral points the statistical errors are marked green while the statistical errors including the systematic errors are grey. The H.E.S.S. points are given with their statistical errors only. The π0-decay emission spectra obtained with the best fit proton distributions are shown as dotted and dashed lines for the broken power-law (BPL) distributions with steepening Δp = 0.5 and 1, respectively, and as a solid line for the power-law with exponential cutoff (PLC) distribution. |
| In the text | |
Current usage metrics show cumulative count of Article Views (full-text article views including HTML views, PDF and ePub downloads, according to the available data) and Abstracts Views on Vision4Press platform.
Data correspond to usage on the plateform after 2015. The current usage metrics is available 48-96 hours after online publication and is updated daily on week days.
Initial download of the metrics may take a while.