Fig. 3
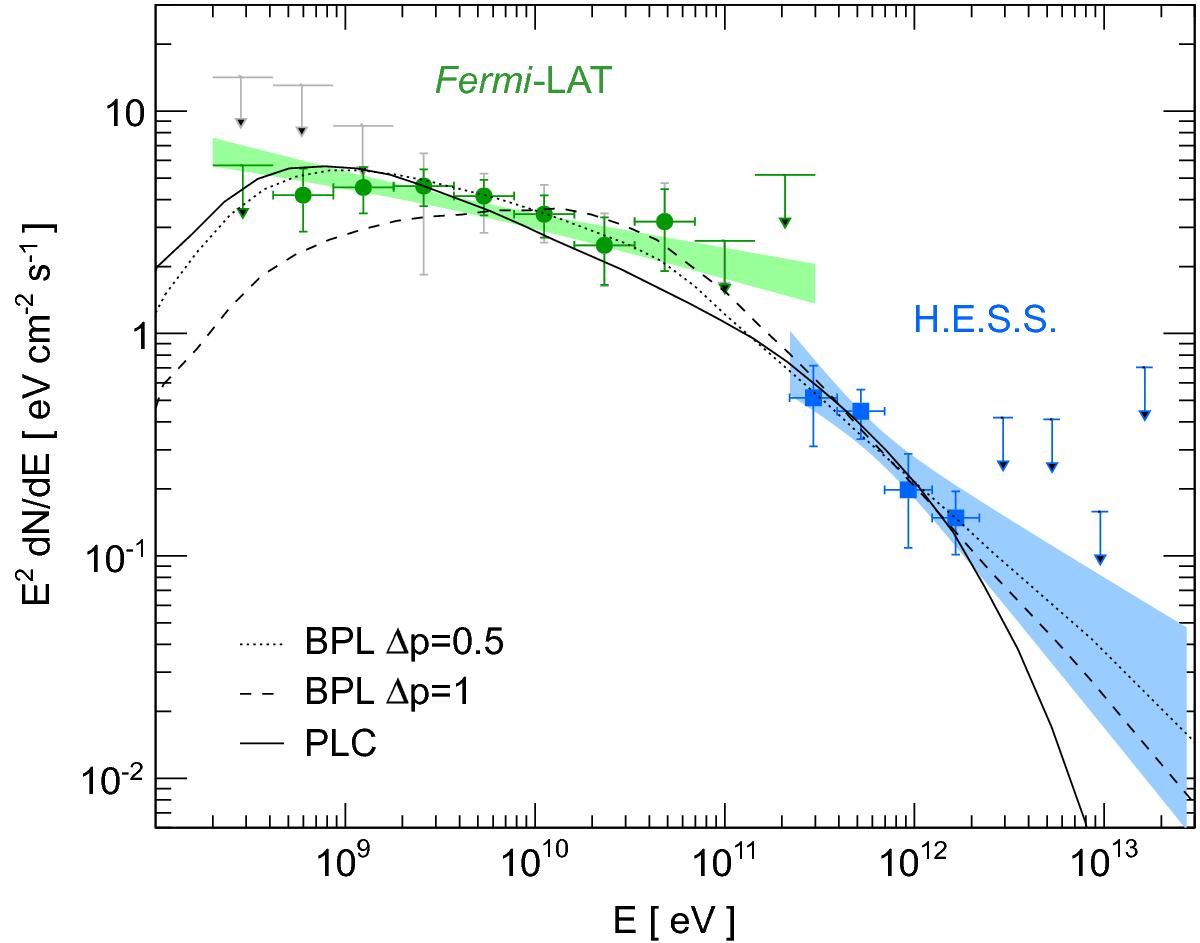
γ-ray spectrum of G349.7+0.2. The H.E.S.S. (blue) and Fermi-LAT (green) spectra are shown with their 68% CL bowtie. For the Fermi-LAT spectral points the statistical errors are marked green while the statistical errors including the systematic errors are grey. The H.E.S.S. points are given with their statistical errors only. The π0-decay emission spectra obtained with the best fit proton distributions are shown as dotted and dashed lines for the broken power-law (BPL) distributions with steepening Δp = 0.5 and 1, respectively, and as a solid line for the power-law with exponential cutoff (PLC) distribution.
Current usage metrics show cumulative count of Article Views (full-text article views including HTML views, PDF and ePub downloads, according to the available data) and Abstracts Views on Vision4Press platform.
Data correspond to usage on the plateform after 2015. The current usage metrics is available 48-96 hours after online publication and is updated daily on week days.
Initial download of the metrics may take a while.