Fig. 1
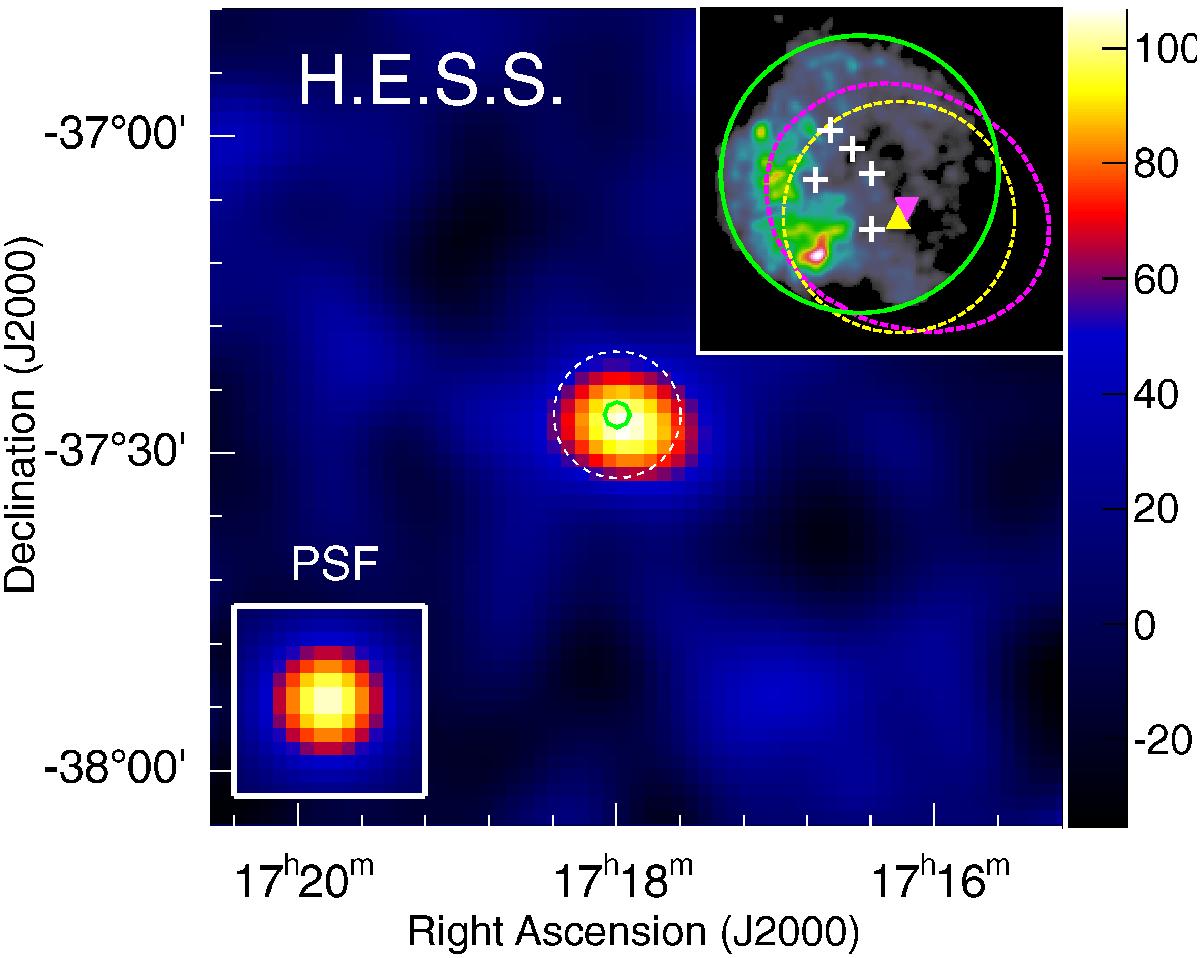
H.E.S.S. γ-ray excess map of G349.7+0.2. The image is smoothed with a Gaussian with a width of 0.06° corresponding to the PSF of the analysis (shown in the bottom left inset). The color scale represents the excess counts per surface area of π(0.06°)2. Pixels within this area are correlated. The solid green and dashed white circles denote the G349.7+0.2 radio shell and the H.E.S.S. ON region, respectively. The upper right inset represents the Chandra image of G349.7+0.2 with the five OH (1720 MHz) masers (white crosses) delineating the associated MC as found by Dubner et al. (2004). The best fit position together with its 2σ CL contours of the TeV emission are marked with a magenta inverted triangle and magenta dashed contours, respectively. The Fermi-LAT best fit position and its 2σ CL contours are shown as a yellow triangle and a yellow dashed contour. The green circle denoting the G349.7+0.2 extent is reproduced in the inset for scaling.
Current usage metrics show cumulative count of Article Views (full-text article views including HTML views, PDF and ePub downloads, according to the available data) and Abstracts Views on Vision4Press platform.
Data correspond to usage on the plateform after 2015. The current usage metrics is available 48-96 hours after online publication and is updated daily on week days.
Initial download of the metrics may take a while.