| Issue |
A&A
Volume 574, February 2015
|
|
|---|---|---|
| Article Number | A12 | |
| Number of page(s) | 11 | |
| Section | Stellar structure and evolution | |
| DOI | https://doi.org/10.1051/0004-6361/201424532 | |
| Published online | 16 January 2015 | |
Constraints on single-degenerate Chandrasekhar mass progenitors of Type Iax supernovae
1 Argelander-Institut für Astronomie, Universität Bonn, Auf dem Hügel 71, 53121 Bonn, Germany
e-mail: zwliu@ynao.ac.cn
2 Yunnan Observatories, Chinese Academy of Sciences, 650011 Kunming, PR China
3 Key Laboratory for the Structure and Evolution of Celestial Objects, Chinese Academy of Sciences, 650011 Kunming, PR China
Received: 4 July 2014
Accepted: 27 November 2014
Context. Type Iax supernovae (SNe Iax) are proposed as one new sub-class of SNe Ia since they present sufficiently distinct observational properties from the bulk of SNe Ia. Observationally, SNe Iax have been estimated to account for ~5%–30% of the total SN Ia rate, and most SNe Iax have been discovered in late-type galaxies. In addition, observations constrain the progenitor systems of some SN Iax progenitors that have ages of <80 Myr. Although the identity of the progenitors of SNe Iax is unclear, the weak deflagration explosions of Chandrasekhar-mass (Ch-mass) carbon/oxygen white dwarfs (C/O WDs) seem to provide a viable physical scenario.
Aims. Comparing theoretical predictions from binary population synthesis (BPS) calculations with observations of SNe Iax, we put constraints on the single-degenerate (SD) Ch-mass model as a possible SN Iax progenitor.
Methods. Based on the SD Ch-mass model, the SN rates and delay times are predicted by combining binary evolution calculations for the progenitor systems into a BPS model. Moreover, with current X-ray observations of SNe Iax, we constrain the pre-explosion mass-loss rates of stellar progenitor systems by using two analytic models.
Results. From our calculations, the long delay times of ≳3 Gyr and low SN rates of ~3 × 10⁻⁵ yr-1 are found in the red-gaint donor channel, indicating that this channel is unlikely to produce SNe Iax. With our standard models, we predict that the Galactic SN Iax rate from the main-sequence (helium-star) donor scenario is ~1.5 × 10⁻³ yr-1 (~3 × 10⁻⁴ yr-1). The total rate of these two models is consistent with the observed SN Iax rate. The short delay times in the helium-star donor channel (<100 Myr) support the young host environments of SNe Iax. However, the relatively long delay times in the main-sequence donor channel (~250 Myr–1 Gyr) are less favourable for the observational constraints on the ages of SN Iax progenitors. Finally, with current X-ray observations for SNe Iax, we set an upper limit on the pre-SN mass-loss rate at Ṁ ≲ a few × 10-4M⊙ yr-1 (for a wind velocity of vw = 100 km s-1).
Conclusions. The delay times in the SD Ch-mass model do not account for a significant number of SNe Iax being located in late-type, star-forming galaxies. However, at least one SN Iax event (SN 2008ge) is hosted by an S0 galaxy with no signs of star formation. Current X-ray observations for SNe Iax cannot rule out the SD Ch-mass model. Taking all these into account and considering the uncertainty of the observed rate for SN Iax events, we suggest that some SNe Iax may be produced from weak deflagrations of Ch-mass C/O WDs in SD progenitor systems, especially in the helium-star donor channel. This is consistent with recent analysis of HST observations, which suggests that the SN Iax SN2012Z had a progenitor system which contained a helium-star companion. However, this SD deflagration model is still unlikely to be the most common progenitor scenario for SNe Iax.
Key words: supernovae: general / binaries: close
© ESO, 2015
1. Introduction
Type Ia supernovae (SNe Ia) are thermonuclear explosion of carbon-oxygen white dwarfs (C/O WDs) in binary systems. However, the progenitor systems of SNe Ia have not yet been confidently identified and the physics of the explosion mechanism are still unclear (for reviews, see Hillebrandt & Niemeyer 2000; Wang & Han 2012; Maoz et al. 2014). The spectra of most SNe Ia are characterized by strong silicon absorption features as well as the absence of hydrogen (H) and helium (He) lines. In addition, most SNe Ia have strong lines from intermediate-mass elements (IMEs) in their near-maximum-light spectra (Filippenko 1997). Although the majority of observed SNe Ia (normal SNe Ia) display very similar photometric and spectroscopic features, a number of events have several observational characteristics that are significantly distinct from the others (Li et al. 2001, 2011; Foley et al. 2013).
Recently, a new subclass of SNe Ia (also known as Type Iax supernovae or SNe Iax, see Foley et al. 2013) has been proposed. The properties of SNe Iax are characterized by its prototypical member, SN 2002cx (Li et al. 2003). SNe Iax have spectral and photometric properties that are similar to those of SNe Ia. No evidence of hydrogen is shown in their spectra. The ejecta of SNe Iax is dominated by IMEs and iron-group elements, which also suggests a physical connection to normal SNe Ia (Foley et al. 2013). All SNe Iax show clear signs of C/O-burning in their maximum-light spectra as in normal SNe Ia, which supports the arguments that SNe Iax are from thermonuclear explosions of C/O WDs (Foley et al. 2013). Moreover, the presence of sulphur in the spectra of some SNe Iax was reported as evidence for thermonuclear burning in a C/O WD (Foley et al. 2010).
SNe Iax are distinguished from SNe Ia in the following ways. SNe Iax are significantly fainter than normal SNe Ia (Foley et al. 2013, 2014). They have a wide range of explosion energies (1049–1051 erg), ejecta masses (0.15–0.5 M⊙), and 56Ni masses (0.003–0.3 M⊙). The spectra of SNe Iax are characterized by lower expansion velocities (2000–8000 km s-1) than those of normal SNe Ia (~15 000 km s-1) at similar epochs. Their SN ejecta show strong mixing with both IMEs and iron-group elements in all layers (Jha et al. 2006; Phillips et al. 2007; Foley et al. 2013). This is in clear contrast to normal SNe Ia, which are characterized by strongly layered ejecta (Mazzali et al. 2007). Instead of entering a nebular phase dominated by broad forbidden lines of iron-peak elements, the late-time spectra of SNe Iax are dominated by narrow permitted Fe II (Jha et al. 2006). Moreover, two SNe Iax (SN 2004cs and SN 2007J) were identified with strong He lines in their spectra (Foley et al. 2009, 2013), indicating that there might be He in their progenitor systems. However, White et al. (2014) suggest that these two objects are likely to be core-collapse SNe rather than SNe Iax. In addition, the secondary maxima seen in normal SNe Ia have not been observed in SNe Iax.
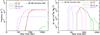 |
Fig. 1 Left: evolution of the Galactic SN rate of SNe Iax for a constant star formation rate (Z = 0.02, SFR = 5 M⊙ yr-1) in the WD+MS (dash-dotted curve), WD+He star (dotted curve), and WD+RG (thick solid curve) channel. Right: as for the left, but for the single starburst case. Results in the WD+MS channel with the effect of the accretion disk are shown with a thin solid line. For comparison, the results for the double-detonation model (i.e., the Sub-Ch model) from Wang et al. (2013) are also presented with dashed lines. |
It has been suggested that SNe Iax are the most common of all the types of peculiar SNe Ia (see Foley et al. 2013). From a volume-limited sample of the Lick Observatory Supernova Search, Li et al. (2011) find that a relative rate of SNe Iax is ~5 for every 100 SNe Ia. Recently, Foley et al. (2013) have estimated that in a given volume SNe Iax could contribute  of the total SN Ia rate. However, the more recent work of White et al. (2014) has reduced this relative rate to a much lower value of
  . Foley et al. (2013) used a heterogeneous SN dataset to estimate the rate. They adopted a correction factor of 2 on the relative SN rate to account for various observational biases. However, White et al. (2014) did not need to use such corrections because of the homogeneous nature of their survey and data analysis. This may be a reason for the difference in their rate estimation. A larger homogeneous sample obtained from future observations for SNe Iax may provide stronger constraints on the uncertainties of the SN Iax rate.
Most SNe Iax are observed in late-type, star-forming galaxies (Foley et al. 2013; Lyman et al. 2013; White et al. 2014). Lyman et al. (2013) found that the host population of SNe Iax is similar to that of type IIP SNe, so suggest that SNe Iax have a young delay time of 30–50 Myr. By studying a point source detected near the position of SN 2008ha, Foley et al. (2014) constrained the progenitor system of SN 2008ha to have an age of <80 Myr. Moreover, the progenitor system of one SN Iax, SN 2012Z, has recently been detected by McCully et al. (2014). It was further suggested that SN 2012Z is probably a thermonuclear explosion of a WD accreting matter from a massive He star (M ≈ 2.0 M⊙ at the time of explosion, see McCully et al. 2014). Together with He lines seen in two SN Iax spectra, all the above implies relatively short delay times for the progenitor systems (<500 Myr, see also Foley et al. 2014). However, there is at least one Iax event, SN 2008ge, which was observed in an S0 galaxy (Foley et al. 2010) with no signs of star formation (see Foley et al. 2013).
Several potential progenitor systems and explosion mechanisms have been proposed for SNe Iax (Branch et al. 2004; Jha et al. 2006; Phillips et al. 2007; Foley et al. 2009; Valenti et al. 2009; Moriya et al. 2010; Shen et al. 2010; Foley et al. 2012, 2013; Kromer et al. 2013; Stritzinger et al. 2014). In particular, Foley et al. (2013) suggest that a weak deflagration explosion of a C/O WD accreting material from a He-star companion may be a promising scenario for producing SNe Iax. Turbulent deflagrations in WDs can easily cause strong mixing of the SN ejecta (Röpke 2005). The small amount of kinetic energy released from deflagration explosions is in good agreement with the low expansion velocities of SNe Iax. Recently, the detailed hydrodynamics and radiative-transfer calculations for three-dimensional off-centre-ignited weak deflagrations of Ch-mass C/O WDs (also known as the “failed deflagration model”) have showed that such deflagration explosions are able to reproduce the characteristic observational features of SNe Iax well (Jordan et al. 2012; Kromer et al. 2013; Fink et al. 2014). In this specific explosion model, a weak deflagration explosion fails to explode the entire WD, and only a part of the Ch-mass WD is ejected with a much lower kinetic energy, leaving behind a polluted WD remnant that mainly consists of unburned C/O (Jordan et al. 2012; Kromer et al. 2013; Fink et al. 2014).
In this work, we further investigate the failed deflagration explosions of Ch-mass C/O WDs in H/He-accreting systems as progenitors of SNe Iax by means of binary populations synthesis (BPS) calculations. We compare the SN rates and delay times (times between star formation and SN explosion) from BPS calculations to the observations of SNe Iax. In the SD Ch-mass scenario, the circumstellar environment is expected to be enriched by pre-SN mass loss from non-conservative mass transfer or by the stellar wind from the donor star. After the SN explosion, X-ray emission is powered by the interaction between the SN blast wave and the circumstellar medium (CSM, see Chevalier & Fransson 2006; Immler et al. 2006). This X-ray emission can be used as a probe of the circumstellar environment and it enables us to put constraints on the pre-SN mass-loss rates of progenitor systems (Chevalier & Fransson 2006; Immler et al. 2006; Russell & Immler 2012; Margutti et al. 2012, 2014). We also use this X-ray diagnostics to constrain the SD Ch-mass scenario.
The theoretical SN rates and delay time distributions are predicted in Sect. 2. A parameter survey is also carried out there. In Sect. 3, we calculate the interaction between the SN blast wave and the CSM using simple analytic models. The discussion of the studied progenitor scenario is given in Sect. 4. Finally, we summarize our results and conclude in Sect. 5.
2. Populations synthesis calculations
BPS calculation has been widely used to study the evolution and properties of various progenitors of SNe Ia. Different SN progenitor scenarios involve different timescales that control the production rate of SN events, and will thus predict different SN age distributions. By comparing the theoretical Galactic birthrates and delay time distributions (DTDs) from the BPS predictions to those from observations, we can place strong constraints on the nature of SN progenitors.
2.1. Method
We investigate the SD Ch-mass explosion model, in which a C/O WD accretes material from a non-degenerate companion star. The companion star is potentially a main-sequence (MS), a slightly evolved star (WD+MS channel; Whelan & Iben 1973; Hachisu et al. 1999), a red-giant star (WD+RG channel; Hachisu et al. 1999), or a He star (WD+He star channel, seeWang et al. 2009). Detailed binary evolution calculations were performed using the stellar evolution code of Eggleton (1971). Roche-lobe overflow (RLOF) is treated by the prescription of Han et al. (2000). Additionally, the optically thick wind assumption of Hachisu et al. (1996, 1999) was used to describe the mass growth of a C/O WD by the accretion of H-rich material from the donor star. The prescription of Kato & Hachisu (2004) is implemented for the mass accumulation efficiency on to the WDs when He-shell flashes occur. When the mass of a C/O WD got close to the Ch-mass limit (~1.38 M⊙) by the accretion, we assumed that weak deflagrations are triggered and the C/O WD explodes as a SN Iax. Details of how the transferred material is accreted onto the WD are described in Appendix A.
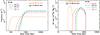 |
Fig. 2 As in Fig. 1, but only for the WD+MS (thick curves) and WD+He star (thin curves) channel with different values of αCEλ (=0.1, 0.3, 0.5, 1.5). Only αCEλ = 0.5, 1.5 are studied for the WD+He star model. |
With a series of binary evolution calculations for various close WD binary systems, we determined the initial parameter space leading to SNe Iax in the orbital period-secondary mass (i.e., log Pi– ) plane for various WD masses in the WD+MS, WD+RG, and WD+He star channel. Then, all these results were incorporated into the BPS (Hurley et al. 2000, 2002) calculations to obtain the SN Iax rates and their temporal evolution for the different SD Ch-mass explosion channels. In our BPS calculations, the initial mass function of Miller & Scalo (1979) is used. We assumed a circular binary orbit and set up a constant initial mass ratio distribution (i.e., n(q′) = constant, see Goldberg & Mazeh 1994; Bender & Simon 2008; Duchêne & Kraus 2013). We assumed that all stars are members of binaries, and the initial separation distribution used in Han et al. (1995) is adopted1. We simply assumed a constant star formation rate (SFR) of 5 M⊙ yr-1 or, alternatively, a delta function, i.e., a single starburst (see also Wang et al. 2010). The standard energy equations of Webbink (1984) were used to calculate the output of the CE phase. The CE ejection was determined with two highly uncertain parameters, αCE and λ. Here, αCE is the CE ejection efficiency, i.e. the fraction of the released orbital energy used to eject the CE; λ is a structure parameter that depends on the evolutionary stage of the donor star. In this work, the models with a metallicity of Z = 0.02 and a parameter of αCEλ = 0.5 are defined to be our standard models2. If a binary system evolves to a WD+MS, WD+RG, or WD+He star system and the system is located in the aforementioned orbital period-secondary mass plane for SNe Iax at the onset of RLOF, we then assume that a SN Iax occurs in the system. Details on the formation of WD+MS, WD+RG, and WD+He star progenitor systems are discussed in Appendix B. We refer to Han & Podsiadlowski (2004) and Wang et al. (2010) for detailed descriptions of our method.
2.2. Predicted rates and DTDs of our standard models
Figure 1 presents the SN Iax rates as a function of the delay times for the SD H-accreting scenario from our BPS calculations. The SN Iax rate in the WD+MS channel is ~1.5 × 10⁻³ yr-1 (~43% of the total SN Ia rate3), the SN Iax rate in the WD+RG channel is ~3 × 10⁻⁵ yr-1 (~1% of the total SN Ia rate). In addition, the SNe from the WD+MS channel have a range of delay times (~250 Myr–1 Gyr, see Fig. 1), while all SNe from the WD+RG channel are quite old (≳3 Gyr). Similarly, theoretical predictions in our standard model based on the WD+He star channel are also shown in Fig. 1. The SN Iax rate in this channel is ~3 × 10⁻⁴ yr-1 (~9% of the total SN Ia rate), and all WD+He star models only contribute to the SNe events with delay times shorter than 100 Myr.
2.2.1. Comparison with the observations
Compared with the observations, the SNe Iax from the WD+He star channel contribute about 9% of the total SN Ia rate. The delay times in the WD+He star scenario are consistent with the young host environments of SN Iax progenitors. The observed young environments of SNe Iax are less favourable for the delay times of the H-accreting SD channel, especially the WD+RG channel. Considering the very low SN rate (~1% of all SNe Ia) in the WD+RG channel, we therefore suggest that it is unlikely that SNe Iax are produced this way.
The SN rate from the WD+MS channel (~43% of the total SN Ia rate) agrees with the measured rate for SNe Iax ( of the total SN Ia rate) reported by Foley et al. (2012), but much higher than the estimated rate ( of the total SNe Ia rate) suggested by White et al. (2014). In addition, as mentioned above, the delay times of the WD+MS channel are difficult to reconcile with the observed young host environments of SNe Iax. However, some SNe Iax have been found in old environments (Foley et al. 2013). This indicates that some SNe Iax may indeed come from the WD+MS channel. Therefore, it is still hard to exclude the WD+MS channel as a possible scenario for some SNe Iax.
By considering the uncertainties on the percentage of SNe Iax, all the above results suggest that some SNe Iax may come from weak deflagration explosions of Ch-mass C/O WDs in H/He-accreting SD progenitor systems. However, it is still difficult to ascertain that this specific deflagration explosion model is the most common progenitor scenario for SNe Iax because the SN rates in the SD scenario are dominated by the WD+MS model4. Future observations are needed to provide a larger homogeneous sample, which would be helpful for understanding the progenitors and explosions of SNe Iax.
2.3. Parameter study
All the above results are shown with our standard model. However, the predicted rates may be sensitive to uncertainties in the binary evolution, such as common envelope (CE) evolution or metallicity5. The effect of theoretical uncertainties on the results are addressed in this section. Because it is unlikely that SNe Iax are produced from the WD+RG channel, we do not carry out the parameter study for this channel here.
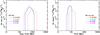 |
Fig. 3 Similar to the Fig. 1, but only for the WD+MS (left panel) and WD+He star (right panel) channel with different metallicities of Z = (0.0001, 0.004, 0.02, 0.03). |
2.3.1. Common envelope efficiency
The CE-phase plays an essential role in binary evolution in the formation of close binaries with compact objects (Ivanova et al. 2013). Unfortunately, despite the enormous efforts of the community, the phenomenon of the CE-phase is still not understood well (Ivanova et al. 2013). For reviews of CE evolution, see Webbink (2008) and Ivanova et al. (2013). After fitting the αCE-prescription to a population of observed post-CE binaries, the CE efficiency is estimated to be less than one (Zorotovic et al. 2010; De Marco et al. 2011; Davis et al. 2012). To investigate the dependence of the SN rates and DTDs on the uncertainty of the CE phase, we set the combined parameter αCEλ to be 0.1, 0.3, 0.5, 1.5 for the WD+MS channel, and set αCEλ to be 0.5, 1.5 for the WD+He star channel.
The SN rates and DTDs in the WD+MS channel with different values of αCEλ are compared in Fig. 2. Lower αCEλ values tend to produce some younger SNe, but the rates in all other cases are lower than for our standard case (αCEλ = 0.5). Here, we point out that the SN rate in the model with the lowest αCEλ value of 0.1 is consistent with the SN Iax rate (~5% of the total SN Ia rate) estimated by White et al. (2014), and this model can produce younger SNe compared to the standard model (see Fig. 2).
2.3.2. Metallicity
Figure 3 represents the effect of different metallicities (Z = 0.0001, 0.01, 0.02, 0.03) on the SN rate in a single starburst case. More SNe Iax with shorter delay times are produced as the metallicity increases. This means the SNe explosion occurs earlier in higher metallicity environments in both the WD+MS and WD+He star channels. However, no strong relation between SN rates and metallicity is found.
2.3.3. Unstable accretion disk
It has been suggested that the transferred material could form a disk surrounding the accreting C/O WD (Osaki 1996; van Paradijs 1996). This accretion disk model has been used to explain dwarf–nova outbursts (Osaki 1996). If the effective temperature in the disk falls below the H ionization temperature (~6500 K), the accretion disk may become thermally unstable (Osaki 1996; van Paradijs 1996). There is a corresponding critical mass-transfer rate of Ṁdisk6. The disk is assumed to be thermally stable (unstable) if the mass-transfer rate of the donor star, Ṁtr, is higher (lower) than Ṁdisk. To discuss the effect of the accretion disk, we set the accretion rate of the C/O WD to be Ṁ2 = | Ṁtr | /d, where d is the duty cycle. Here, we simply assume d = 1 (=0.01) if the accretion disk is stable (unstable) (see also Wang et al. 2010). Figure 1 shows that more SNe Iax with longer delay times are produced if the unstable accretion disk is taken into account, leading to increase of the SN rate.
2.3.4. Mass retention efficiency
In the SD scenario, only a fairly narrow range in the accretion rate above ~10-7M⊙ yr-1 will allow stable hydrogen-burning to be attained on the surface of the WD, avoiding a nova explosion. In this work, we adopt the prescription of Hachisu et al. (1999) to describe the mass accumulation efficiency of accreting WDs. However some recent works concentrated on H/He-burning on accreting WDs obtained different mass retention efficiencies (see, e.g., Shen & Bildsten 2007; Wolf et al. 2013; Piersanti et al. 2013; Kato et al. 2014; Piersanti et al. 2014).
Different mass accumulation efficiencies are usually used in different BPS codes, which may lead to disagreements about the theoretical predictions in the SD channel (e.g., see Yungelson & Livio 2000; Han & Podsiadlowski 2004; Ruiter et al. 2009; Wang et al. 2010; Mennekens et al. 2010; Bours et al. 2013). By studying the influences of three descriptions for the retention efficiencies of WDs on the SN rates and DTDs, Bours et al. (2013) find that the integrated SN rates can vary by a factor of 3–4 to even more than a factor of 100. Nelemans et al. (2013) have recently collected data from different BPS groups (includes data from our BPS calculations) and made a comparison. They find that one of the main differences in the results of the SD models is in fact from the mass-accretion efficiency of the WD (see Nelemans et al. 2013). In addition, the so-called PopCORN project (Toonen et al. 2014) made a comprehensive comparison of four BPS codes. These authors showed that differences between the predictions of BPS codes are not caused by numerical effects in the codes, but by different assumptions (such as the mass retention efficiency) in stellar or binary evolution (Toonen et al. 2014). Above all, the predicted SN rates could be different from the results presented in this work if different mass-retention efficiencies are adopted in BPS our calculations. Therefore, more detailed studies about H- and He-burning on accreting WDs are required to place strong constraints on the uncertainty of retention efficiency.
3. Interaction between SN ejecta and CSM
In the pre-SN accretion phase of the SD model, the donor’s stellar winds (symbiotic systems), mass loss associated with RLOF (non-conservative mass transfer), or optically thick winds from the WD are expected to enrich the CSM around the binary system. After the SN explosion, radio, X-ray, and Hα lines are expected to be emitted owing to the interaction between the fast-moving SN ejecta and the surrounding slow-moving CSM (e.g., Chevalier & Fransson 2006). Therefore, it has long been suggested that radio or X-ray detection of the blast wave interaction with the CSM can provide a way to put constraints on the mass-loss history of the companion star prior to the SN explosion and thus on its nature (see, e.g., Chevalier & Fransson 2006; Immler et al. 2006; Panagia et al. 2006; Russell & Immler 2012; Chomiuk et al. 2012; Horesh et al. 2012; Margutti et al. 2012, 2014; Pérez-Torres et al. 2014).
X-ray observation for SNe Iax.
Recently, with a sample of 53 SNe Ia (includes 7 SNe Iax listed in Table 1) observed by the Swift X-Ray Telescope (see Fig. 4), Russell & Immler (2012) calculated a 3σ upper limit for the X-ray luminosity of 1.7 × 1038 erg s-1 (Russell & Immler 2012), which corresponds to an upper limit on the mass-loss rate of 1.1 × 10⁻⁶M⊙ yr-1 × υwind/ (10 km s-1), where υwind is the wind velocity. However, they only made constraints for normal SNe Ia. Here, again, using the early X-ray (0.2–10 keV) observations for SNe Iax reported by Russell & Immler (2012), we attempt to examine the validity of the SD Ch-mass channel for SN Iax progenitors.
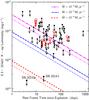 |
Fig. 4 X-ray observations for SNe Iax (red open circles) and other SNe Ia (black filled circles). Most of the data that was observed by the Swift Telescope is taken from Russell & Immler (2012). The X-ray emission of SN 2011fe and SN 2014J were observed using the Chandra X-ray observations (data obtained from Margutti et al. 2012, 2014). Theoretical predictions for different mass-loss rates Ṁ (for a wind velocity of vwind = 100 km s-1) are shown in different line types. The thin (thick) lines are calculated by assuming a shock velocity of 10 000 km s-1 (5000 km s-1). |
3.1. Thermal bremsstrahlung model
In the ejecta-CSM interaction model of Immler et al. (2006), X-ray emissions are ascribed to thermal bremsstrahlung. In this model, when assuming material is lost from the binary system prior to the SN with a constant mass-loss rate Ṁ and a wind velocity of υwind, the thermal X-ray luminosity of the forward shock region is L = 1 / (πm2)Λ(T)(Ṁ/υwind)2(υst)-1, where t is the time after outburst (see Table 1), m is the mean mass per particle which we take to be 1.8 × 10⁻²⁷ kg corresponding to a H+He plasma with solar composition, and υs is the forward shock velocity. Here, Λ(T) is the cooling function of the heated plasma (~3 × 10-23 erg cm3 s-1, which is assumed by Fransson et al. 1996; Immler et al. 2006). The profile of the outer ejecta is described by ρSN ∝ r− n, where n ranges from 7 to 10 (Kasen 2010). Moreover, a constant forward shock velocity and Lreverse ≈ 30 Lforward was assumed in the model of Immler et al. (2006). Here, we assume n = 10, as found for SNe arising from compact progenitors (see Matzner & McKee 1999; Kasen 2010). The shock velocity is set to be υs = (5000,10 000 km s-1), the observed maximum-light velocity of 2000 ≲ | υ | ≲ 8000 km s-1 in SNe Iax (Foley et al. 2013) provides a lower limit to the shock velocity of the interaction. We adopt a wind velocity of υwind = 100 km s-1. Then, the mass-loss rate of Ṁ is obtained based on X-ray observations of SNe Iax. Our results are shown in Table 1. A comparison between the theoretical prediction for thermal bremsstrahlung X-ray emissions and the observations are presented in Fig. 4, and a detailed discussion is given in Sect. 3.4.
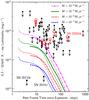 |
Fig. 5 Similar to Fig. 4, but for the IC X-ray luminosity expected in the case of wind-like CSM (LIC ∝ Lbol) (see Sect. 3.2). Different line types show the results for different mass-loss rates Ṁ (for a wind velocity of vwind = 100 km s-1). The thick lines are calculated by using the observed bolometric luminosity light curve (Lbol) of SN 2005hk (Phillips et al. 2007). The corresponding results (thin lines) from the “N5def model” of Kromer et al. (2013) are also shown for a comparison. |
3.2. Inverse Compton model
It has been also suggested that the X-ray emission from SNe is dominated by inverse Compton (IC) scattering of photospheric optical photons by relativistic electrons accelerated by the SN shock on a timescale of weeks to a month after the explosion (see Chevalier & Fransson 2006). The X-ray luminosity strongly depends on the structure of the SN ejecta (ρSN ∝ r− n), the density structure of the CSM and the relativistic electron distribution responsible for the up-scattering (Chevalier & Fransson 2006; Margutti et al. 2012). Assuming a wind-like CSM (ρCSM ∝ r-2) and an ISM-like CSM (ρCSM = constant), Margutti et al. (2012) developed two generalized formalisms to calculate the IC luminosity. Their formalisms are strongly sensitive to the SN bolometric luminosity, Lbol (see Appendix A of Margutti et al. 2012). Here, it is assumed electrons are accelerated according to a power-law distribution n(γ) ∝ γ− p with index p = 3, as suggested by the radio observations of SN shocks in Type Ib/Ic explosions (see Soderberg et al. 2006; Margutti et al. 2014). Then, an IC luminosity in the wind-like CSM case is (see Margutti et al. 2012, their Appendix A) 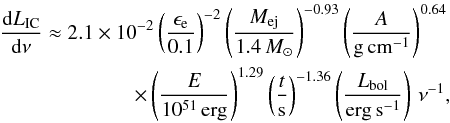 (1)where A = Ṁ/ (4πυwind), and ϵe is the fraction of thermal energy in the shock used for the electron acceleration (~0.1 see Chevalier & Fransson 2006). Theoretical IC X-ray luminosities with different mass-loss rates (for a wind velocity of 100 km s-1) are compared to the observations in Fig. 5. Here, both the observed bolometric light curve of SN 2005hk and the predicted bolometric light curve for the “N5def model” (see Fig. 8 of Kromer et al. 2013) are used as input for Lbol. The “N5def model” was shown to provide a good fit to the observations of the SN 2005hk event (Kromer et al. 2013). Moreover, E = 1.34 × 1050 erg, and Mej = 0.37 M⊙ (these parameters are consistent with the N5def model) are used in Eq. (1) to estimate the X-ray luminosities. Here, we note that SNe Iax have a range of luminosities, ejecta velocities, and inferred ejecta masses (Foley et al. 2013). Different bolometric luminosity light curves and ejecta masses of different SNe Iax may change the results shown in Fig. 5.
3.3. Theoretical pre-SN mass loss
In our calculations, an accreting C/O WD is assumed to blow an optically thick wind if Ṁ2>Ṁcr. This leads to a typical mass-loss rate that is less than 10-6M⊙ yr-1, but may be up to 10-4M⊙ yr-1 in extreme and rare cases (see also Han & Podsiadlowski 2006). The wind velocity is expected to be several 103 km s-1 (or a few 102 km s-1) if it comes from the neighbourhood of the WD (or comes from the circumbinary envelope). Figure 6 presents two typical examples of mass-loss history in our detailed binary evolution calculations for the WD+MS models. It shows the unprocessed material lost from the binary system in an optically thick wind with a mass-loss rate of Ṁwind = | Ṁ2 | − Ṁcr during the phase from “A” to “B”. The amount of mass lost during the optically thick wind phase as a function of the delay time is also displayed in Fig. 7. A large amount of mass loss from the system in the pre-SN phase can produce the inferred H-rich circumstellar environment.
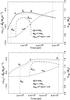 |
Fig. 6 Evolution of the mass-accretion rate of the WD (Ṁ2, solid curve), mass-loss rate in the optically thick wind phase (Ṁwind, dashed curve, i.e., the phase from “A” to “B”) and mass growth rate of the WD (ṀWD, dotted curve) as a function of time for the WD+MS channel (left-hand axis). The dot-dashed curve shows the evolution of the WD mass (right-hand axis). The vertical dashed curve again indicates the time of the explosion. The top panel gives an example where there is a delay between the production of the wind and the SN explosion, while the bottom panel corresponds to a model that is in the wind phase at the time of explosion. |
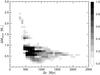 |
Fig. 7 Distributions of all the WD+MS models in the plane of (Δt, ΔMwind), where ΔMwind is the mass lost during the optically thick stellar wind phase of the WD binary, and Δt is the SN delay time. |
3.4. Observational constraints on mass-loss rates
Figures 4 and 5 show that theoretical predictions (see also Table 1) for the case of Ṁ/vwind ~ 10-4M⊙ yr-1/(100 km s-1) roughly match the upper-limit X-ray luminosities from the observations of SNe Iax. However, one should keep in mind that the observed X-ray luminosities of SNe Iax only provide an upper limit on the pre-SN mass-loss rate of SN Iax progenitors. As mentioned above, although the extreme and rare case with a high mass-loss rate of 10-4M⊙ yr-1 can occur in our calculations (see also Han & Podsiadlowski 2006), mass-loss rates of most SNe Iax progenitor systems in our models are less than 10-6M⊙ yr-1. Such mass-loss rates are much lower than the upper-limit ones obtained from the X-ray observations, thus suggesting that the SD H/He-accreting Ch-mass model cannot be excluded from the possible progenitors of SNe Iax by current X-ray observations.
Furthermore, only a small fraction of all models (for example, less than 10% of models in WD+MS channel) is still in the optically think wind phase at the time of the SN explosion in our BPS calculations. Most of our models have a delay between the production of the wind and the SN (~105–106 yr in WD+MS channel, see Fig. 6). This delay could produce a low-density CSM around the system when the SN explodes, thus leading to a non-detection (weak) of the X-ray emission at early times after the SN explosion. However, this case would create a large cavity surrounding the WD at the SN explosion and may leave a clear imprint on supernova remnants (SNRs, see Badenes et al. 2005, 2007).
Taking all this into consideration, we can safely suggest that the upper-limit constraints on the pre-SN mass-loss rates obtained from current early X-ray observations for SNe Iax do not exclude the studied SD Ch-mass channels as progenitors of SNe Iax. However, we note that the theoretical X-ray luminosities shown in Figs. 4 and 5 are obtained from analytic methods with some simple assumptions. To obtain strict constraints on the mass-loss rates of the progenitor models, detailed numerical hydrodynamical simulations for the interaction between the blast wave of SN and the CSM (e.g., Dimitriadis et al. 2014) are required, coupled with a suitable explosion model for SNe Iax (such as those of the failed deflagration model in Jordan et al. 2012; Kromer et al. 2013) and the detailed pre-SN mass-loss history (see Fig. 6).
In the binary evolution of the SD Ch-mass scenarios, it was also suggested that a small fraction of the transferred mass (≲1%) may be lost at the outer Lagrangian points of the binary system with a wind velocity of several 100 km s-1 (up to ~600 km s-1, see Deufel et al. 1999) when the WD undergoes steady nuclear burning (see also Chomiuk et al. 2012; Margutti et al. 2014). The expected mass-loss rates from this case are still below the upper-limit mass-loss constraints from X-ray observations for SNe Iax. This model thus also cannot be ruled out as a possible scenario for producing the progenitors of SNe Iax. Moreover, the accreting WD in a binary system can experience recurrent novae before it increases its mass to the Ch-mass to cause the SN explosion. Wood-Vasey & Sokoloski (2006) suggested that recurrent novae produce a low-density cavity in the immediate CSM, which may lead to a weak X-ray emission after the SN. It is also suggest that radio emission may be generated as the SN shockwave crashes through a previously ejected shell (Wood-Vasey & Sokoloski 2006).
4. Discussion
4.1. He lines
Two SNe Iax (SN 2004cs and 2007J) were found to show evidence for He in their progenitor system (Foley et al. 2013). In present work, we suggest that some SNe Iax are likely to occur in progenitor systems that consist of a He-star companion and a C/O WD (see also Foley et al. 2013). This scenario may explain He lines seen in SN Iax spectra.
Current failed deflagration models of SNe Iax are based on C/O Ch-mass WD (Jordan et al. 2012; Kromer et al. 2013; Fink et al. 2014). The weak deflagration explosion of a C/O WD that contains a thick He shell7 can probably explain the He lines seen in SN Iax spectra. We encourage numerical simulations for the weak deflagration explosions of Ch-mass WDs to explore this He-shell model further.
4.2. Detection of stripped H or He
In the SD Ch-mass model, the mass donors are H- or He-rich stars. After the SN explosion, the SN ejecta hits the companion and removes the material from its outer layers through the ablation (SN heating) and the stripping (momentum transfer) mechanisms (Liu et al. 2012; Pan et al. 2012).
Recent three-dimensional impact simulations for SN Iax showed that only a small amount (≲0.01 M⊙) of H-rich material is removed from the MS companion by the SN impact (Liu et al. 2013a). If the donor star is a He star, a lower He mass is expected to be removed by the SN impact (see Pan et al. 2010, 2012; Liu et al. 2013b) because the He star is much more compact than the MS companion. This indicates that the H or He lines are likely to be hidden in the late-time spectra of SNe Iax. A higher explosion energy would lead to a higher stripped H or He mass. Thus, more luminous SNe Iax seem more likely to show stripped H or He. However, whether or not H or He lines from matter stripped from the companion star is detectable can only be answered by performing sophisticated radiative-transfer simulations on the abundance structure of explosion models.
4.3. Post-explosion survivor
A weak deflagration of a C/O WD does not burn the entire WD, but leaves behind a ~1.0 M⊙ bound remnant (Jordan et al. 2012; Kromer et al. 2013; Fink et al. 2014). Unfortunately, this bound remnant cannot be spatially resolved until late times in hydrodynamical simulations due to the strong expansion of the SN ejecta. Therefore, whether the binary system could be destroyed after the SN explosion is still unclear (Liu et al. 2013a). If the bound remnant of the Ch-mass WD receives a high kick velocity from the explosion, a surviving WD and a companion star with a peculiar spatial velocity and peculiar abundances can be indicators of this studied progenitor scenario (Jordan et al. 2012; Kromer et al. 2013; Foley et al. 2014). Otherwise, the binary system would survive the SN explosion (Liu et al. 2013a). Further investigations are still required to strongly constrain the kick velocity of the bound remnant. However, fully resolving the detailed structure of the bound remnants is a prerequisite for this investigation (Fink et al. 2014).
4.4. X-ray emission from accreting WDs
If SNe Iax come from the SD Ch-mass scenario, the accreting WDs are expected to undergo a supersoft X-ray source (SSS) phase before the SN explosions when their masses are increasing (van den Heuvel et al. 1992; Iben & Tutukov 1994; Kahabka & Ergma 1997; Yoon & Langer 2003; Nomoto et al. 2007). Comparing the observed SSSs in galaxies of different morphological types with expectations from the SD Ch-mass model can provide constraints on the progenitors of SNe Iax (e.g., Di Stefano 2010a,b; Gilfanov & Bogdán 2010).
There are still large uncertainties, however, on the theoretical X-ray luminosity of the SSSs, such as the atmospheric models of accreting WDs and absorption of soft X-rays (Hachisu et al. 2010). Depending on the different mass-accretion rates, the accreting WDs would undergo novae, wind evolution, or SSS phases. It is shown that the SSS phase is only a short time, because most of the accreting WDs in the SD scenario spend a large portion of time in the optically thick wind phase and the recurrent nova phase (Hachisu et al. 2010).
4.5. Other possible models
It has recently been suggested that a WD that accretes material from a He-rich companion star is more likely to produce a double-detonation SNe Ia (i.e., double-detonation scenario (DDS), see Fink et al. 2007, 2010; Woosley & Kasen 2011; Sim et al. 2012; Moll & Woosley 2013). It was also suggested that SNe Iax may come from the DDS since the predicted rates and DTDs from the DDS (which are also shown in Figs. 1 and 2) are comparable with the observations (Wang et al. 2013). However, current simulations (Fink et al. 2010; Kromer et al. 2010; Sim et al. 2012; Woosley & Kasen 2011) for the DDS show that this explosion struggles to reproduce the characteristic features of SNe Iax. For example, the low ejecta velocity of SNe Iax, strong mixing of their explosion ejecta, and the full diversity of SNe Iax are hard to reproduce. However, the details of the DDS still require future developments and numerous complications remain to be solved in such a model.
Additionally, a so-called “.Ia” model was proposed to explain faint rapidly rising thermonuclear SNe (Bildsten et al. 2007; Shen et al. 2010). In this model, He is accreted onto the surface of a WD, leading to a single He layer detonation to cause an explosion of the WD. With this model, some observables of SNe Iax can be roughly matched such as the faint, fast-rising and declining features in SN 2008ha. However, this “.Ia” model primarily yields heavy α-chain elements and unburnt He, but it is difficult to produce intermediate-mass elements (Shen et al. 2010). Moreover, this model fails to reproduce the full diversity of SNe Iax (see Foley et al. 2009).
4.6. SN 2008ha-like events
Observationally, a very low 56Ni mass of ~0.003 M⊙ was derived for two SNe Iax, SN 2008ha and SN 2010ae (Foley et al. 2009; Stritzinger et al. 2014). This low 56Ni mass cannot be explained easily by current published models. Foley et al. (2009, 2010) suggest that SN 2008ha may be produced from the deflagration of a sub-Chandrasekhar-mass WD, and it was also proposed as the result of the core-collapse of a massive star (Valenti et al. 2009; Moriya et al. 2010). A minimum 56Ni mass from current simulations for the failed deflagration explosions is ~0.035 M⊙ (Fink et al. 2014), which is more than a factor of 10 greater than the observed value for SN 2008ha-like events. Very recently, Foley et al. (2014) have detected a source that coincident with the position of SN 2008ha with MF814W = −5.4 mag. They suggest that this source may be the stellar donor or the remnant predicted by the failed deflagration model (Jordan et al. 2012; Kromer et al. 2013; Fink et al. 2014). However, this still needs future observations for confirmation.
5. Summary and conclusions
Assuming weak deflagration explosions of C/O Ch-mass WDs in the H/He-accreting SD scenario can produce SNe Iax, we have compared predicted SN rates and delay times from BPS calculations to the observations of SNe Iax. Moreover, assuming the SNe Iax are a homogeneous class of objects, we calculated upper limits on the mass-loss rates from the progenitor systems. We tried to examine constraints on the H/He-accreting SD models as progenitors of SNe Iax. The main results are summarized as follows.
-
1.
The long delay times of ≳3 Gyr and low SN rates of ~3 × 10⁻⁵ yr-1 from the WD+RG channel indicate this scenario is unlikely to produce SNe Iax.
-
2.
The SNe Iax from the WD+He star channel contribute about ~9% of the total SN Ia rate. The DTDs in the WD+ He star channel (<100 Myr) allow for the observed SNe Iax to favour late-type galaxies.
-
3.
The SN rate (~43% of the total SN Ia rate) from the WD+ MS channel is comparable to the estimated rate (
of the total SNe Ia rate) of Foley et al. (2013), but it is much higher than the one ( of the total SNe Ia rate) supported by White et al. (2014). -
4.
Current observational constraints on the ages of progenitor systems (<80 Myr, see Lyman et al. 2013; Foley et al. 2014) are less favourable for the delay times in the WD+MS channel (~250 Myr–1 Gyr). However, at least one SN Iax event (SN 2008ge) is hosted by a S0 galaxy with no signs of star formation.
-
5.
The upper limits for the mass-loss rates of progenitor systems derived from X-ray observations for SNe Iax are Ṁ ≲ a few × 10-4M⊙ yr-1 (for wind velocity vw = 100 km s-1). Considering that the typical pre-SN mass-loss rates of H- or He-accreting SD models are ~10-6M⊙ yr-1, we conclude that current X-ray observations cannot rule out that the SD Ch-mass model offers possible progenitor scenarios for SNe Iax.
-
6.
We suggest that some SNe Iax may come from weak deflagration explosions of C/O WDs in the SD Ch-mass scenario, especially in the WD+He star channel. However, this SD Ch-mass channel is still too difficult to be the most common progenitor scenario for SNe Iax.
The problem of the progenitors of SNe Iax is still poorly constrained. No single published model is able to explain all the observational features and full diversity of SNe Iax. If SNe Iax are assumed to be generated from the same origin, a new progenitor paradigm may be needed. Otherwise, a combination of current models might be an alternative scenario for SNe Iax. Future observations providing a bigger sample of SNe Iax will be very helpful for constraining the rates of these events and their host-galaxy morphology distributions.
This distribution implies that the numbers of wide binary systems per logarithmic interval are equal and that about 50 percent of stellar systems have orbital periods less than 100 yr (Han et al. 1995). Recent studies indicate that this initial separation distribution is reasonable (Sana et al. 2012; Duchêne & Kraus 2013).
Our standard models adopt the model parameters used in Wang et al. (2009, 2010); however, the accretion disk of a WD is not included in our standard models due to its uncertainties.
We assume that the total SN Ia rate is 3.5 × 10⁻³ yr-1 based on the inferred Galactic SN Ia rate of 3–4 × 10⁻³ yr-1 (Cappellaro & Turatto 1997).
A recent study of the He-accreting WDs of Piersanti et al. (2014) suggests that the SN rate in WD+He star channel may be much lower than the results in this work.
For the effect of more theoretical uncertainties on the SN rates and DTDs, see Claeys et al. (2014).
We set Ṁdisk = 4.3 × 10⁻⁹(Porb/ 4h)1.7M⊙ yr-1 as in Wang et al. (2010), where Porb is the orbital period of the binary system.
Acknowledgments
We acknowledge the referee Carles Badenes for his valuable comments and suggestions that helped us to improve the paper. We thank Yan-Rong Gong for her helpful suggestions. We thank Markus Kromer for providing bolometric-luminosity data of SN 2005hk and their N5def model. This work is supported by the Alexander von Humboldt Foundation. R.J.S. is the recipient of a Sofja Kovalevskaja Award from the Alexander von Humboldt Foundation. T.J.M. is supported by Japan Society for the Promotion of Science Postdoctoral Fellowships for Research Abroad (26·51). B.W. acknowledges support from the 973 programme of China (No. 2014CB845700), the NSFC (Nos. 11322327, 11103072, 11033008, and 11390374), the Foundation of Yunnan province (No. 2013FB083).
References
- Badenes, C., Borkowski, K. J., & Bravo, E. 2005, ApJ, 624, 198 [NASA ADS] [CrossRef] [Google Scholar]
- Badenes, C., Hughes, J. P., Bravo, E., & Langer, N. 2007, ApJ, 662, 472 [NASA ADS] [CrossRef] [Google Scholar]
- Bender, C. F., & Simon, M. 2008, ApJ, 689, 416 [NASA ADS] [CrossRef] [Google Scholar]
- Bildsten, L., Shen, K. J., Weinberg, N. N., & Nelemans, G. 2007, ApJ, 662, L95 [NASA ADS] [CrossRef] [Google Scholar]
- Bours, M. C. P., Toonen, S., & Nelemans, G. 2013, A&A, 552, A24 [NASA ADS] [CrossRef] [EDP Sciences] [Google Scholar]
- Branch, D., Baron, E., Thomas, R. C., et al. 2004, PASP, 116, 903 [NASA ADS] [CrossRef] [Google Scholar]
- Cappellaro, E., & Turatto, M. 1997, in Thermonuclear Supernovae, eds. P. Ruiz-Lapuente, R. Canal, & J. Isern, NATO ASIC Proc., 486, 77 [Google Scholar]
- Chevalier, R. A., & Fransson, C. 2006, ApJ, 651, 381 [NASA ADS] [CrossRef] [Google Scholar]
- Chomiuk, L., Soderberg, A. M., Moe, M., et al. 2012, ApJ, 750, 164 [NASA ADS] [CrossRef] [Google Scholar]
- Claeys, J. S. W., Pols, O. R., Izzard, R. G., Vink, J., & Verbunt, F. W. M. 2014, A&A, 563, A83 [NASA ADS] [CrossRef] [EDP Sciences] [Google Scholar]
- Davis, P. J., Kolb, U., & Knigge, C. 2012, MNRAS, 419, 287 [NASA ADS] [CrossRef] [Google Scholar]
- De Marco, O., Passy, J.-C., Moe, M., et al. 2011, MNRAS, 411, 2277 [NASA ADS] [CrossRef] [Google Scholar]
- Deufel, B., Barwig, H., Šimić, D., Wolf, S., & Drory, N. 1999, A&A, 343, 455 [NASA ADS] [Google Scholar]
- Di Stefano, R. 2010a, ApJ, 712, 728 [NASA ADS] [CrossRef] [Google Scholar]
- Di Stefano, R. 2010b, ApJ, 719, 474 [NASA ADS] [CrossRef] [Google Scholar]
- Dimitriadis, G., Chiotellis, A., & Vink, J. 2014, MNRAS, 443, 1370 [NASA ADS] [CrossRef] [Google Scholar]
- Duchêne, G., & Kraus, A. 2013, ARA&A, 51, 269 [Google Scholar]
- Eggleton, P. P. 1971, MNRAS, 151, 351 [NASA ADS] [CrossRef] [Google Scholar]
- Filippenko, A. V. 1997, ARA&A, 35, 309 [NASA ADS] [CrossRef] [Google Scholar]
- Fink, M., Hillebrandt, W., & Röpke, F. K. 2007, A&A, 476, 1133 [NASA ADS] [CrossRef] [EDP Sciences] [Google Scholar]
- Fink, M., Röpke, F. K., Hillebrandt, W., et al. 2010, A&A, 514, A53 [NASA ADS] [CrossRef] [EDP Sciences] [Google Scholar]
- Fink, M., Kromer, M., Seitenzahl, I. R., et al. 2014, MNRAS, 438, 1762 [NASA ADS] [CrossRef] [Google Scholar]
- Foley, R. J., Chornock, R., Filippenko, A. V., et al. 2009, AJ, 138, 376 [NASA ADS] [CrossRef] [Google Scholar]
- Foley, R. J., Rest, A., Stritzinger, M., et al. 2010, AJ, 140, 1321 [NASA ADS] [CrossRef] [Google Scholar]
- Foley, R. J., Kromer, M., Howie Marion, G., et al. 2012, ApJ, 753, L5 [Google Scholar]
- Foley, R. J., Challis, P. J., Chornock, R., et al. 2013, ApJ, 767, 57 [NASA ADS] [CrossRef] [Google Scholar]
- Foley, R. J., McCully, C., Jha, S. W., et al. 2014, ApJ, 792, 29 [NASA ADS] [CrossRef] [Google Scholar]
- Fransson, C., Lundqvist, P., & Chevalier, R. A. 1996, ApJ, 461, 993 [NASA ADS] [CrossRef] [Google Scholar]
- Gilfanov, M., & Bogdán, Á. 2010, Nature, 463, 924 [NASA ADS] [CrossRef] [PubMed] [Google Scholar]
- Goldberg, D., & Mazeh, T. 1994, A&A, 282, 801 [NASA ADS] [Google Scholar]
- Hachisu, I., Kato, M., & Nomoto, K. 1996, ApJ, 470, L97 [NASA ADS] [CrossRef] [Google Scholar]
- Hachisu, I., Kato, M., Nomoto, K., & Umeda, H. 1999, ApJ, 519, 314 [NASA ADS] [CrossRef] [Google Scholar]
- Hachisu, I., Kato, M., & Nomoto, K. 2010, ApJ, 724, L212 [NASA ADS] [CrossRef] [Google Scholar]
- Han, Z., & Podsiadlowski, P. 2004, MNRAS, 350, 1301 [NASA ADS] [CrossRef] [Google Scholar]
- Han, Z., & Podsiadlowski, P. 2006, MNRAS, 368, 1095 [NASA ADS] [CrossRef] [Google Scholar]
- Han, Z., Podsiadlowski, P., & Eggleton, P. P. 1995, MNRAS, 272, 800 [NASA ADS] [Google Scholar]
- Han, Z., Tout, C. A., & Eggleton, P. P. 2000, MNRAS, 319, 215 [NASA ADS] [CrossRef] [Google Scholar]
- Hillebrandt, W., & Niemeyer, J. C. 2000, ARA&A, 38, 191 [NASA ADS] [CrossRef] [Google Scholar]
- Horesh, A., Kulkarni, S. R., Fox, D. B., et al. 2012, ApJ, 746, 21 [NASA ADS] [CrossRef] [Google Scholar]
- Hurley, J. R., Pols, O. R., & Tout, C. A. 2000, MNRAS, 315, 543 [NASA ADS] [CrossRef] [Google Scholar]
- Hurley, J. R., Tout, C. A., & Pols, O. R. 2002, MNRAS, 329, 897 [NASA ADS] [CrossRef] [Google Scholar]
- Iben, Jr., I., & Tutukov, A. V. 1994, ApJ, 431, 264 [NASA ADS] [CrossRef] [Google Scholar]
- Immler, S., Brown, P. J., Milne, P., et al. 2006, ApJ, 648, L119 [NASA ADS] [CrossRef] [Google Scholar]
- Ivanova, N., Justham, S., Chen, X., et al. 2013, A&ARv, 21, 59 [Google Scholar]
- Jha, S., Branch, D., Chornock, R., et al. 2006, AJ, 132, 189 [NASA ADS] [CrossRef] [Google Scholar]
- Jordan, IV, G. C., Perets, H. B., Fisher, R. T., & van Rossum, D. R. 2012, ApJ, 761, L23 [NASA ADS] [CrossRef] [Google Scholar]
- Kahabka, P., & Ergma, E. 1997, A&A, 318, 108 [NASA ADS] [Google Scholar]
- Kasen, D. 2010, ApJ, 708, 1025 [NASA ADS] [CrossRef] [Google Scholar]
- Kato, M., & Hachisu, I. 2004, ApJ, 613, L129 [NASA ADS] [CrossRef] [Google Scholar]
- Kato, M., Saio, H., Hachisu, I., & Nomoto, K. 2014, ApJ, 793, 136 [NASA ADS] [CrossRef] [Google Scholar]
- Kromer, M., Sim, S. A., Fink, M., et al. 2010, ApJ, 719, 1067 [NASA ADS] [CrossRef] [Google Scholar]
- Kromer, M., Fink, M., Stanishev, V., et al. 2013, MNRAS, 429, 2287 [NASA ADS] [CrossRef] [Google Scholar]
- Li, W., Filippenko, A. V., Treffers, R. R., et al. 2001, ApJ, 546, 734 [NASA ADS] [CrossRef] [Google Scholar]
- Li, W., Filippenko, A. V., Chornock, R., et al. 2003, PASP, 115, 453 [NASA ADS] [CrossRef] [Google Scholar]
- Li, W., Bloom, J. S., Podsiadlowski, P., et al. 2011, Nature, 480, 348 [NASA ADS] [CrossRef] [Google Scholar]
- Liu, Z. W., Pakmor, R., Röpke, F. K., et al. 2012, A&A, 548, A2 [NASA ADS] [CrossRef] [EDP Sciences] [Google Scholar]
- Liu, Z.-W., Kromer, M., Fink, M., et al. 2013a, ApJ, 778, 121 [NASA ADS] [CrossRef] [Google Scholar]
- Liu, Z.-W., Pakmor, R., Seitenzahl, I. R., et al. 2013b, ApJ, 774, 37 [NASA ADS] [CrossRef] [Google Scholar]
- Lyman, J. D., James, P. A., Perets, H. B., et al. 2013, MNRAS, 434, 527 [NASA ADS] [CrossRef] [Google Scholar]
- Maoz, D., Mannucci, F., & Nelemans, G. 2014, ARA&A, 52, 107 [NASA ADS] [CrossRef] [Google Scholar]
- Margutti, R., Soderberg, A. M., Chomiuk, L., et al. 2012, ApJ, 751, 134 [NASA ADS] [CrossRef] [Google Scholar]
- Margutti, R., Parrent, J., Kamble, A., et al. 2014, ApJ, 790, 52 [NASA ADS] [CrossRef] [Google Scholar]
- Matzner, C. D., & McKee, C. F. 1999, ApJ, 510, 379 [NASA ADS] [CrossRef] [Google Scholar]
- Mazzali, P. A., Röpke, F. K., Benetti, S., & Hillebrandt, W. 2007, Science, 315, 825 [NASA ADS] [CrossRef] [PubMed] [Google Scholar]
- McCully, C., Jha, S. W., Foley, R. J., et al. 2014, Nature, 512, 54 [NASA ADS] [CrossRef] [Google Scholar]
- Mennekens, N., Vanbeveren, D., De Greve, J. P., & De Donder, E. 2010, A&A, 515, A89 [NASA ADS] [CrossRef] [EDP Sciences] [Google Scholar]
- Miller, G. E., & Scalo, J. M. 1979, ApJS, 41, 513 [NASA ADS] [CrossRef] [Google Scholar]
- Moll, R., & Woosley, S. E. 2013, ApJ, 774, 137 [NASA ADS] [CrossRef] [Google Scholar]
- Moriya, T., Tominaga, N., Tanaka, M., et al. 2010, ApJ, 719, 1445 [NASA ADS] [CrossRef] [Google Scholar]
- Nelemans, G., Toonen, S., & Bours, M. 2013, in IAU Symp. 281, eds. R. Di Stefano, M. Orio, & M. Moe, 225 [Google Scholar]
- Nomoto, K., Saio, H., Kato, M., & Hachisu, I. 2007, ApJ, 663, 1269 [NASA ADS] [CrossRef] [Google Scholar]
- Osaki, Y. 1996, PASP, 108, 39 [NASA ADS] [CrossRef] [Google Scholar]
- Pan, K.-C., Ricker, P. M., & Taam, R. E. 2010, ApJ, 715, 78 [Google Scholar]
- Pan, K.-C., Ricker, P. M., & Taam, R. E. 2012, ApJ, 750, 151 [NASA ADS] [CrossRef] [Google Scholar]
- Panagia, N., Van Dyk, S. D., Weiler, K. W., et al. 2006, ApJ, 646, 369 [NASA ADS] [CrossRef] [Google Scholar]
- Pérez-Torres, M. A., Lundqvist, P., Beswick, R. J., et al. 2014, ApJ, 792, 38 [NASA ADS] [CrossRef] [Google Scholar]
- Phillips, M. M., Li, W., Frieman, J. A., et al. 2007, PASP, 119, 360 [NASA ADS] [CrossRef] [Google Scholar]
- Piersanti, L., Tornambé, A., Yungelson, L., & Straniero, O. 2013, in IAU Symp. 281, eds. R. Di Stefano, M. Orio, & M. Moe, 209 [Google Scholar]
- Piersanti, L., Tornambé, A., & Yungelson, L. R. 2014, MNRAS, 445, 3239 [NASA ADS] [CrossRef] [Google Scholar]
- Röpke, F. K. 2005, A&A, 432, 969 [NASA ADS] [CrossRef] [EDP Sciences] [Google Scholar]
- Ruiter, A. J., Belczynski, K., & Fryer, C. 2009, ApJ, 699, 2026 [NASA ADS] [CrossRef] [Google Scholar]
- Russell, B. R., & Immler, S. 2012, ApJ, 748, L29 [NASA ADS] [CrossRef] [Google Scholar]
- Sana, H., de Mink, S. E., de Koter, A., et al. 2012, Science, 337, 444 [Google Scholar]
- Shen, K. J., & Bildsten, L. 2007, ApJ, 660, 1444 [NASA ADS] [CrossRef] [Google Scholar]
- Shen, K. J., Kasen, D., Weinberg, N. N., Bildsten, L., & Scannapieco, E. 2010, ApJ, 715, 767 [NASA ADS] [CrossRef] [Google Scholar]
- Sim, S. A., Fink, M., Kromer, M., et al. 2012, MNRAS, 420, 3003 [NASA ADS] [CrossRef] [Google Scholar]
- Soderberg, A. M., Berger, E., Kasliwal, M., et al. 2006, ApJ, 650, 261 [NASA ADS] [CrossRef] [Google Scholar]
- Stritzinger, M. D., Hsiao, E., Valenti, S., et al. 2014, A&A, 561, A146 [NASA ADS] [CrossRef] [EDP Sciences] [Google Scholar]
- Toonen, S., Claeys, J. S. W., Mennekens, N., & Ruiter, A. J. 2014, A&A, 562, A14 [NASA ADS] [CrossRef] [EDP Sciences] [Google Scholar]
- Valenti, S., Pastorello, A., Cappellaro, E., et al. 2009, Nature, 459, 674 [NASA ADS] [CrossRef] [PubMed] [Google Scholar]
- van den Heuvel, E. P. J., Bhattacharya, D., Nomoto, K., & Rappaport, S. A. 1992, A&A, 262, 97 [NASA ADS] [Google Scholar]
- van Paradijs, J. 1996, ApJ, 464, L139 [NASA ADS] [CrossRef] [Google Scholar]
- Wang, B., & Han, Z. 2012, New Astron. Rev., 56, 122 [NASA ADS] [CrossRef] [Google Scholar]
- Wang, B., Chen, X., Meng, X., & Han, Z. 2009, ApJ, 701, 1540 [NASA ADS] [CrossRef] [Google Scholar]
- Wang, B., Li, X.-D., & Han, Z.-W. 2010, MNRAS, 401, 2729 [NASA ADS] [CrossRef] [Google Scholar]
- Wang, B., Justham, S., & Han, Z. 2013, A&A, 559, A94 [NASA ADS] [CrossRef] [EDP Sciences] [Google Scholar]
- Webbink, R. F. 1984, ApJ, 277, 355 [NASA ADS] [CrossRef] [Google Scholar]
- Webbink, R. F. 2008, in Astrophys. Space Sci. Lib. 352, eds. E. F. Milone, D. A. Leahy, & D. W. Hobill, 233 [Google Scholar]
- Whelan, J., & Iben, Jr., I. 1973, ApJ, 186, 1007 [NASA ADS] [CrossRef] [Google Scholar]
- White, C. J., Kasliwal, M. M., Nugent, P. E., et al. 2014, ApJ, submitted [arXiv:1405.7409] [Google Scholar]
- Wolf, W. M., Bildsten, L., Brooks, J., & Paxton, B. 2013, ApJ, 777, 136 [NASA ADS] [CrossRef] [Google Scholar]
- Wood-Vasey, W. M., & Sokoloski, J. L. 2006, ApJ, 645, L53 [NASA ADS] [CrossRef] [Google Scholar]
- Woosley, S. E., & Kasen, D. 2011, ApJ, 734, 38 [NASA ADS] [CrossRef] [Google Scholar]
- Woosley, S. E., Taam, R. E., & Weaver, T. A. 1986, ApJ, 301, 601 [NASA ADS] [CrossRef] [Google Scholar]
- Yoon, S.-C., & Langer, N. 2003, A&A, 412, L53 [NASA ADS] [CrossRef] [EDP Sciences] [Google Scholar]
- Yungelson, L. R., & Livio, M. 2000, ApJ, 528, 108 [CrossRef] [Google Scholar]
- Zorotovic, M., Schreiber, M. R., Gänsicke, B. T., & Nebot Gómez-Morán, A. 2010, A&A, 520, A86 [NASA ADS] [CrossRef] [EDP Sciences] [Google Scholar]
Appendix A: Accretion efficiencies of WDs
In our detailed binary evolution calculations, an optically thick-wind assumption of Hachisu et al. (1996, 1999) is used to describe the mass growth of a C/O WD by accretion of H-rich material from the donor star, and the prescription of Kato & Hachisu (2004) is inserted into the code for the mass accumulation efficiency of the He-shell flashes on to the WDs.
Appendix A.1: The H-rich donor channel
For H-rich companion star (MS, sub-giant, and RG), the mass growth rate of the C/O WD is set to be ṀWD = ηHeṀHe = ηHeηHṀ2, where ṀHe is the mass-growth rate of the He layer under the H-shell burning. ηH is the mass-accumulation efficiency for hydrogen burning and is controlled by 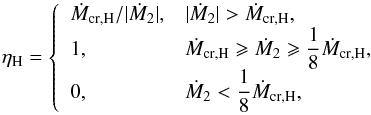 (A.1)where Ṁcr,H = 5.0 × 10⁻⁷(1.7 /X − 1)(MWD/M⊙ − 0.4) M⊙ yr-1 is the critical accretion rate for stable hydrogen burning, X is the H mass fraction, MWD the mass of the accreting WD, and Ṁ2 the mass-accretion rate of the WD. Also, ηHe is the mass-accumulation efficiency for He-shell flashes, and its value is taken from Kato & Hachisu (2004).
The optically thick wind (Hachisu et al. 1996) is assumed to blow off all unprocessed material if | Ṁ2 | is greater than Ṁcr,H, and the lost material is assumed to take away the specific orbital angular momentum of the accreting WD (the mass loss in the donor’s wind is supposed to be negligible, but its effect on the change in the orbital angular momentum, i.e. magnetic braking is included).
Appendix A.2: The He-rich donor channel
For He donor star model, the mass growth rate of the C/O WD ṀWD = ηHeṀ2. The ηHe is the mass-accumulation efficiency for He burning, which is set to be 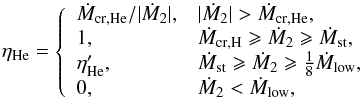 (A.2)where Ṁcr,He = 7.2 × 10⁻⁶ (MWD/M⊙ − 0.6) M⊙ yr-1 is the critical accretion rate for stable He burning; Ṁst is the minimum accretion rate for stable He-shell burning Kato & Hachisu (2004); Ṁlow = 4 × 10⁻⁸M⊙ yr-1 is the minimum accretion rate for weak He-shell flashes (Woosley et al. 1986);
  obtained from linearly interpolated from a grid computed by Kato & Hachisu (2004).
Appendix B: Evolutionary channels of progenitors
Appendix B.1: The WD+MS and WD+RG channels
According to evolutionary phase of the primordial primary at the beginning of the first RLOF, there are three channels that can form WD+MS systems, and one channel that can form WD+RG systems.
-
(1)
The primordial primary first fills its Roche lobe when it is in theHertzsprung gap (HG) or first giant branch (FGB) stage, and thebinary system goes through the CE-phase. After the CE ejection,the primary becomes a He star to form a He star+MS system. TheHe star continues to evolve and may fill its Roche lobe at its RGstage and transfer its remaining He-rich envelope onto the surfaceof the MS companion star, eventually leading to the formation of aC/O WD+MS system. For this channel, the initialmasses of the primary and the secondary at the zero agemain-sequence (ZAMS) are M1,i ~ 4.0–7.0 M⊙ and M2,i ~ 1.0–2.0 M⊙, the initial orbital period of the binary system is Pi ~ 5–30 days.
-
(2)
If the primordial primary fills its Roche lobe at the early asymptotic giant branch (EAGB) and the system goes through the CE phase, a close He RG+MS binary may then be produced after CE is ejected. The He RG further fills its Roch lobe and a C/O WD+MS system can be formed after the RLOF. For this scenario, M1,i ~ 2.5–6.5 M⊙, M2,i ~ 1.5–3.0 M⊙, and Pi ~ 200–900 days.
-
(3)
The primordial primary fills its Roche lobe at the thermal pulsing asymptotic giant branch (TPAGB) stage. A CE is formed owing to dynamically unstable RLOF. After the CE ejection, a C/O WD+MS system can be produced. The C/O WD+MS system continues to evolve, depending on different initial masses of binary components and initial binary separation, the MS companion can fill its Roche lobe in its MS phase (M1,i ~ 4.5–6.5 M⊙, M2,i ~ 1.5–3.5 M⊙, Pi> 1000 days) or when it evolves to the RG phase (i.e., forming the WD+RG system, M1,i ~ 5.0–6.5 M⊙, M2,i ~ 1.0–1.5 M⊙, Pi> 1500 days ), finally leading to SN explosion.
Appendix B.2: The WD+He star channel
Initial parameters of the binary system at ZAMS.
There are three evolutionary scenarios to form WD+He star systems. The typical phases that the binary system goes through are shown below. The typical masses of the primary and secondary at the ZAMS and initial orbital period of the binary list in Table B.1.
(1) MS+MS → Subgiant/FGB+MS  He star+MS → He RG+MS C/O WD+MS → C/O WD+Subgiant/FGB
  CE
CE  C/O WD+He star → SN event.
(2) MS+MS→ EAGB+MS  CE He RG+MS C/O WD+MS → C/O WD+Subgiant/FGB CE C/O WD+He star → SN event.
(3) MS+MS→ TPAGB+He-core burning star CE C/O WD+He star → SN event.
All Tables
All Figures
|
Fig. 1 Left: evolution of the Galactic SN rate of SNe Iax for a constant star formation rate (Z = 0.02, SFR = 5 M⊙ yr-1) in the WD+MS (dash-dotted curve), WD+He star (dotted curve), and WD+RG (thick solid curve) channel. Right: as for the left, but for the single starburst case. Results in the WD+MS channel with the effect of the accretion disk are shown with a thin solid line. For comparison, the results for the double-detonation model (i.e., the Sub-Ch model) from Wang et al. (2013) are also presented with dashed lines. |
| In the text | |
|
Fig. 2 As in Fig. 1, but only for the WD+MS (thick curves) and WD+He star (thin curves) channel with different values of αCEλ (=0.1, 0.3, 0.5, 1.5). Only αCEλ = 0.5, 1.5 are studied for the WD+He star model. |
| In the text | |
|
Fig. 3 Similar to the Fig. 1, but only for the WD+MS (left panel) and WD+He star (right panel) channel with different metallicities of Z = (0.0001, 0.004, 0.02, 0.03). |
| In the text | |
|
Fig. 4 X-ray observations for SNe Iax (red open circles) and other SNe Ia (black filled circles). Most of the data that was observed by the Swift Telescope is taken from Russell & Immler (2012). The X-ray emission of SN 2011fe and SN 2014J were observed using the Chandra X-ray observations (data obtained from Margutti et al. 2012, 2014). Theoretical predictions for different mass-loss rates Ṁ (for a wind velocity of vwind = 100 km s-1) are shown in different line types. The thin (thick) lines are calculated by assuming a shock velocity of 10 000 km s-1 (5000 km s-1). |
| In the text | |
|
Fig. 5 Similar to Fig. 4, but for the IC X-ray luminosity expected in the case of wind-like CSM (LIC ∝ Lbol) (see Sect. 3.2). Different line types show the results for different mass-loss rates Ṁ (for a wind velocity of vwind = 100 km s-1). The thick lines are calculated by using the observed bolometric luminosity light curve (Lbol) of SN 2005hk (Phillips et al. 2007). The corresponding results (thin lines) from the “N5def model” of Kromer et al. (2013) are also shown for a comparison. |
| In the text | |
|
Fig. 6 Evolution of the mass-accretion rate of the WD (Ṁ2, solid curve), mass-loss rate in the optically thick wind phase (Ṁwind, dashed curve, i.e., the phase from “A” to “B”) and mass growth rate of the WD (ṀWD, dotted curve) as a function of time for the WD+MS channel (left-hand axis). The dot-dashed curve shows the evolution of the WD mass (right-hand axis). The vertical dashed curve again indicates the time of the explosion. The top panel gives an example where there is a delay between the production of the wind and the SN explosion, while the bottom panel corresponds to a model that is in the wind phase at the time of explosion. |
| In the text | |
|
Fig. 7 Distributions of all the WD+MS models in the plane of (Δt, ΔMwind), where ΔMwind is the mass lost during the optically thick stellar wind phase of the WD binary, and Δt is the SN delay time. |
| In the text | |
Current usage metrics show cumulative count of Article Views (full-text article views including HTML views, PDF and ePub downloads, according to the available data) and Abstracts Views on Vision4Press platform.
Data correspond to usage on the plateform after 2015. The current usage metrics is available 48-96 hours after online publication and is updated daily on week days.
Initial download of the metrics may take a while.