Fig. 6
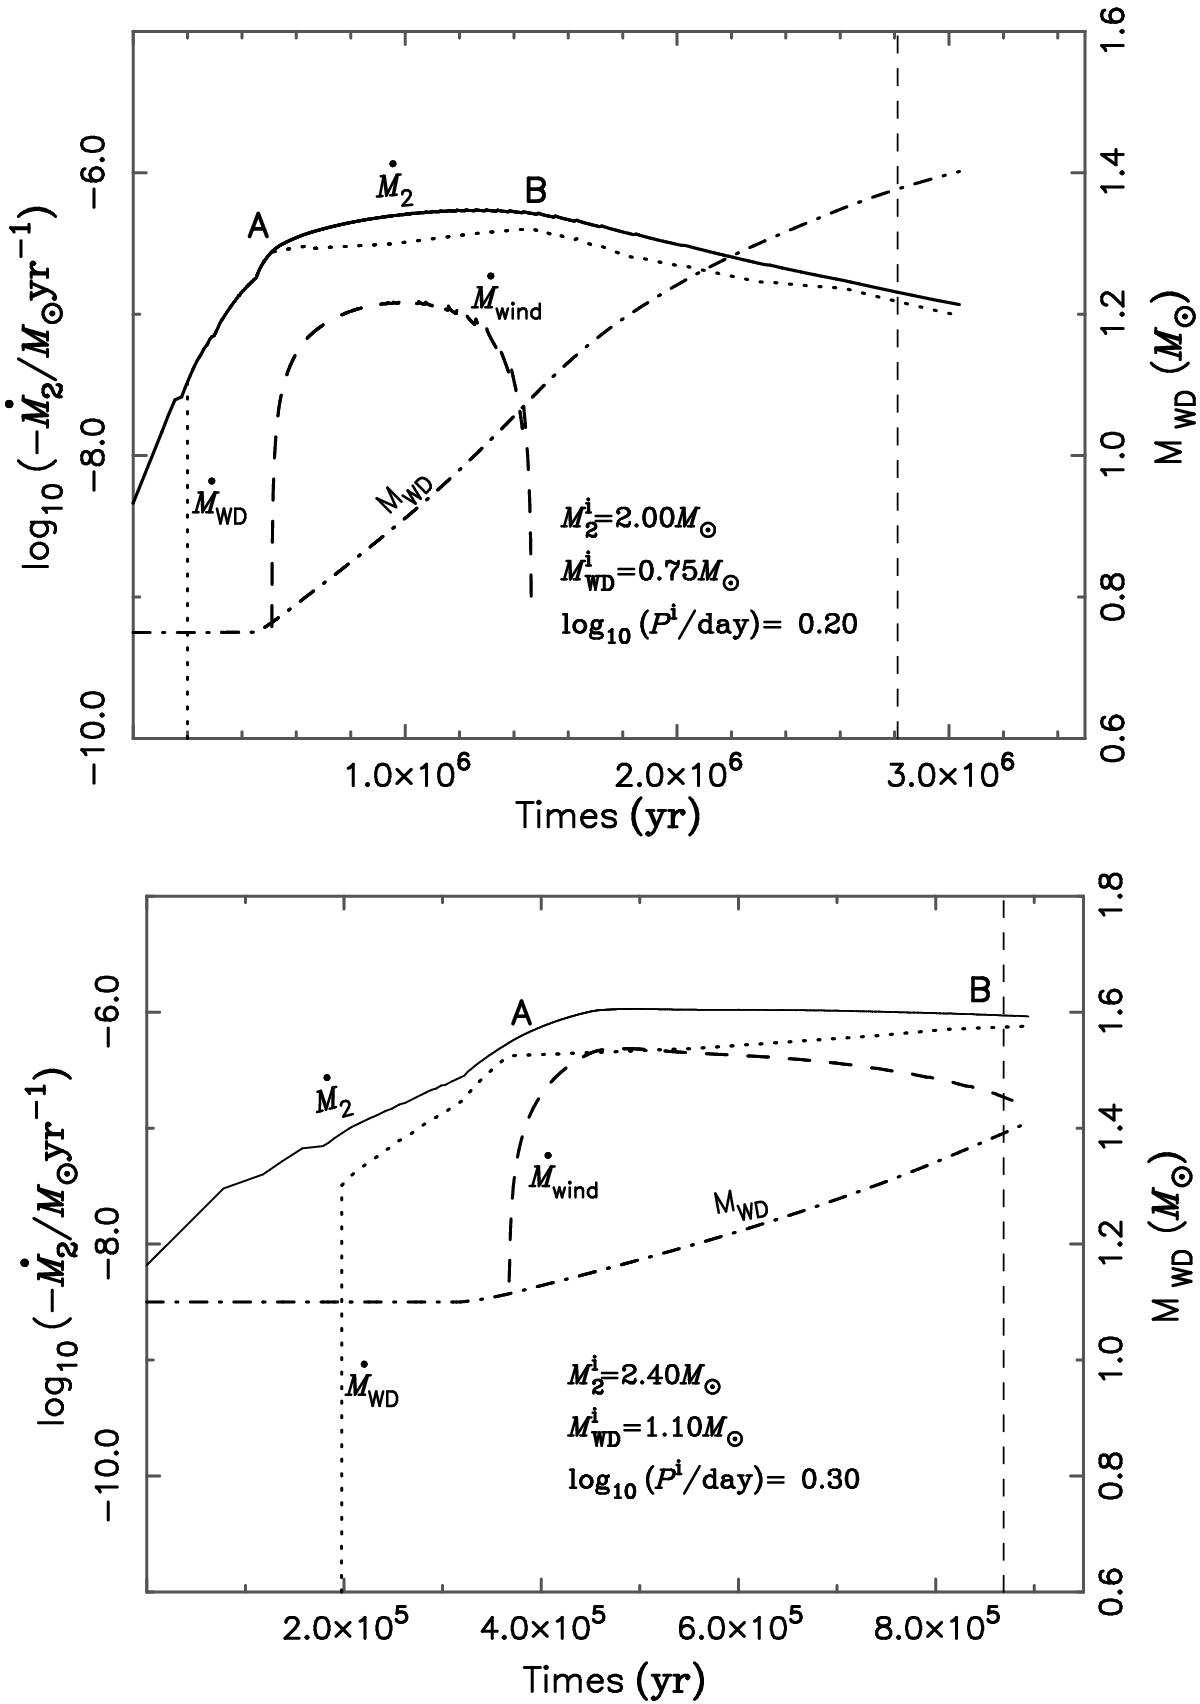
Evolution of the mass-accretion rate of the WD (Ṁ2, solid curve), mass-loss rate in the optically thick wind phase (Ṁwind, dashed curve, i.e., the phase from “A” to “B”) and mass growth rate of the WD (ṀWD, dotted curve) as a function of time for the WD+MS channel (left-hand axis). The dot-dashed curve shows the evolution of the WD mass (right-hand axis). The vertical dashed curve again indicates the time of the explosion. The top panel gives an example where there is a delay between the production of the wind and the SN explosion, while the bottom panel corresponds to a model that is in the wind phase at the time of explosion.
Current usage metrics show cumulative count of Article Views (full-text article views including HTML views, PDF and ePub downloads, according to the available data) and Abstracts Views on Vision4Press platform.
Data correspond to usage on the plateform after 2015. The current usage metrics is available 48-96 hours after online publication and is updated daily on week days.
Initial download of the metrics may take a while.