Fig. 5
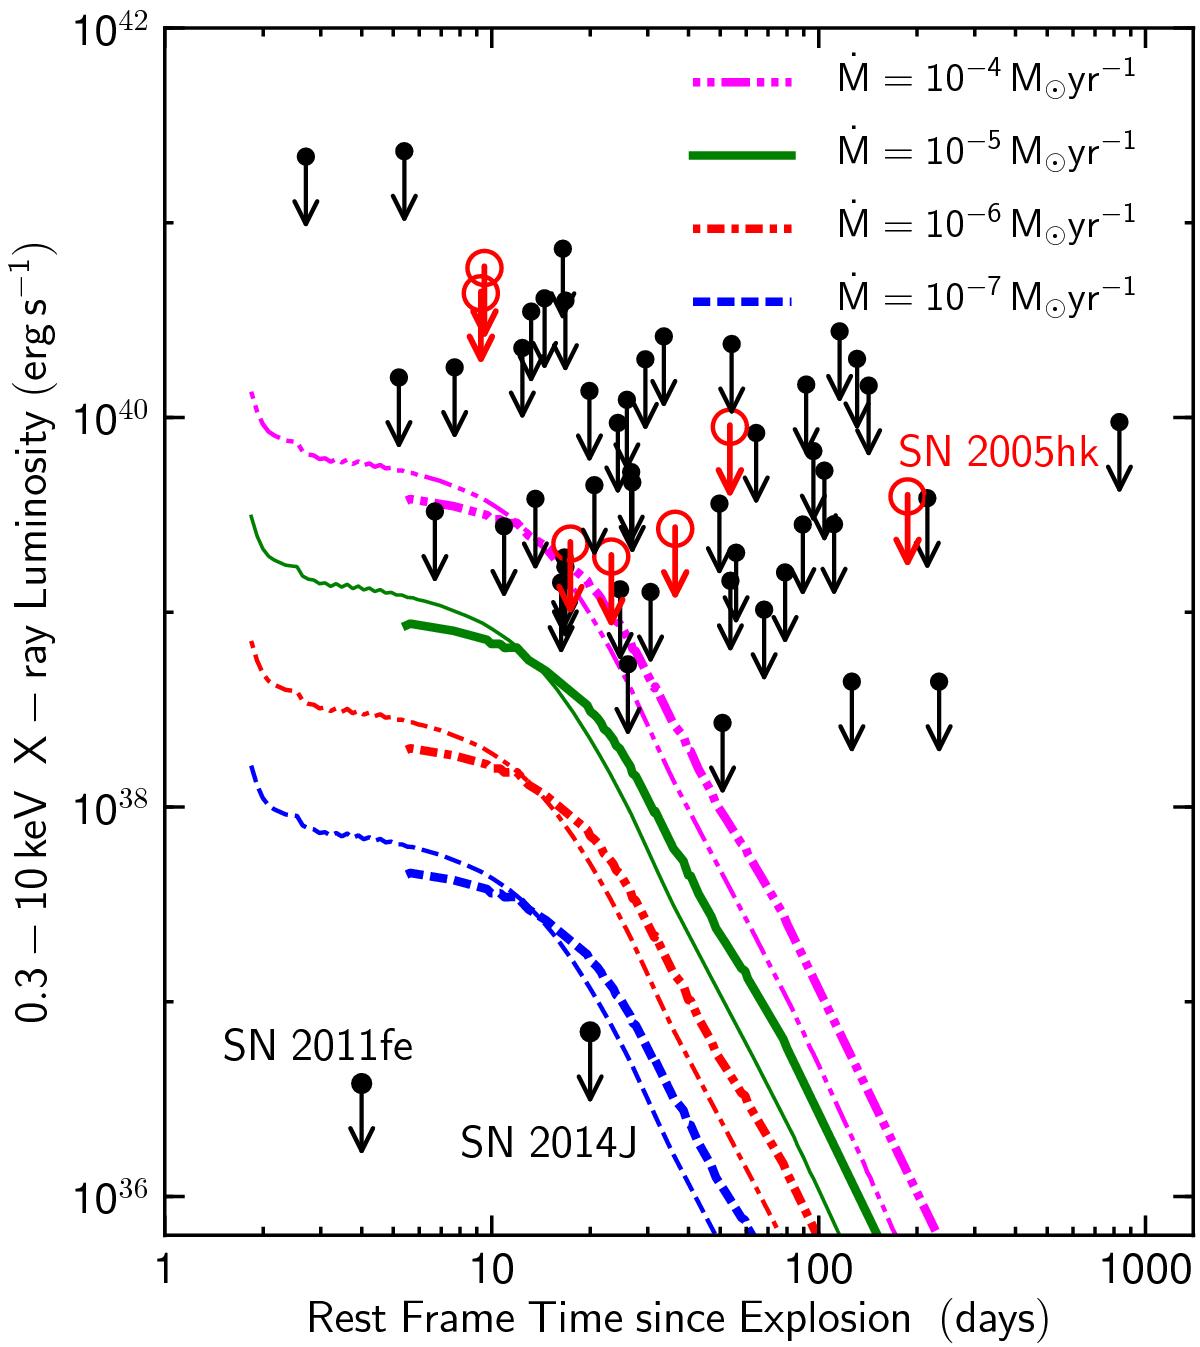
Similar to Fig. 4, but for the IC X-ray luminosity expected in the case of wind-like CSM (LIC ∝ Lbol) (see Sect. 3.2). Different line types show the results for different mass-loss rates Ṁ (for a wind velocity of vwind = 100 km s-1). The thick lines are calculated by using the observed bolometric luminosity light curve (Lbol) of SN 2005hk (Phillips et al. 2007). The corresponding results (thin lines) from the “N5def model” of Kromer et al. (2013) are also shown for a comparison.
Current usage metrics show cumulative count of Article Views (full-text article views including HTML views, PDF and ePub downloads, according to the available data) and Abstracts Views on Vision4Press platform.
Data correspond to usage on the plateform after 2015. The current usage metrics is available 48-96 hours after online publication and is updated daily on week days.
Initial download of the metrics may take a while.