Fig. 4
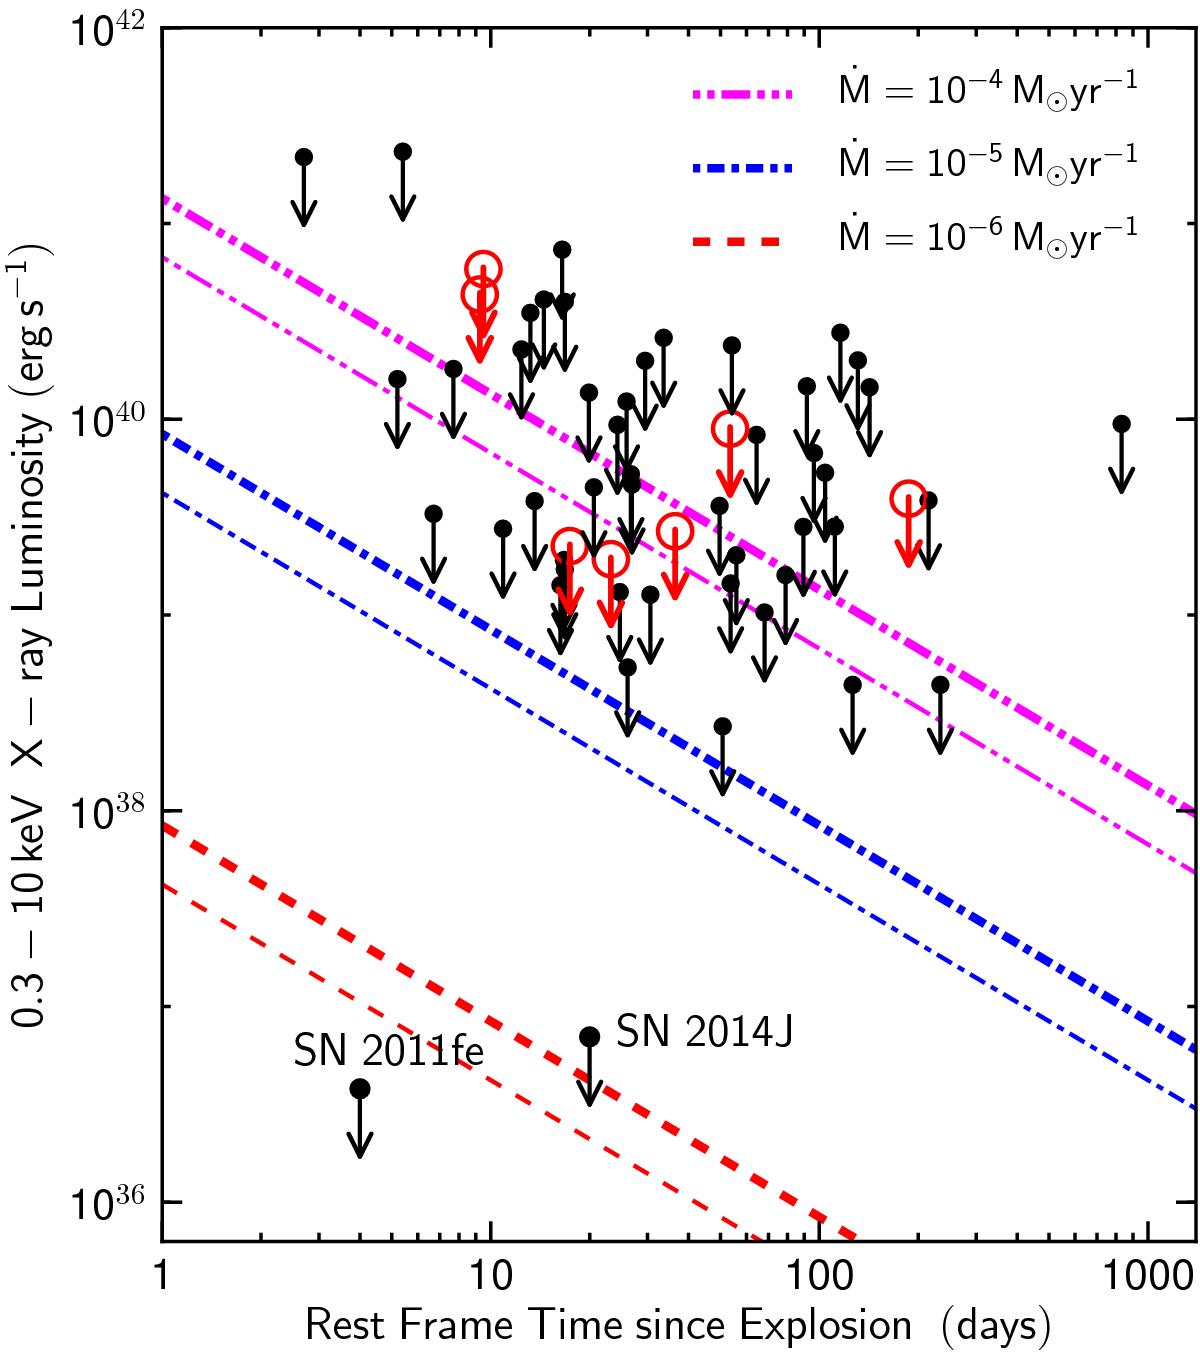
X-ray observations for SNe Iax (red open circles) and other SNe Ia (black filled circles). Most of the data that was observed by the Swift Telescope is taken from Russell & Immler (2012). The X-ray emission of SN 2011fe and SN 2014J were observed using the Chandra X-ray observations (data obtained from Margutti et al. 2012, 2014). Theoretical predictions for different mass-loss rates Ṁ (for a wind velocity of vwind = 100 km s-1) are shown in different line types. The thin (thick) lines are calculated by assuming a shock velocity of 10 000 km s-1 (5000 km s-1).
Current usage metrics show cumulative count of Article Views (full-text article views including HTML views, PDF and ePub downloads, according to the available data) and Abstracts Views on Vision4Press platform.
Data correspond to usage on the plateform after 2015. The current usage metrics is available 48-96 hours after online publication and is updated daily on week days.
Initial download of the metrics may take a while.