| Issue |
A&A
Volume 574, February 2015
|
|
|---|---|---|
| Article Number | A29 | |
| Number of page(s) | 6 | |
| Section | Stellar atmospheres | |
| DOI | https://doi.org/10.1051/0004-6361/201424199 | |
| Published online | 20 January 2015 | |
The prospective search for highly ionized technetium in hot (pre-) white dwarfs ⋆,⋆⋆
1
Institute for Astronomy and Astrophysics, Kepler Center for Astro and
Particle Physics, Eberhard Karls University,
Sand 1,
72076
Tübingen,
Germany
e-mail:
This email address is being protected from spambots. You need JavaScript enabled to view it.
2
Institute of Theoretical Physics and Astronomy, Vilnius
University, A. Goštauto
12, 01108
Vilnius,
Lithuania
3
NASA Goddard Space Flight Center, Greenbelt, MD
20771,
USA
Received: 13 May 2014
Accepted: 3 December 2014
Abstract
The discovery of technetium (Tc) in the atmospheres of red giants by Merrill (1952, ApJ, 116, 21) constituted convincing proof that s-process nucleosynthesis is indeed occurring in evolved stars. In principle, Tc should still be present in the atmospheres of hot post-AGB stars and (pre-) white dwarfs although, due to radioactive decay, it should be present in decreasing quantities along post-AGB evolution. The recent discovery of a large number of trans-iron group elements in hot white dwarfs with atomic numbers in the range A = 30–56 (Zn to Ba) raises the prospect that Tc (A = 43) may also be detected. However, this is currently not feasible because no atomic data exist for ionization stages beyond Tc ii. As an initial step, we calculated atomic energy levels and oscillator strengths of Tc iv–vi and used these data to compute non-local thermodynamic equilibrium (NLTE) model atmospheres to estimate at which minimum abundance level Tc could be detected. We show that Tc lines can be found in ultraviolet spectra of hot white dwarfs provided Tc is as abundant as other detected trans-Fe elements. We find that radiative levitation can keep Tc in large, easily detectable quantities in the atmosphere. A direct identification of Tc lines is still not feasible because wavelength positions cannot be computed with necessary precision. Laboratory measurements are necessary to overcome this problem. Our results suggest that such efforts are beneficial to the astrophysical community.
Key words: stars: abundances / stars: evolution / stars: AGB and post-AGB / white dwarfs / atomic data / line: identification
Based on observations with the NASA/ESA Hubble Space Telescope, obtained at the Space Telescope Science Institute, which is operated by the Association of Universities for Research in Astronomy, Inc., under NASA contract NAS5-26666.
Tables 1–6 are only available at the CDS via anonymous ftp to cdsarc.u-strasbg.fr (130.79.128.5) or via http://cdsarc.u-strasbg.fr/viz-bin/qcat?J/A+A/574/A29
© ESO, 2015
1. Introduction
Technetium (Tc) is astrophysically important because it is the lightest element with no stable isotopes. Its discovery in the atmospheres of red giants by Merrill (1952) proved that s-process nucleosynthesis occurs in evolved stars. The synthesized 99Tc has a half-life of 210 000 years1. A search for Tc in hot, further evolved stars, e.g. central stars of planetary nebulae or hot (pre-) white dwarfs was never attempted. One reason is the rather low abundance of Tc found in red giants, of the order log NTc = 1 on the usual log NH = 12 scale (Vanture et al. 1991), making it hard to detect in hot stars, combined with diminishing abundances along the post-AGB evolution because of radioactive decay. However, we recently discovered a large number of trans-iron group elements in the hot helium-rich white dwarf RE 0503−289, in strongly oversolar abundances (see Rauch et al. 2014a,b, and references therein). The overabundances are possibly the result of a late He-shell flash. The flash laid bare the helium-rich intershell layer that is enriched with s-process elements. In addition, the action of radiative acceleration can further enrich particular elements (Werner et al. 2012). It is therefore possible that Tc is present in the atmosphere of RE 0503−289 in quantities comparable to the other trans-Fe elements. It is our long-term objective to search for Tc in RE 0503−289 and related objects because its presence would be convincing proof that the high trans-Fe element abundances that were hitherto found only in DO white dwarfs are directly related to the occurrence of a late He-shell flash in preceding evolutionary stages.
However, the main obstacle for the identification of Tc in hot stars is the lack of atomic data for high ionization stages. Whereas Tc in red giants is detected by lines of Tc i in the optical spectra, we expect Tc iv–vi lines in the ultraviolet (UV) spectra of hot white dwarfs and central stars of planetary nebulae. Energy levels, line positions, and oscillator strengths for ions beyond Tc ii are not known, but these data are necessary for line identification and abundance determinations.
As a first step, we present here the results of a study that investigates under which circumstances Tc could be detected. We computed energy levels and oscillator strengths for Tc iv–vi and used these data to design model atoms that were subsequently employed to perform non-local thermodynamic equilibrium (NLTE) model atmosphere calculations. We predict the minimum abundance of Tc that is necessary for a positive detection of this element. We also perform diffusion calculations to see whether radiative levitation is able to keep Tc in sufficient quantities in the atmosphere of a white dwarf, preventing it from gravitational settling.
Our study is of exploratory nature because a direct search for Tc is still impossible. This is because the level energies and, hence, line positions cannot be computed with sufficient accuracy to perform unambiguous line identifications in observed spectra. Future laboratory measurements of Tc line positions are indispensable.
The paper is organized as follows. We begin with the presentation of our atomic-data calculations and design of model atoms for Tc (Sect. 2). Then we report on the model atmosphere calculations and the predicted Tc line spectra (Sect. 3). Results of diffusion calculations are presented in Sect. 4. We summarize our results and conclude in Sect. 5.
2. Atomic data and model atom for technetium
To our best knowledge, no experimental or theoretical studies of atomic energy levels and spectra of Tc ions beyond Tc ii have been published to date. We are considering here Tc iv–vi. For these ions only ground state and ionization energy are provided in the NIST Atomic Spectra Database2 (Kramida et al. 2012). A comprehensive study for a set of Tc ii transitions was performed in Palmeri et al. (2007) using three independent semiempirical approaches. In our study, because of the absence of experimental data for the higher Tc ions, as a first approach to future research, wave functions, energy levels as well as oscillator strengths and electric dipole transition probabilities were computed ab initio using the quasirelativistic Hartree-Fock (HFR) method of Cowan (1981). Only the strongest mixing configurations were included in wavefunction expansions.
We selected the configurations for the calculations in the following way. At first, we calculated the ionization limits for the ground states Tc iv 4d4 6S5/2, Tc v 4d3 4F3/2, and Tc vi 4d2 3F2 in the single configuration approximation. The obtained values coincide fairly well with those given by NIST (originally from Rodrigues et al. 2004) overestimating them by 3.5%, 0.5%, and 1.6%, respectively. Then, we generated the sets of even and odd configurations with excited one or two electrons from the 4s, 4p, and 4d shells up to 7l (l = s, p, d, f, g, h, i). From every set of odd and even configurations, the lowest 15 configurations with levels lying under or near the ionization limit were selected. We employed the method of average characteristics (Karazija & Kučas 2013) to estimate the configuration interaction (CI) strengths between selected configurations and all others in the generated sets. Additional configurations with the average weight exceeding 3% in the wave functions expansion were included into the selection, and finally the following complexes of interacting configurations composed:
-
4dN + 4dN−1nl (n = 5–7, l = s, d, g, i) + 4dN−2(5s2 + 5p2 + 5s5d + 5s6s) for the even parity;
-
4dN−14f + 4dN−1nl (n = 5–7, l = p, f, h) + 4dN−25s(5p+4f+6p+5f) + 4dN−25p(5d+6s) + 4dN−35s25p + 4p54dN+1 for the odd parity (fulfilling 3% criterion, the 4d5s5f configuration for Tc v was omitted, and the additional 4p54dN5s configurations for Tc v and Tc vi added);
where N = 4, 3, 2 correspond to Tc iv, Tc v, and Tc vi ions. The calculated CI strengths also revealed a certain number of configurations with the excited inner 4s and 4p shells, which admix to the levels of the selected configurations giving the average weight 0.1%–3% in the wave functions expansion. At this stage of investigation, the inclusion of more configurations was prevented by computer and Cowan code3 limits. Recalculations of the first ionization limits in the CI approximation using the above CI basis have not changed the consistency with the NIST data.
Results of energy levels calculations including leading percentages of wavefunctions in LS-coupling scheme and characteristics of electric dipole transitions between all levels are summarized in Tables 1, 3, and 5 (levels) and Tables 2, 4, and 6 (lines). Figures 1 and 2 display partial Grotrian diagrams of Tc v and Tc vi, respectively, in which only line transitions with the strongest gf values are mapped (g is the statistical weight of the lower level and f is the oscillator strength). Complete Grotrian diagrams of Tc iv–vi, including all computed levels and lines, are shown online4.
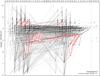 |
Fig. 1 Partial Grotrian diagram (from left to right: doublet, quartet, and sextet electron systems) of our Tc v model ion. Horizontal bars indicate 1932 atomic levels, lines represent radiative transitions (thin, gray: 2117 lines with log gf ≥ 0.1; thin, black: 220 lines with log gf ≥ 1.0; thick, red: 45 lines in the 1150 Å ≤ λ ≤ 1780 Å interval with log gf ≥ 0.1). The ten lines with the largest gf values (0.77 ≤ log gf ≤ 1.10, the two strongest are Tc vλλ 1440.505,1163.237 Å) are labeled with their wavelengths. |
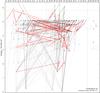 |
Fig. 2 Partial Grotrian diagram (from left to right: singlet, triplet, and quintet electron systems) of our Tc vi model ion. Horizontal bars indicate 555 atomic levels, lines represent radiative transitions (thin, gray: 549 lines with log gf ≥ 0.1; thin, black: 64 lines with log gf ≥ 1.0; thick, red: 52 lines in the 1150 Å ≤ λ ≤ 1780 Å interval with log gf ≥ 0.1). The ten lines with the largest gf values (0.46 ≤ log gf ≤ 1.08, the two strongest are Tc viλλ 1189.28,1269.116 Å), and Tc viλ 1473.702 Å are labeled with their wavelengths. |
Because of the large number of levels and lines, a superlevel and superline treatment of Tc in the NLTE model-atmosphere calculations is necessary. Therefore, we follow Rauch et al. (2014c) and used our IrOnIc code (Rauch & Deetjen 2003) to construct the Tc iv–vi model ions. The statistics of our resulting Tc model atom used for the model-atmosphere calculations is summarized in Table 7. The model atoms for all other species were presented by Rauch et al. (2014b,c).
Statistics of our Tc model atom.
3. Model atmospheres and synthetic technetium line spectra
NLTE model atmospheres and synthetic spectra were calculated with the Tübingen Model-Atmosphere Package (TMAP5, Werner et al. 2003). The model atmospheres are plane-parallel, chemically homogeneous, and in hydrostatic and radiative equilibrium. All model atoms considered in our calculations are taken from the Tübingen Model-Atom Database (TMAD6, Rauch & Deetjen 2003), which was constructed in the framework of the German Astrophysical Virtual Observatory (GAVO).
We conducted our investigation by computing model atmospheres for two representative hot white dwarfs, namely the hydrogen-rich (spectral type DA) G191−B2B (effective temperature Teff = 60 000 K, surface gravity log g = 7.6 [cm/s2]) and the already mentioned helium-rich (spectral type DO) RE 0503−289 (Teff = 70 000 K, log g = 7.6). Both white dwarfs were intensively studied concerning their content of trans-iron group elements (see Rauch et al. 2014b,c, and references therein; Fig. 3) and, hence, the respective model atmospheres were employed here and augmented by Tc. For G191−B2B, this model included 24 species, namely H, He, C, N, O, Al, Si, P, S, Fe, Ni, Zn, Ga, Ge, Tc, Sn, Ba, and a generic model atom that comprises Ca, Sc, Ti, V, Cr, Mn, and Co. These were represented by 83 ions, 1036 NLTE levels, and 4081 individual line transitions. We used 32 412 084 lines from Kurucz’s LIN line lists (theoretical and laboratory measured lines, Kurucz 1991, 2009, 2011) for the iron-group elements (Ca – Ni). For Zn, Ga, Ge, Tc, and Ba, we included 555 860 line transitions from Rauch et al. (2012, 2014a,b,c), and this work. For the RE 0503−289 model, 20 elements were considered (He, C, N, O, Fe, Ni, Zn, Ga, Ge, Kr, Tc, Xe, Ba, and Ca, Sc, Ti, V, Cr, Mn, and Co combined to a generic model atom), with 65 ions, 726 NLTE levels, 2985 individual line transitions, and 32 406 037 of Kurucz’s LIN lines. The Zn, Ga, Ge, Tc, and Ba model atoms are those from our G191−B2B calculations.
As roughly expected from the outset, the dominant ionization stages of Tc in the line-forming regions of the model atmospheres are Tc v–vi. Figure 4 shows the ionization fractions of Tc as a function of depth, measured by the column mass m. We find that the respective lines are detectable only in the UV wavelength range of the synthetic spectra below λ ≈ 1500 Å. We will show selected details of the computed spectra and compare them with observations performed with the Hubble Space Telescope Imaging Spectrograph (STIS). For details on the observations see Rauch et al. (2014a,c).
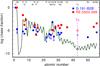 |
Fig. 3 Solar abundances (Asplund et al. 2009, thick lines; the dashed lines connect the elements with even and with odd atomic number) compared with the photospheric abundances in G191−B2B (blue circles) and RE 0503−289 (red squares). Arrows indicate upper limits. Open symbols for Tc mark the detection threshold for the two stars and the triangle is a typical Tc abundance found in red giants (see text). |
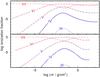 |
Fig. 4 Tc ionization fractions in our chemically homogeneous models for G191−B2B (top panel) and RE 0503−289 (bottom panel). |
To demonstrate the relative strengths of the strongest Tc lines in the λ> 912 Å region, which turn out to stem from Tc vi (Fig. 2), we compare the spectra of two models with different Tc mass fractions with the observed spectra of G191−B2B and RE 0503−289 in the vicinity of the strongest Tc vi lines (Fig. 5). By this measure, Tc lines can be identified in the model and discerned from those of other species. At the higher Tc abundance, strong Tc viλ 1473.702 Å and Tc viλ 1475.349 Å (wavelengths from Table 6, cf. Fig. 2) are prominent in the synthetic spectra of both stars. From them, we estimate that Tc should be detectable if its abundance exceeds 1.0 × 10⁻⁶ and 1.0 × 10⁻⁵ in G191−B2B and RE 0503−289, respectively. For RE 0503−289, this value is well below all other hitherto determined trans-Fe element abundances (Fig. 3). Note that other Tc vi lines with larger gf values exist, however, these lines are weaker in the spectra because the involved levels are highly excited and less populated. In light of this result and the following examination of radiative levitation of Tc, the detection of this species could well be possible.
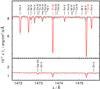 |
Fig. 5 Section of the STIS observations (gray) compared with synthetic spectra. Top: G191−B2B (blue, thin: Tc mass fraction 1.0 × 10⁻⁶, red, thick: 1.0 × 10⁻⁴). Bottom: RE 0503−289 (blue, thin: 1.0 × 10⁻⁵, red, thick: 1.0 × 10⁻⁴). The synthetic spectra are convolved with a Gaussian (FWHM = 0.01 Å and 0.06 Å for G191−B2B and RE 0503−289, respectively) to match the resolution of the observations. The strongest photospheric lines are identified. |
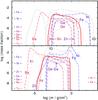 |
Fig. 6 Photospheric abundances of the most heavy elements in our stratified models for G191−B2B (top panel) and RE 0503−289 (bottom panel). IG denotes a generic atom (including Ca, Sc, Ti, V, Cr, Mn, and Co). The respective solar abundances are indicated on the left and right side of the panels. The value for Tc is a typical abundance measured in red giants (see text). |
4. Radiative levitation of technetium
The model atmospheres presented so far assumed chemical homogeneity. Since it may be expected that diffusion is important in RE 0503−289 and G191−B2B, we were interested to see whether Tc could be kept from gravitational settling by radiative levitation such that detectably large amounts remain in the photosphere. If this is the case, then the continued depletion of Tc by radioactive decay in the photosphere can be balanced by the replenishment of residual Tc atoms from subphotospheric layers. It is conceivable that by this mechanism, Tc could be detectable in hot white dwarfs even if their post-AGB age amounts to many half-lifes of Tc.
To this end, we used the New Generation Radiative Transport (NGRT) code (Dreizler & Wolff 1999; Schuh et al. 2002; Adamczak et al. 2012) to calculate self-consistent diffusion models with the same elements as our chemically homogeneous TMAP models. In essence, NGRT is an advanced version of our model-atmosphere code that allows us to compute chemically stratified models assuming the balance between gravitational settling and radiative levitation as forces acting on individual chemical species.
The model atoms were extended to their most detailed versions available from TMAD to compute opacities as completely as possible and to ensure that radiative acceleration is not underestimated. In total, we considered 30 ions, 1036 NLTE levels, and 4081 individual line transitions with 52 345 frequency points within 50 Å ≤ λ ≤ 3 × 10⁶ Å for G191−B2B, and 70 ions, 953 NLTE levels, and 4358 individual line transitions with 53 798 frequency points within the same wavelength interval for RE 0503−289. We considered Ca, Sc, Ti, V, Cr, Mn, and Co in a generic model atom with an average atomic weight of 349.7 as used in previously performed diffusion-model calculations for G191−B2B (Rauch et al. 2013).
The resulting depth-dependent abundances in our stratified models are shown in Fig. 6. It is obvious that if Tc is present at all, it would be one of the most abundant trans-iron elements in the line-forming regions (roughly −3 ≤ log m ≤ 0). Therefore, the predicted Tc abundance is significantly higher than the detection thresholds determined above.
5. Results and conclusions
The search for technetium in hot (pre-) white dwarfs is interesting because its presence and abundance determination could help to interpret the presence of large amounts of trans-iron elements recently found in some hot white dwarfs. The particular property of Tc as the lightest element with no stable isotope makes it an important tracer for the role of s-process nucleosynthesis for the metal abundance patterns. The practical problem that prevents the detection of Tc is the complete lack of atomic data for ionization stages beyond Tc ii. Ultimately, laboratory measurements of line spectra are necessary to determine accurate wavelengths of lines and to deduce energy levels. In order to justify the effort for these experiments, we computed atomic data that were subsequently used to perform model atmosphere and line-formation calculations to assess the chances to detect Tc. Although we cannot compare our results directly with observed spectra because of the insufficient accuracy of predicted line positions, we are able to show that the detection of Tc is possible in principle.
Our work reveals that sufficiently strong lines of Tc vi could be detected in the UV spectrum of the hot white dwarf RE 0503−289, provided the Tc abundance exceeds 1.0 × 10⁻⁵ (mass fraction). All other trans-Fe elements hitherto analyzed (Zn, Ga, Ge, Kr, Xe, Ba) are present at larger amounts (Fig. 3). According to stellar nucleosynthesis models (Gallino priv. comm., Karakas et al. 2007), 99Tc can be accumulated in the intershell region to amounts that almost reach the abundance of, e.g., Kr and Ge, which are species that exhibit very strong lines in the spectrum of RE 0503−289. According to stellar-evolution models of Althaus et al. (2009), Teff and log g of RE 0503−289 mean that the star has a mass of 0.51 M⊙ and left the AGB about 650 000 years ago. At that time, i.e., about three half-lives of 99Tc ago, Tc production ceased and the original abundance has decreased until today by an order of magnitude. In G191−B2B, Tc should be detectable if its abundance exceeds 1.0 × 10⁻⁶ (mass fraction).
While radioactive decay reduces the Tc abundance in the atmosphere, radiative levitation counteracts this effect. We have performed diffusion calculations and could show that gravitational settling of Tc is strongly outweighed by radiative levitation. We find that the Tc abundance in the line-forming regions is well above the detection threshold. It is higher than that of other trans-Fe elements and even competes with iron and nickel. One can therefore speculate that Tc might be detectable not only in the youngest, hottest white dwarfs, but even in further evolved objects because decayed Tc in the photosphere could be replenished by the lifting-up of remaining Tc from subphotospheric layers.
We conclude that future laboratory measurements of line spectra of highly ionized technetium are of utmost importance and are beneficial to the astrophysical community. Such experiments are critical for further progress. It is worthwhile to recall, that the famous detection of Tc i in red giants by Merrill (1952) would have not been possible without the arc and spark measurements performed by Meggers & Scribner (1950).
Los Alamos National Laboratory Periodic Table, http://periodic.lanl.gov
National Institute of Standards and Technology, http://www.nist.gov/pml/data/asd.cfm
Cowan’s code modification for IBM PC by Kramida; available online at http://das101.isan.troitsk.ru/COWAN
Acknowledgments
T.R. is supported by the German Aerospace Center (DLR, grant 05 OR 1402). The spectral energy distributions that were calculated for this analysis are available via the registered virtual-observatory (VO) service TheoSSA (Theoretical Stellar Spectra Access, http://dc.g-vo.org/theossa) that was developed within a German Astrophysical Virtual Observatory (GAVO, http://dc.g-vo.org) project at Tübingen. The GAVO project at Tübingen had been supported by the Federal Ministry of Education and Research (BMBF, grants 05 AC 6 VTB, 05 AC 11 VTB). This research has made use of the SIMBAD database, operated at CDS, Strasbourg, France. Some of the data presented in this paper were obtained from the Mikulski Archive for Space Telescopes (MAST). STScI is operated by the Association of Universities for Research in Astronomy, Inc., under NASA contract NAS5-26555. Support for MAST for non-HST data is provided by the NASA Office of Space Science via grant NNX09AF08G and by other grants and contracts.
References
- Adamczak, J., Werner, K., Rauch, T., et al. 2012, A&A, 546, A1 [NASA ADS] [CrossRef] [EDP Sciences] [Google Scholar]
- Althaus, L. G., Panei, J. A., Miller Bertolami, M. M., et al. 2009, ApJ, 704, 1605 [NASA ADS] [CrossRef] [Google Scholar]
- Asplund, M., Grevesse, N., Sauval, A. J., & Scott, P. 2009, ARA&A, 47, 481 [NASA ADS] [CrossRef] [Google Scholar]
- Cowan, R. D. 1981, The theory of atomic structure and spectra (Berkeley, CA: University of California Press) [Google Scholar]
- Dreizler, S., & Wolff, B. 1999, A&A, 348, 189 [NASA ADS] [Google Scholar]
- Karakas, A. I., Lugaro, M., & Gallino, R. 2007, ApJ, 656, L73 [NASA ADS] [CrossRef] [Google Scholar]
- Karazija, R., & Kučas, S. 2013, J. Quant. Spec. Radiat. Transf., 129, 131 [Google Scholar]
- Kramida, A., Ralchenko, Y., & Reader, J. 2012, in APS Division of Atomic, Mol. Opt. Phys. Meet. Abstr., D1004 [Google Scholar]
- Kurucz, R. L. 1991, in Stellar Atmospheres – Beyond Classical Models, eds. L. Crivellari, I. Hubeny, & D. G. Hummer, NATO ASIC Proc. 341, 441 [Google Scholar]
- Kurucz, R. L. 2009, in AIP Conf. Ser. 1171, eds. I. Hubeny, J. M. Stone, K. MacGregor, & K. Werner, 43 [Google Scholar]
- Kurucz, R. L. 2011, Canad. J. Phys., 89, 417 [NASA ADS] [CrossRef] [Google Scholar]
- Meggers, W. F., & Scribner, B. F. 1950, J. Res. Nat. Bureau of Standards, 45, 476 [CrossRef] [Google Scholar]
- Merrill, P. W. 1952, ApJ, 116, 21 [NASA ADS] [CrossRef] [Google Scholar]
- Palmeri, P., Quinet, P., Biémont, É., et al. 2007, MNRAS, 374, 63 [NASA ADS] [CrossRef] [Google Scholar]
- Rauch, T., & Deetjen, J. L. 2003, in Stellar Atmosphere Modeling, eds. I. Hubeny, D. Mihalas, & K. Werner, ASP Conf. Ser., 288, 103 [Google Scholar]
- Rauch, T., Werner, K., Biémont, É., Quinet, P., & Kruk, J. W. 2012, A&A, 546, A55 [NASA ADS] [CrossRef] [EDP Sciences] [Google Scholar]
- Rauch, T., Werner, K., Bohlin, R., & Kruk, J. W. 2013, A&A, 560, A106 [NASA ADS] [CrossRef] [EDP Sciences] [Google Scholar]
- Rauch, T., Werner, K., Quinet, P., & Kruk, J. W. 2014a, A&A, 564, A41 [NASA ADS] [CrossRef] [EDP Sciences] [Google Scholar]
- Rauch, T., Werner, K., Quinet, P., & Kruk, J. W. 2014b, A&A, 566, A10 [NASA ADS] [CrossRef] [EDP Sciences] [Google Scholar]
- Rauch, T., Werner, K., Quinet, P., & Kruk, J. W. 2014c, A&A, submitted [Google Scholar]
- Rodrigues, G. C., Indelicato, P., Santos, J. P., Patté, P., & Parente, F. 2004, Atomic Data and Nuclear Data Tables, 86, 117 [Google Scholar]
- Schuh, S. L., Dreizler, S., & Wolff, B. 2002, A&A, 382, 164 [NASA ADS] [CrossRef] [EDP Sciences] [Google Scholar]
- Vanture, A. D., Wallerstein, G., Brown, J. A., & Bazan, G. 1991, ApJ, 381, 278 [NASA ADS] [CrossRef] [Google Scholar]
- Werner, K., Deetjen, J. L., Dreizler, S., et al. 2003, in Stellar Atmosphere Modeling, eds. I. Hubeny, D. Mihalas, & K. Werner, ASP Conf. Ser., 288, 31 [Google Scholar]
- Werner, K., Rauch, T., Ringat, E., & Kruk, J. W. 2012, ApJ, 753, L7 [NASA ADS] [CrossRef] [Google Scholar]
All Tables
All Figures
|
Fig. 1 Partial Grotrian diagram (from left to right: doublet, quartet, and sextet electron systems) of our Tc v model ion. Horizontal bars indicate 1932 atomic levels, lines represent radiative transitions (thin, gray: 2117 lines with log gf ≥ 0.1; thin, black: 220 lines with log gf ≥ 1.0; thick, red: 45 lines in the 1150 Å ≤ λ ≤ 1780 Å interval with log gf ≥ 0.1). The ten lines with the largest gf values (0.77 ≤ log gf ≤ 1.10, the two strongest are Tc vλλ 1440.505,1163.237 Å) are labeled with their wavelengths. |
| In the text | |
|
Fig. 2 Partial Grotrian diagram (from left to right: singlet, triplet, and quintet electron systems) of our Tc vi model ion. Horizontal bars indicate 555 atomic levels, lines represent radiative transitions (thin, gray: 549 lines with log gf ≥ 0.1; thin, black: 64 lines with log gf ≥ 1.0; thick, red: 52 lines in the 1150 Å ≤ λ ≤ 1780 Å interval with log gf ≥ 0.1). The ten lines with the largest gf values (0.46 ≤ log gf ≤ 1.08, the two strongest are Tc viλλ 1189.28,1269.116 Å), and Tc viλ 1473.702 Å are labeled with their wavelengths. |
| In the text | |
|
Fig. 3 Solar abundances (Asplund et al. 2009, thick lines; the dashed lines connect the elements with even and with odd atomic number) compared with the photospheric abundances in G191−B2B (blue circles) and RE 0503−289 (red squares). Arrows indicate upper limits. Open symbols for Tc mark the detection threshold for the two stars and the triangle is a typical Tc abundance found in red giants (see text). |
| In the text | |
|
Fig. 4 Tc ionization fractions in our chemically homogeneous models for G191−B2B (top panel) and RE 0503−289 (bottom panel). |
| In the text | |
|
Fig. 5 Section of the STIS observations (gray) compared with synthetic spectra. Top: G191−B2B (blue, thin: Tc mass fraction 1.0 × 10⁻⁶, red, thick: 1.0 × 10⁻⁴). Bottom: RE 0503−289 (blue, thin: 1.0 × 10⁻⁵, red, thick: 1.0 × 10⁻⁴). The synthetic spectra are convolved with a Gaussian (FWHM = 0.01 Å and 0.06 Å for G191−B2B and RE 0503−289, respectively) to match the resolution of the observations. The strongest photospheric lines are identified. |
| In the text | |
|
Fig. 6 Photospheric abundances of the most heavy elements in our stratified models for G191−B2B (top panel) and RE 0503−289 (bottom panel). IG denotes a generic atom (including Ca, Sc, Ti, V, Cr, Mn, and Co). The respective solar abundances are indicated on the left and right side of the panels. The value for Tc is a typical abundance measured in red giants (see text). |
| In the text | |
Current usage metrics show cumulative count of Article Views (full-text article views including HTML views, PDF and ePub downloads, according to the available data) and Abstracts Views on Vision4Press platform.
Data correspond to usage on the plateform after 2015. The current usage metrics is available 48-96 hours after online publication and is updated daily on week days.
Initial download of the metrics may take a while.