Fig. 1
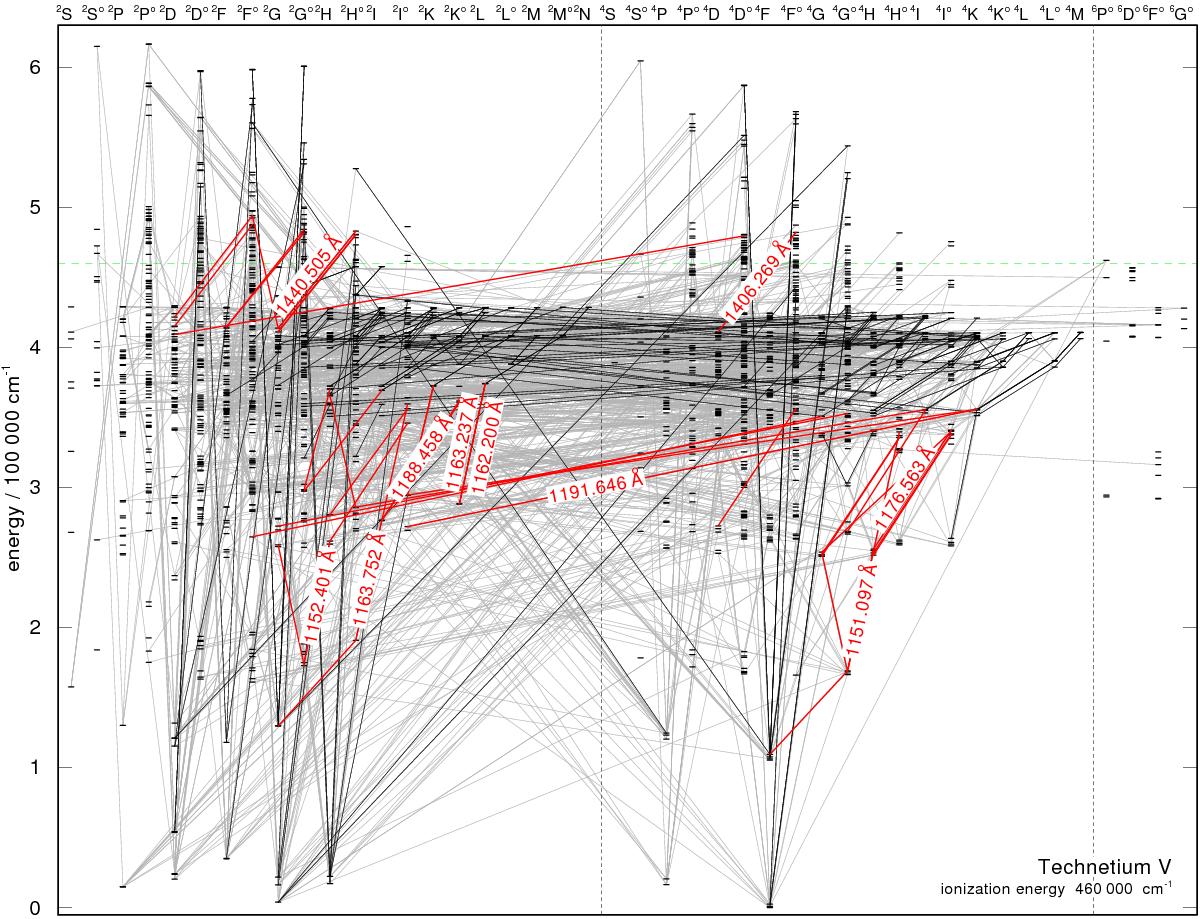
Partial Grotrian diagram (from left to right: doublet, quartet, and sextet electron systems) of our Tc v model ion. Horizontal bars indicate 1932 atomic levels, lines represent radiative transitions (thin, gray: 2117 lines with log gf ≥ 0.1; thin, black: 220 lines with log gf ≥ 1.0; thick, red: 45 lines in the 1150 Å ≤ λ ≤ 1780 Å interval with log gf ≥ 0.1). The ten lines with the largest gf values (0.77 ≤ log gf ≤ 1.10, the two strongest are Tc vλλ 1440.505,1163.237 Å) are labeled with their wavelengths.
Current usage metrics show cumulative count of Article Views (full-text article views including HTML views, PDF and ePub downloads, according to the available data) and Abstracts Views on Vision4Press platform.
Data correspond to usage on the plateform after 2015. The current usage metrics is available 48-96 hours after online publication and is updated daily on week days.
Initial download of the metrics may take a while.