Fig. 5
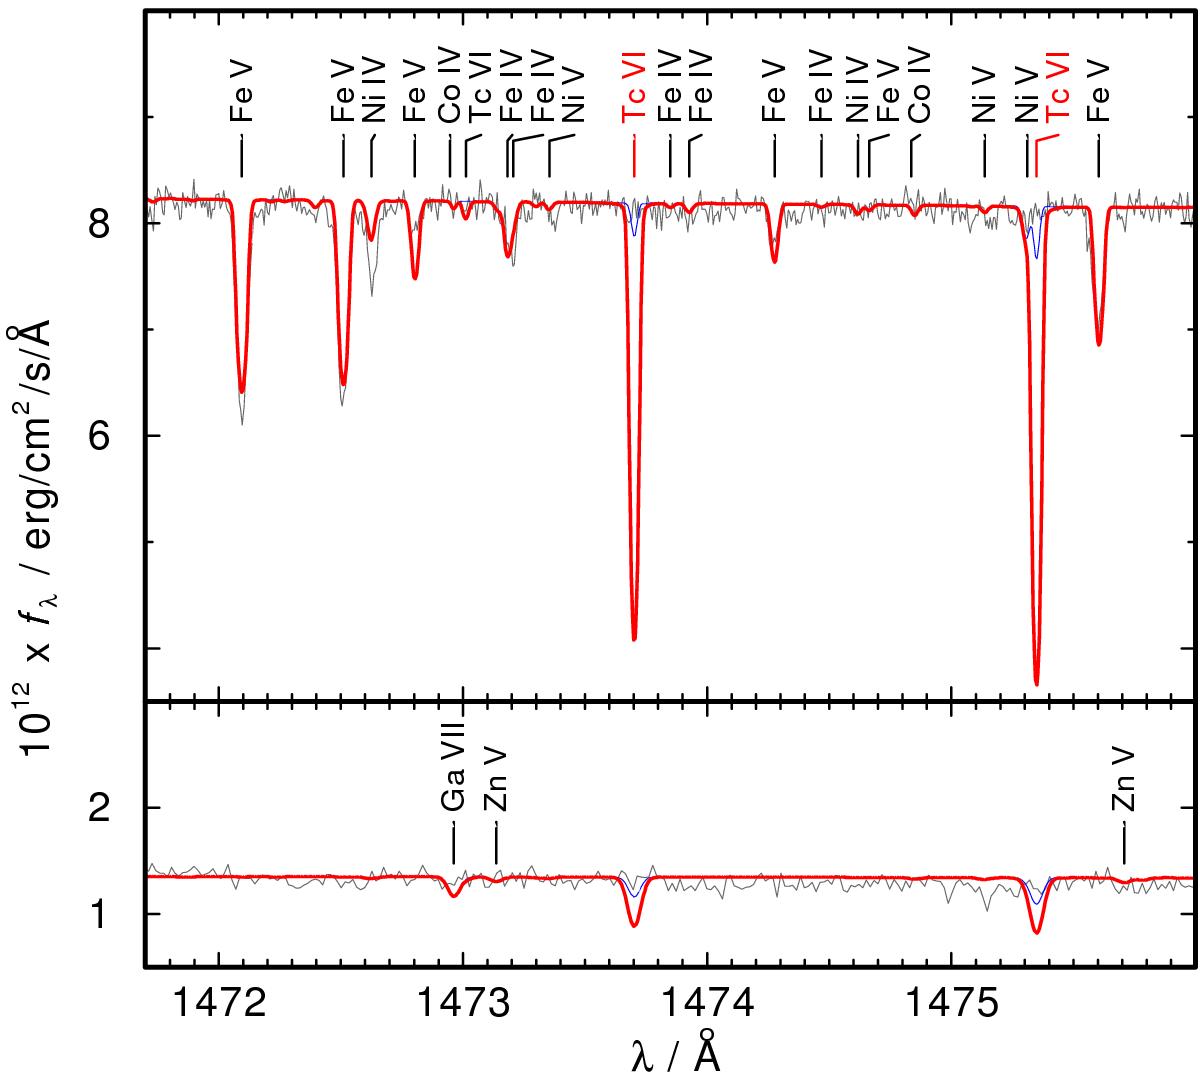
Section of the STIS observations (gray) compared with synthetic spectra. Top: G191−B2B (blue, thin: Tc mass fraction 1.0 × 10⁻⁶, red, thick: 1.0 × 10⁻⁴). Bottom: RE 0503−289 (blue, thin: 1.0 × 10⁻⁵, red, thick: 1.0 × 10⁻⁴). The synthetic spectra are convolved with a Gaussian (FWHM = 0.01 Å and 0.06 Å for G191−B2B and RE 0503−289, respectively) to match the resolution of the observations. The strongest photospheric lines are identified.
Current usage metrics show cumulative count of Article Views (full-text article views including HTML views, PDF and ePub downloads, according to the available data) and Abstracts Views on Vision4Press platform.
Data correspond to usage on the plateform after 2015. The current usage metrics is available 48-96 hours after online publication and is updated daily on week days.
Initial download of the metrics may take a while.