Fig. 3
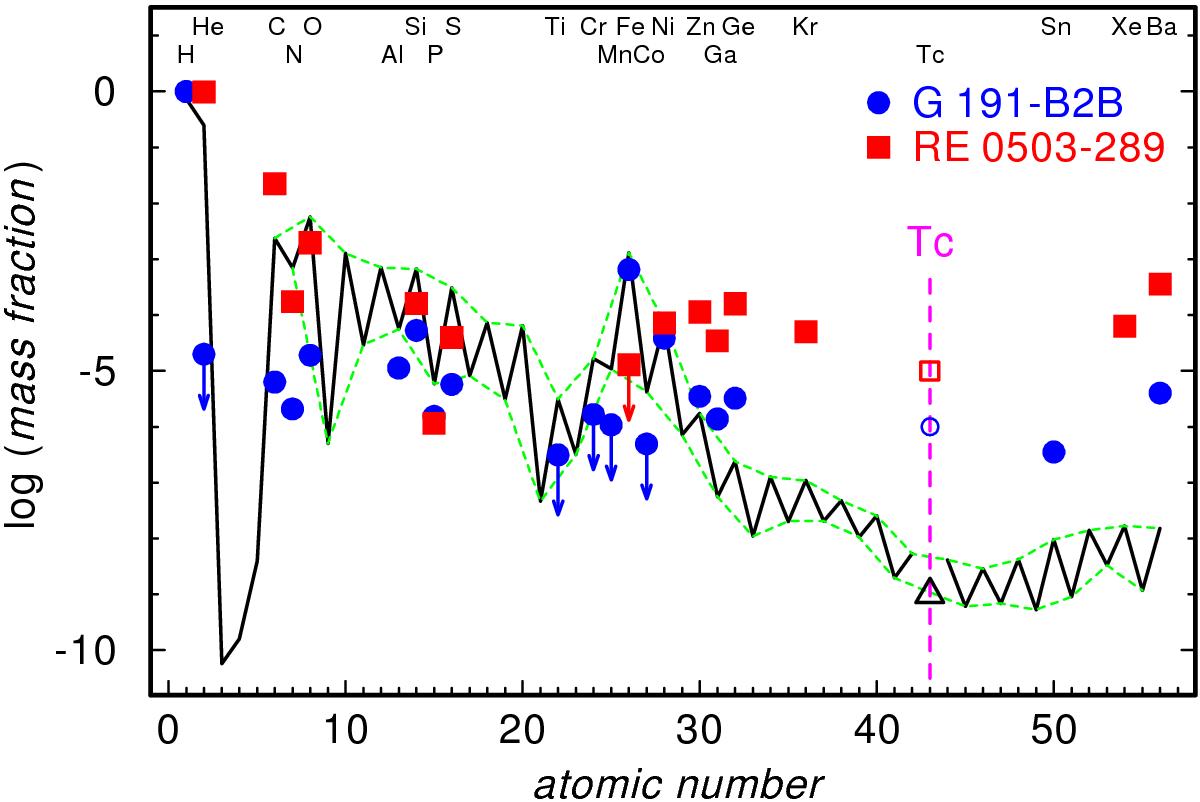
Solar abundances (Asplund et al. 2009, thick lines; the dashed lines connect the elements with even and with odd atomic number) compared with the photospheric abundances in G191−B2B (blue circles) and RE 0503−289 (red squares). Arrows indicate upper limits. Open symbols for Tc mark the detection threshold for the two stars and the triangle is a typical Tc abundance found in red giants (see text).
Current usage metrics show cumulative count of Article Views (full-text article views including HTML views, PDF and ePub downloads, according to the available data) and Abstracts Views on Vision4Press platform.
Data correspond to usage on the plateform after 2015. The current usage metrics is available 48-96 hours after online publication and is updated daily on week days.
Initial download of the metrics may take a while.