| Issue |
A&A
Volume 573, January 2015
|
|
|---|---|---|
| Article Number | A111 | |
| Number of page(s) | 9 | |
| Section | Extragalactic astronomy | |
| DOI | https://doi.org/10.1051/0004-6361/201424835 | |
| Published online | 07 January 2015 | |
Cold gas in group-dominant elliptical galaxies ⋆,⋆⋆
1 Harvard-Smithsonian Center for Astrophysics, 60 Garden Street, MS-50 Cambridge, MA 02138, USA
e-mail: This email address is being protected from spambots. You need JavaScript enabled to view it.
2 Observatoire de Paris, LERMA (CNRS UMR 8112), 61 Av. de l’Observatoire, 75014 Paris, France
3 Department of Physics and Astronomy, University of Victoria, Victoria, BC, V8W 2Y2, Canada
4 Department of Physics, Presidency University, 86/1 College Street, 700073 Kolkata, India
5 School of Physics and Astronomy, University of Birmingham, Edgbaston, Birmingham, B15 2TT, UK
Received: 19 August 2014
Accepted: 2 November 2014
Abstract
We present IRAM 30 m telescope observations of the CO(1–0) and (2–1) lines in a sample of 11 group-dominant elliptical galaxies selected from the CLoGS nearby groups sample. Our observations confirm the presence of molecular gas in 4 of the 11 galaxies at >4σ significance, and combining these with data from the literature we find a detection rate of 43 ± 14%, comparable to the detection rate for nearby radio galaxies, suggesting that group-dominant ellipticals may be more likely to contain molecular gas than their non-central counterparts. Those group-dominant galaxies which are detected typically contain ~ 2 × 10⁸ M⊙ of molecular gas, and although most have low star formation rates (<1 M⊙ yr-1) they have short depletion times, indicating that the gas must be replenished on timescales ~108 yr. Almost all of the galaxies contain active nuclei, and we note while the data suggest that CO may be more common in the most radio-loud galaxies, the mass of molecular gas required to power the active nuclei through accretion is small compared to the masses observed. We consider possible origin mechanisms for the gas, through cooling of stellar ejecta within the galaxies, group-scale cooling flows, and gas-rich mergers, and find probable examples of each type within our sample, confirming that a variety of processes act to drive the build up of molecular gas in group-dominant ellipticals.
Key words: galaxies: evolution / galaxies: star formation / galaxies: groups: general / galaxies: kinematics and dynamics / galaxies: general
Based on observations carried out with the IRAM 30 m telescope. IRAM is supported by INSU/CNRS (France), MPG (Germany), and IGN (Spain).
Spectra are only available at the CDS via anonymous ftp to cdsarc.u-strasbg.fr (130.79.128.5) or via http://cdsarc.u-strasbg.fr/viz-bin/qcat?J/A+A/573/A111
© ESO, 2015
1. Introduction
Despite the traditional picture of elliptical galaxies as red and dead, observations over the past decade have shown that a significant fraction of the population contain quantities of molecular and atomic gas which can fuel star formation or AGN activity. A molecular gas survey of the ATLAS3D sample, consisting of ellipticals within 42 Mpc, detects CO in 56/259 galaxies (Young et al. 2011), with the origin of the gas likely a mixture of acquisition during mergers and cooling of material ejected from the stellar population (Davis et al. 2011). Cool gas is also associated with the central dominant ellipticals of galaxy clusters (e.g., Edge 2001; Salomé & Combes 2003) and is generally believed to be the product of cooling from the hot, X-ray emitting intracluster medium (ICM). Ongoing star formation is observed in a number of central dominant ellipticals in cool-core galaxy clusters (Bildfell et al. 2008; Pipino et al. 2009; Donahue et al. 2011; McDonald et al. 2011), probably fuelled by material cooled from the ICM. Whereas cold gas in individual ellipticals typically forms rings or disks, the material around cluster-dominant galaxies is often found in extended filaments (e.g., Salomé et al. 2006; McDonald et al. 2011; Lim et al. 2012).
Galaxy groups, representing the intermediate mass range between individual galaxies and massive clusters, offer an interesting avenue for investigation. Many possess a hot (~107 K) intra-group medium (IGM) and among the (statistically incomplete) ensemble of nearby groups where a hot IGM has been confirmed via Chandra X-ray observations, >80% have central cool cores (Dong et al. 2010). The low velocity dispersions typical in groups make galaxy mergers more common than in clusters and reduce the efficiency of ram-pressure stripping, suggesting that a greater fraction of infalling cold-gas-rich galaxies are likely to reach the group core intact. Since both mergers and cooling flows appear to be common in groups, a significant fraction of the giant ellipticals commonly found at or near the centres of relaxed groups (hereafter referred to as group-dominant ellipticals) should contain cold gas.
The presence of molecular gas in group-dominant ellipticals is important to our understanding of feedback from active galactic nuclei (AGN). As in cool-core clusters, radiative cooling of the IGM is thought to be regulated by FR-I radio sources in the group-dominant ellipticals. In some cases cold gas is already known to be associated with AGN outbursts in groups, for example in NGC 315 (Ocaña Flaquer et al. 2010) or the well-known 100 pc disk of Hi gas and dust in NGC 4261 (Jaffe & McNamara 1994). Identification of reservoirs of molecular gas in a sample of group-central ellipticals has the potential to shed light on the origin of the gas, provide estimates of the mass available to fuel AGN, and help clarify the mechanisms of IGM cooling and AGN feedback.
We have therefore undertaken a programme of observations using the IRAM 30 m telescope with the goal of identifying the presence of CO in a sample of group-dominant ellipticals, determining what fraction of these systems contain molecular gas, and examining the relationship between cold gas, AGN, and group properties. In this paper we present our initial results.
To compute distances, we adopt a standard flat cosmological model, with Λ = 0.75 and a Hubble constant of 70 km s-1 Mpc-1. Our sample and observations are described in Sects. 2 and 3 respectively. Results are presented in Sect. 4 and discussed in Sect. 5.
2. Sample
Basic data for the group-dominant galaxies.
Representative samples of galaxy groups in the local Universe are relatively difficult to construct. Since groups contain only a small number of galaxies, optically-selected group catalogues typically include a significant fraction of uncollapsed systems and false associations caused by chance superpositions along the line of sight. X-ray selection, which confirms the presence of a gravitational potential capable of heating and retaining an IGM, is in principle more reliable. However, nearby X-ray samples selected from the ROSAT All-Sky Survey suffer from a bias toward centrally-concentrated systems (Eckert et al. 2011), and may not be representative of the general population, while samples drawn from the Chandra and XMM-Newton archives reflect the preference of observers toward luminous and unusual systems.
We draw our groups from the Complete Local-Volume Groups Sample (CLoGS, O’Sullivan et al., in prep.), which consists of 53 groups in the local Universe (D< 80 Mpc). The sample is based on the Garcia (1993) catalogue, which was selected via friends-of-friends and hierarchical clustering algorithms from the all-sky LEDA galaxy catalogue, complete to mB = 15. The goal of CLoGS is to determine whether these groups contain a hot IGM via X-ray observations, providing additional information on whether they are relaxed, virialized systems; to date ~70% of the sample has been observed by Chandra and/or XMM-Newton. The sample is limited to groups with declination >–30° to ensure coverage by the Giant Metrewave Radio Telescope (GMRT) and Very Large Array (VLA), so as to allow identification of active galactic nuclei and star-forming galaxies. The most K-band luminous early-type galaxy associated with the main peak of the galaxy density distribution is identified as the group-dominant galaxy.
CLoGS is intended to be a statistically complete survey of groups in the local volume, and thus provides an ideal sample in which to study the prevalence and origin of molecular gas in group-dominant galaxies. However, since this paper describes preliminary observations, the subsample discussed here is necessarily incomplete. For our initial list of targets, we selected group-dominant ellipticals that are either detected at 60 or 100 μm by IRAS (since far-infrared (FIR) emission suggests the presence of dust, which is a good indicator that cool gas may also be present), or which have been observed in the X-ray by Chandra or XMM-Newton (since an X-ray luminous IGM, if detected, should support cooling). This resulted in a list of 12 targets visible from the IRAM 30 m telescope, of which 11 were observed. The basic properties of each target galaxy are listed in Table 1.
3. Observations
The observations were carried out with the IRAM 30 m telescope at Pico Veleta, Spain, in two runs during May and August 2013. All sources were observed simultaneously in CO(1–0) and CO(2–1) lines, with the 3 mm and 1 mm receivers in parallel.
Molecular data and stellar mass of the four detected galaxies.
The broadband EMIR receivers were tuned in single sideband mode, with a total bandwidth of 4 GHz per polarization. This covers a velocity range of ~10 400kms-1 at 2.6 mm and ~5200 kms-1 at 1.3 mm. The observations were carried out in wobbler switching mode, with reference positions offset by 2′ in azimuth. Several backends were used in parallel, the WILMA autocorrelator with 2 MHz channel width, covering 4 × 4 GHz, and the Fourier Transform Spectrometer (FTS), covering 8 × 4 GHz.
We spent on average two hours on each galaxy, and reached a noise level between 1 and 3 mK (antenna temperature), smoothed over 30 km s-1 channels for all sources. Pointing measurements were carried out every two hours on continuum sources and the derived pointing accuracy was 3′′ rms. The temperature scale is then transformed from antenna temperature  to main beam temperature Tmb, by multiplying by 1.20 at 3 mm and 1.56 at 1.3 mm. To convert the signals to fluxes, we use S/Tmb = 5.0 Jy/K for all bands. At 2.6 mm and 1.3 mm, the telescope half-power beam width is 23′′ and 12′′ respectively. The data were reduced with the CLASS/GILDAS software, and the spectra were smoothed so that each line covers about ten channels in the plots.
We note that our observations reach sensitivities similar to that of the ATLAS3D sample. Young et al. (2011) smoothed their observations over 31 km s-1 channels and reached typical a noise level of 3 mK. While our sample extends to 80 Mpc, ATLAS3D only includes galaxies within 42 Mpc, so our slightly longer integrations lead to very similar limits on detectable gas masses; we find that our observations are typically able to detect molecular gas masses of M(H2) > 8 × 10⁷ M⊙, and >2.8 × 10⁷ M⊙ for systems within 45 Mpc, whereas the mean limit for the ATLAS3D sample is M(H2) > 2.3 × 10⁷ M⊙. The distribution of molecular gas masses and upper limits with distance appears comparable for the two samples. We therefore conclude that our observations can be directly compared with the ATLAS3D sample without introducing strong bias.
4. Results
4.1. CO detections
Out of the 11 galaxies observed, 4 were detected at >4σ significance (see Tables 1 and 2). All spectra are plotted in Fig. 1 with the same flux scale, with the exception of NGC 940, since its intensity is about 10 times larger than the others. A number of other CLoGS group-dominant elliptical galaxies have already been observed in CO (primarily as part of the ATLAS3D sample, see Table 1) and we include these systems to increase the diagnostic power of our subsample.
In total, over the 23 objects for which CO data are available, 10 are confirmed to contain molecular gas, giving a detection rate of 43 ± 14%. The detection rate for early-type galaxies in the ATLAS3D sample is 22 ± 3% (Young et al. 2011), suggesting that group-dominant galaxies may be more likely to contain CO, but with our current small sample, the difference is only significant at the ~1.5σ level. Completing observations of the CLoGS sample will improve the statistical power of our sample and allow us to determine whether this difference is truly significant.
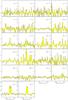 |
Fig. 1 CO spectra of the observed group-dominant galaxies. In each column, the left-hand panel is the CO(1–0), and right-hand panel the CO(2–1) lines. The velocity scale is relative to the redshift displayed in Table 1. The vertical scale is Tmb in mK. All spectra have been plotted to the same scale, except the CO-rich NGC 940 galaxy, at the bottom. |
4.2. CO luminosity and H2 mass
We have computed the molecular mass from the CO(1–0) flux, using  , with α = 4.6 M⊙ (K kms-1 pc2)-1, the standard factor for nearby quiescent galaxies like the Milky Way. The molecular gas masses are listed in Table 2 and the upper-limits in Table 3. We note that Young et al. (2011) adopted the same value of α when estimating MH2 for the galaxies observed in the ATLAS3D CO survey.
The average CO luminosity for the four galaxies detected is  K kms-1 pc2, corresponding to an average H2 mass of 16.7 × 10⁸ M⊙.
Since the beam size of our observations is typically smaller than the stellar extent of the galaxies, we cannot be certain that we are capturing the total mass of CO in each system. However, interferometric mapping of CO has shown that it is typically concentrated in the galaxy core, with a distribution exponentially declining with radius (Young & Scoville 1991). Mapping of 40 ATLAS3D galaxies with detected CO shows that in almost every case CO is only observed in the central 4 kpc of the galaxy, and only a handful of galaxies have CO extent >2 kpc (Davis et al. 2013). Comparing these values to the projected beam sizes in Table 1, we find that only five of our detections are close enough for CO to potentially extend beyond the 30 m beam. Of these, NGC 2768 has been mapped by the Plateau de Bure Interferometer, which showed that the 30 m mass estimate was accurate (Crocker et al. 2008), while for NGC 5044 we have adopted the ALMA interferometric mass estimate (David et al. 2014). Of the remaining three detected galaxies for which the 30 m might underestimate the molecular gas mass, NGC 2768 has been mapped by CARMA, which found a mass a factor of 1.6 larger than the 30 m estimate (Alatalo et al. 2013). We are therefore confident that for our sample, the IRAM 30 m observations should include the great majority of the molecular gas, with at most three galaxies having underestimated masses.
Upper limits on molecular gas mass for galaxies undetected in CO(1–0) and CO(2–1).
4.3. Star formation
The far infrared luminosities were computed from the 60 μm and 100 μm fluxes from IRAS, or when absent from the 24, 70 and 160 μm fluxes from Spitzer/MIPS. These flux ratios give the dust temperature, assuming a mass opacity of the dust at frequency ν, κν ∝ νβ, where β = 1.5. For galaxies with far infrared detections, the dust mass has been estimated as
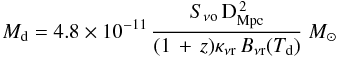 where Sνo is the observed FIR flux measured in Jy,
  the luminosity distance in Mpc, Bνr the Planck function at the rest frequency νr = νo(1 + z), and we use a mass opacity coefficient of 25 cm2 g-1 at rest frame 100 μm (Hildebrand 1983; Dunne et al. 2000; Draine 2003).
For those galaxies detected in the far infrared, we estimate the star formation rate SFR by the relation SFR = LFIR/ (5.8 × 10⁹L⊙) compiled by Kennicutt (1998). The gas consumption time scale can then be derived as τ = 5.8M(H2)/LFIR Gyr, where masses and luminosities are in solar units. These values are displayed in Table 4. We note that the depletion timescales only take account of the detected molecular gas, and that for Hi-rich galaxies such as NGC 1167 they will be an underestimate of the true gas depletion time. However, most of our targets are Hi-poor, and it is notable that the majority of them have small depletion time-scales, despite very low specific star formation rates (sSFR = SFR/M∗). Even the galaxies where only upper limits on molecular gas content are available typically have depletion times <109 yr. This indicates that, as expected, most of these group-dominant galaxies have formed the bulk of their stars in earlier star formation episodes.
Figure 2 shows the relation between far infrared and CO luminosities. The detected objects have a tendency to lie above the normal location for nearby spiral galaxies, which corresponds to a short depletion time-scale. Since most of the galaxies contain radio-luminous AGN (see Sect. 4.5) we might expect some contribution to FIR luminosity from nuclear activity. However, we see no clear correlation between radio luminosity and position in Fig. 2. NGC 5044, NGC 3665 and NGC 524, whose radio luminosities differ by a factor ~30, fall at similar locations relative to the depletion timescale relation for spirals. The two galaxies which fall further above the relation, NGC 315 and NGC 2768, have radio luminosities which differ by a factor ~5800. We therefore conclude that the AGN contribution to FIR luminosity has a minimal effect on the comparison with CO luminosity.
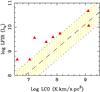 |
Fig. 2 Correlation between FIR and CO luminosities, for the CLoGS sample (filled red triangles). The dashed line represents a depletion time-scale of 2 Gyr, assuming a conversion factor α = 4.6 M⊙ (K kms-1 pc2)-1. The shaded regions represent the main location of nearby spiral galaxies (from Bigiel et al. 2008), within a factor 3 around the mean depletion time-scale of 2 Gyr. |
Star formation rates and depletion times.
Figure 3 shows the relation between stellar mass and SFR (for galaxies detected in the FIR). To estimate stellar masses, we determined galaxy colours from Sloan Digital Sky Survey ugriz and 2MASS JHK magnitudes, and used these to define the mass-to-light ratio of each galaxy from the models of Bell & de Jong (2001). The main sequence of star forming galaxies at z = 0 is indicated by the blue shaded region (from Wuyts et al. 2011). As expected, the galaxies of our sample mainly lie in the red sequence of quenched galaxies. However, a handful of the most rapidly star-forming approaching the Wuyts et al. relation, suggesting that their specific star formation rates are comparable with those of massive spirals. This is a surprising result for massive, group-dominant elliptical galaxies, but may indicate the importance of cold molecular gas, the fuel for star formation, in the development of these systems.
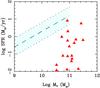 |
Fig. 3 Position of our sample galaxies in the SFR-stellar mass diagram. The blue shaded region indicates the main sequence of star forming galaxies at z = 0 (Wuyts et al. 2011). |
4.4. Group properties
For those systems which have high-quality X-ray data available, we can attempt to determine whether the molecular gas content of the group-dominant galaxy is related to the properties of any hot, X-ray emitting intra-group medium. The overlap with our molecular gas sample is imperfect; only 20 of the 23 galaxies for which CO data are available have high-quality Chandra or XMM observations (O’Sullivan & Ponman 2004; Nolan et al. 2004; Helsdon et al. 2005; Nagino & Matsushita 2009; Pellegrini 2011; Boroson et al. 2011, O’Sullivan et al., in prep.). One other galaxy, NGC 524, has been observed by Chandra, but only using the ACIS-S detector in 1/8 subarray mode, providing a very limited field of view unsuitable for examination of the properties of the group. However ROSAT data of sufficient quality to examine the gas content are available (Osmond & Ponman 2004). For these 21 systems we are able to determine whether hot, X-ray emitting gas is present as an intra-group medium (IGM), or as a smaller halo associated with the dominant galaxy.
We follow the scheme of Osmond & Ponman (2004) in differentiating between group and galaxy emission based on a cutoff in physical scale; systems whose diffuse X-ray emission extends <65 kpc are classed as galaxy halos, while more extended systems are considered to possess a true IGM. We further class systems with a significant decline in central temperature as having a cool core, indicating that radiative cooling has been more effective than any heating mechanisms over the recent history of the group. However, we note that this classification is dependent on the quality of the data available; fainter systems sometimes lack the necessary signal-to-noise ratio to allow measurement of the radial temperature profile. We find that hot gas is detected in 20 of the 21 systems for which data are available, and 14 of these reside in groups with an extended IGM; the remaining 6 only have small halos of hot gas associated with the central galaxy.
Of the 10 galaxies in which CO is detected, one (NGC 5127) has yet to be observed by XMM or Chandra. Only 4 of the remaining 9 galaxies are in groups with an extended IGM, and of these, only 2 are in systems with cool cores. Of the five galaxies with CO detections which do not reside in groups with an extended hot IGM, four possess galaxy-scale halos of hot gas, leaving only one galaxy detected in CO but with no hot gas detection. These results confirm that, as in more massive galaxy clusters, cold molecular gas is formed in a sizeable fraction of group-dominant ellipticals, and that it survives for significant periods of time despite the surrounding hot IGM.
4.5. Nuclear activity
Of the 23 galaxies with CO data, all but one appear to host radio and/or X-ray luminous active nuclei. For the 21 galaxies observed by Chandra or XMM, we base our identification of X-ray AGN either on our own analysis (O’Sullivan et al., in prep.) or on reports in the literature (Nolan et al. 2004; Pellegrini 2005; González-Martín et al. 2006; Boroson et al. 2011; Liu 2011). Sources are identified as likely AGN if they are coincident with the galaxy nucleus to within the spatial resolution of the X-ray data. In all but a handful of cases, the sources are confirmed to have power-law spectra, and those for which spectra are not available are all identified from Chandra data, whose 0.5′′ spatial resolution makes confusion with an extended source (e.g., a star-forming region) unlikely. We find that ≳70% (17/23) of the galaxies host nuclear X-ray sources (including NGC 524, whose AGN is detected in the limited field-of-view Chandra observation).
When identifying radio AGN, we primarily rely on high-resolution radio data to determine whether sources are coincident with the galaxy nucleus, and whether they are extended. The CLoGS sample was designed to match the sky coverage of the major VLA surveys, so 1.4 GHz continuum imaging from FIRST (Becker et al. 1995) and/or NVSS (Condon et al. 1993) is available for every galaxy. In general we use FIRST (spatial resolution 5.4′′ FWHM, equivalent to 0.5–2.0 kpc) to determine whether a source is likely to be an AGN, but draw flux measurements from NVSS, since its larger restoring beam (45′′ FWHM) makes it less prone to break up extended sources into separate components. In addition, we have deeper GMRT 610 MHz images (half-power beam-width HPBW = 5–6′′) for 13/23 galaxies.
Table 1 lists 1.4 GHz continuum fluxes for the galaxies. All but four of the galaxies are detected in this band. NGC 4697 has been imaged with sub-arcsecond resolution at 8.5 GHz by the VLA, confirming the presence of a weak nuclear source coincident with a Chandra X-ray source (Wrobel et al. 2008). NGC 940 is detected at low spatial resolution (HPBW = 2.7′) in a 2.38 GHz Arecibo observation (Dressel & Condon 1978). In both cases we estimate a 1.4 GHz continuum flux for the galaxies assuming a spectral index of 0.8. Only an upper limit on the 1.4 GHz continuum flux is available for NGC 5982, but GMRT 610 MHz observations (Kolokythas et al. 2014) confirm the presence of an unresolved source coincident with the galaxy nucleus. Lastly, while it is detected at 1.4 GHz, only low-resolution NVSS data are available for the post-merger starburst galaxy NGC 7252. Combining all available data, we find that only only NGC 3613 is undetected at radio frequencies, but that the low spatial resolution data available for NGC 940 and NGC 7252 does not allow us to separate a nuclear source from more extended star formation.
As a further test, we estimate the 1.4 GHz continuum flux density expected from star formation, based on the star formation rates calculated from the FIR luminosity in Sect. 4.3 and the L1.4 GHz: SFR relation of Bell (2003). Oosterloo et al. (2010) find that ~50% of nearby ellipticals (across a range of environments) contain a central continuum source, but that in galaxies containing Hi in their central regions, the radio flux is often consistent with the star-formation rate estimated from the FIR. While the radio luminosities of these star-forming systems identified by Oosterloo are lower than all but the weakest of our sources (1–31 × 1019 W Hz-1), it is possible that in some cases we could mistake star formation emission for an AGN. Of the 17 galaxies in our sample with FIR data, 12 have radio luminosities more than a factor of 5 greater than that expected from star formation, and are therefore clearly AGN-dominated. Of the remaining five, NGC 1060 and NGC 4697 have radio luminosities lower than expected from their SFR, but radio imaging confirms them both as AGN. The radio emission in NGC 1060 arises from small-scale AGN jets (Kolokythas et al. 2014), while in NGC 4697 the radio emission is clearly associated with the X-ray AGN (Wrobel et al. 2008). The third galaxy, NGC 524, has been shown to possess a central milliarcsecond-scale radio point (Filho et al. 2004) but Oosterloo et al. (2010) argue that a fraction of its radio emission arises from star formation. In the last two galaxies, NGC 7252 and NGC 940, we cannot confirm the presence of a radio-luminous AGN, and it is probable that a significant fraction of the radio emission arises from star formation. However, both galaxies have X-ray AGN and it seems possible that at least part of their radio luminosity arises from nuclear activity.
We therefore find that ≳87% of the galaxies (≳20/23) host radio AGN, and in all ≳95% host AGN of some sort. Only NGC 3613 lacks a detected AGN, and this may be explained by the fact that it has not been observed with the current generation of X-ray telescopes.
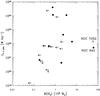 |
Fig. 4 1.4 GHz radio continuum luminosity plotted against molecular gas mass. AGN are marked with circles or arrows indicating 3σ upper limits in molecular gas mass, or 2σ limits in 1.4 GHz luminosity. The open triangle indicates the starburst galaxy NGC 7252. The galaxy with the greatest molecular gas mass among our new observations, NGC 940, is also labelled. |
Most of the detected AGN are low-luminosity systems; the 1.4 GHz radio continuum luminosities range from 1019–1024 W Hz-1, but only 8 galaxies host AGN with L1.4 GHz> 1022 W Hz-1. Figure 4 shows a comparison of molecular gas mass and 1.4 GHz radio luminosity for the galaxies in our sample. Although it is unclear whether there is any direct correlation between gas mass and radio power, there is a suggestion that a higher fraction of the most radio luminous galaxies are detected in CO. Excluding NGC 7252, 5 of the 8 galaxies (~63 ± 35%) with L1.4 GHz> 1022 W Hz-1 are confirmed to contain CO. The sample is too small for this to be a statistically significant result, but we note that altering the radio luminosity limit to 1021.5 or 1022.5 W Hz-1 does not change the result; in each case, a larger fraction of radio loud galaxies are detected in CO than are radio quiet galaxies. The detection rates are similar to that found for the TANGO I sample of radio galaxies selected to have L1.4 GHz> 1022.5 W Hz-1 (~40–60%, Ocaña Flaquer et al. 2010). The CO detection rate among our less radio luminous systems is only ~29 ± 14% (4/14), comparable to that seen among ellipticals in the ATLAS3D sample (~20%, Young et al. 2011).
5. Summary and discussion
We have presented our CO survey in 11 group-dominant elliptical galaxies, observed with the IRAM-30 m telescope. Four galaxies were detected at >4σ significance, and when we include data from previous observations we find a detection rate of 43 ± 14%. This result suggests that group-dominant ellipticals are more likely to contain molecular gas than the general population of early-type galaxies, but further observations are needed to improve the statistical power of the sample before it can be confirmed.
While CLoGS is designed to provide a statistically complete, representative sample, it is possible that the subset of group-dominant galaxies for which CO observations are currently available may be biased. For example, we selected targets for our CO observing program partly on the basis of FIR detection, since FIR-luminous galaxies are more likely to be CO-rich. Seven of our eleven targets are detected in the FIR, as are ten of the twelve galaxies covered by literature studies, though these were not selected to be FIR-bright. To determine whether the subsample studied in this paper is biased, in Fig. 5 we compare the distribution of 22 μm/K-band luminosities in our galaxies with that of the ATLAS3D sample. This provides an indicator of the degree of FIR emission normalized for differences in galaxy stellar mass. Figure 5 suggests that while there is a slight trend toward higher 22 μm luminosities in the group-dominant galaxies, our sample covers a similar range to ATLAS3D and is probably not seriously biased.
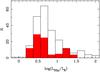 |
Fig. 5 Histograms of the ratio of 22 μm to K-band luminosity (in solar units) for the ATLAS3D sample (black) and our group-dominant galaxies (red). For clarity, the histogram for our sample has been scaled up by a factor of 4. |
Averaging over the 10 galaxies in the sample with measured CO masses, the mean molecular gas mass is found to be 1.2 × 10⁹ M⊙. However, the high gas masses in NGC 940 and NGC 7252 have a significant impact on the mean. If we exclude these galaxies we find a mean molecular gas mass of 2.0 × 10⁸ M⊙. Examining the FIR luminosity and SFR of the galaxies (and excluding the exceptionally Hi-rich system NGC 1167) we find that most have low star formation rates (<1 M⊙ yr-1) and short gas depletion timescales. This suggests either that the gas is replenished on fairly short timescales (~108 yr) or that we are catching the galaxies during a short period of weak star formation which will soon cease when the supply of cool gas is exhausted. The fraction of galaxies in which we see short depletion times suggests that ~30% of group-dominant galaxies are undergoing a period of star formation at any one time, suggesting that sufficient cold gas builds up to fuel star formation approximately three times per Gyr. In either case, our results indicate that the cold gas reservoirs of the galaxies are replenished on timescales of a few 108 yr.
While almost all the group-dominant galaxies contain AGN regardless of whether they contain molecular gas, the most radio luminous AGN appear to be more likely to reside in galaxies with larger masses of molecular gas. Previous studies have shown that the fraction of radio galaxies which contain molecular gas is higher than that for the general population of elliptical galaxies, suggesting that molecular gas contributes to the fuelling of the AGN. However, the accretion rates required to power the jets of even the most radio luminous galaxies in our sample are quite modest. Estimates of the total energy of AGN outbursts are available for NGC 193, NGC 315, NGC 4261 and NGC 5044 (Croston et al. 2008; David et al. 2009; O’Sullivan et al. 2011a,b; Bogdán et al. 2014) and range from ~1057 to ~2 × 1059 erg. Assuming an efficiency of 0.01 (cf., Babul et al. 2013), these imply accretion rates of ~0.5–15 × 10-4 M⊙ yr-1, with the total masses of gas accreted over the outbursts being ~0.1–20 × 106 M⊙. While NGC 4261 and NGC 193 are undetected in CO, both galaxies could contain masses of molecular gas sufficient to fuel a major outburst without violating the measured upper limits. Overall, our results are consistent with a scenario in which AGN outbursts are powered by accretion of relatively small quantities of cold gas, perhaps in the form of individual clouds, with galaxies containing a greater mass of cold material being more likely to be observed during the accretion of a cloud.
For those CLoGS groups confirmed to possess an extended hot intra-group medium with a cool core, the question arises of whether radiative cooling from the IGM could provide enough molecular gas to fuel nuclear activity in the central elliptical. David et al. (2014) examine this question for NGC 5044 and conclude that as long as more than ~5% of the gas cooling in the central 10 kpc of the IGM avoids being reheated, it will exceed the contribution from stellar mass loss and can support the observed AGN luminosity. Applying their approach to NGC 315, we estimate the classical mass deposition rate from radiative cooling of the IGM in the central 10 kpc to be ~0.6 M⊙ yr-1, roughly one tenth that observed in NGC 5044. We estimate a stellar mass loss rate of 0.17 M⊙ yr-1, based on a fit to the 2MASS K-band light profile, adopting a specific stellar mass loss rate of Ṁ∗/M∗ = 5.4 × 10⁻²⁰ s-1 (Renzini & Buzzoni 1986; Mathews 1989) and a K-band mass-to-light ratio of 0.8 M⊙/LK⊙ (Humphrey et al. 2006). This suggests a finer balance between stellar mass loss and IGM cooling than in NGC 5044, requiring that >30% of cooling IGM gas avoid being reheated if it is to dominate the fuelling of the AGN. However, both stellar mass loss and IGM cooling rates greatly exceed the likely rate of molecular gas accretion required to power the AGN.
Three possible origins for cold molecular gas in elliptical galaxies have been suggested; acquisition through gas-rich merger, cooling from gas ejected by the stellar population, and cooling from a surrounding IGM. Our sample includes the dominant ellipticals from groups with a range of properties, from loose groups with no detected hot IGM to X-ray luminous systems with cool cores, and we therefore expected to see evidence of all three mechanisms in our data. Davis et al. (2011) argue that gas produced by the stellar population should form a kiloparsec-scale rotating disk aligned with the stars, while gas brought into the system through mergers is likely to be misaligned or to form multiple tails, rings or disks. Examples of both cases may be present in our sample, for example the nuclear disk in NGC 4261, and the post-merger galaxy NGC 7252. By analogy with clusters (e.g., O’Sullivan et al. 2012), we might expect material cooled from an IGM to form filamentary structures (as in NGC 5044, David et al. 2011), with molecular gas perhaps forming a rotating disk in the galaxy core. Of the 14 systems in our sample in which a hot IGM is observed, 5 are detected in CO, suggesting that IGM cooling may be a fairly effective production mechanism. Higher resolution mapping of CO, and perhaps imaging of other warm and cool gas phases (e.g., Hα, Hi) would be required to determine whether the gas follows the morphology expected for IGM cooling.
Acknowledgments
We thank M. Brown for providing 1.4 GHz flux limits for two galaxies, and the anonymous referee for comments which have improved the paper. The IRAM staff is gratefully acknowledged for their help in the data acquisition. F.C. and S.H. acknowledge the European Research Council for the Advanced Grant Program Number 267399-Momentum. E.O’S. acknowledges support from the National Aeronautics and Space Administration through Chandra Award Number AR3-14014X issued by the Chandra X-ray Observatory Center, and A.B. from NSERC Canada through the Discovery Grant Program. A.B. would like to thank the LERMA group of l’Observatoire de Paris and the IAP for hosting his visits. This work made use of the NASA/IPAC Extragalactic Database (NED), and of the HyperLeda database.
References
- Alatalo, K., Davis, T. A., Bureau, M., et al. 2013, MNRAS, 432, 1796 [NASA ADS] [CrossRef] [Google Scholar]
- Babul, A., Sharma, P., & Reynolds, C. S. 2013, ApJ, 768, 11 [NASA ADS] [CrossRef] [Google Scholar]
- Becker, R. H., White, R. L., & Helfand, D. J. 1995, ApJ, 450, 559 [NASA ADS] [CrossRef] [Google Scholar]
- Bell, E. F. 2003, ApJ, 586, 794 [Google Scholar]
- Bell, E. F., & de Jong, R. S. 2001, ApJ, 550, 212 [NASA ADS] [CrossRef] [Google Scholar]
- Bigiel, F., Leroy, A., Walter, F., et al. 2008, AJ, 136, 2846 [NASA ADS] [CrossRef] [Google Scholar]
- Bildfell, C., Hoekstra, H., Babul, A., & Mahdavi, A. 2008, MNRAS, 389, 1637 [NASA ADS] [CrossRef] [Google Scholar]
- Bogdán, Á., van Weeren, R. J., Kraft, R. P., et al. 2014, ApJ, 782, L19 [NASA ADS] [CrossRef] [Google Scholar]
- Boroson, B., Kim, D.-W., & Fabbiano, G. 2011, ApJ, 729, 12 [NASA ADS] [CrossRef] [Google Scholar]
- Brown, M. J. I., Jannuzi, B. T., Floyd, D. J. E., & Mould, J. R. 2011, ApJ, 731, L41 [NASA ADS] [CrossRef] [Google Scholar]
- Combes, F., Young, L. M., & Bureau, M. 2007, MNRAS, 377, 1795 [NASA ADS] [CrossRef] [Google Scholar]
- Condon, J. J., Cotton, W. D., Greisen, E. W., et al. 1993, BAAS, 25, 1389 [NASA ADS] [Google Scholar]
- Condon, J. J., Cotton, W. D., Greisen, E. W., et al. 1998, AJ, 115, 1693 [NASA ADS] [CrossRef] [Google Scholar]
- Condon, J. J., Cotton, W. D., & Broderick, J. J. 2002, AJ, 124, 675 [NASA ADS] [CrossRef] [Google Scholar]
- Crocker, A. F., Bureau, M., Young, L. M., & Combes, F. 2008, MNRAS, 386, 1811 [NASA ADS] [CrossRef] [Google Scholar]
- Croston, J. H., Hardcastle, M. J., Birkinshaw, M., Worrall, D. M., & Laing, R. A. 2008, MNRAS, 386, 1709 [NASA ADS] [CrossRef] [Google Scholar]
- David, L. P., Jones, C., Forman, W., et al. 2009, ApJ, 705, 624 [NASA ADS] [CrossRef] [Google Scholar]
- David, L. P., O’Sullivan, E., Jones, C., et al. 2011, ApJ, 728, 162 [NASA ADS] [CrossRef] [Google Scholar]
- David, L. P., Lim, J., Forman, W., et al. 2014, ApJ, 792, 94 [NASA ADS] [CrossRef] [Google Scholar]
- Davis, T. A., Alatalo, K., Sarzi, M., et al. 2011, MNRAS, 417, 882 [NASA ADS] [CrossRef] [Google Scholar]
- Davis, T. A., Alatalo, K., Bureau, M., et al. 2013, MNRAS, 429, 534 [NASA ADS] [CrossRef] [Google Scholar]
- Donahue, M., de Messières, G. E., O’Connell, R. W., et al. 2011, ApJ, 732, 40 [NASA ADS] [CrossRef] [Google Scholar]
- Dong, R., Rasmussen, J., & Mulchaey, J. S. 2010, ApJ, 712, 883 [NASA ADS] [CrossRef] [Google Scholar]
- Draine, B. T. 2003, ARA&A, 41, 241 [NASA ADS] [CrossRef] [Google Scholar]
- Dressel, L. L., & Condon, J. J. 1978, ApJS, 36, 53 [NASA ADS] [CrossRef] [Google Scholar]
- Dunne, L., Eales, S., Edmunds, M., et al. 2000, MNRAS, 315, 115 [NASA ADS] [CrossRef] [Google Scholar]
- Dupraz, C., Casoli, F., Combes, F., & Kazes, I. 1990, A&A, 228, L5 [NASA ADS] [Google Scholar]
- Eckert, D., Molendi, S., Gastaldello, F., & Rossetti, M. 2011, A&A, 526, A79 [NASA ADS] [CrossRef] [EDP Sciences] [Google Scholar]
- Edge, A. C. 2001, MNRAS, 328, 762 [NASA ADS] [CrossRef] [Google Scholar]
- Filho, M. E., Fraternali, F., Markoff, S., et al. 2004, A&A, 418, 429 [NASA ADS] [CrossRef] [EDP Sciences] [Google Scholar]
- Garcia, A. M. 1993, A&AS, 100, 47 [NASA ADS] [Google Scholar]
- González-Martín, O., Masegosa, J., Márquez, I., Guerrero, M. A., & Dultzin-Hacyan, D. 2006, A&A, 460, 45 [NASA ADS] [CrossRef] [EDP Sciences] [Google Scholar]
- Helsdon, S. F., Ponman, T. J., & Mulchaey, J. S. 2005, ApJ, 618, 679 [NASA ADS] [CrossRef] [Google Scholar]
- Hildebrand, R. H. 1983, QJRAS, 24, 267 [NASA ADS] [Google Scholar]
- Humphrey, P. J., Buote, D. A., Gastaldello, F., et al. 2006, ApJ, 646, 899 [NASA ADS] [CrossRef] [Google Scholar]
- Jaffe, W., & McNamara, B. R. 1994, ApJ, 434, 110 [NASA ADS] [CrossRef] [Google Scholar]
- Kennicutt, Jr., R. C. 1998, ApJ, 498, 541 [NASA ADS] [CrossRef] [Google Scholar]
- Kolokythas, K., O’Sullivan, E., Raychaudhury, S., Ishwara-Chandra, C. H., & Kantharia, N. 2014 [arXiv:1402.5109] [Google Scholar]
- Lim, J., Ohyama, Y., Chi-Hung, Y., Dinh-V-Trung, & Shiang-Yu, W. 2012, ApJ, 744, 112 [NASA ADS] [CrossRef] [Google Scholar]
- Liu, J. 2011, ApJS, 192, 10 [NASA ADS] [CrossRef] [Google Scholar]
- Mathews, W. G. 1989, AJ, 97, 42 [NASA ADS] [CrossRef] [Google Scholar]
- McDonald, M., Veilleux, S., & Mushotzky, R. 2011, ApJ, 731, 33 [NASA ADS] [CrossRef] [Google Scholar]
- Nagino, R., & Matsushita, K. 2009, A&A, 501, 157 [NASA ADS] [CrossRef] [EDP Sciences] [Google Scholar]
- Nolan, L. A., Ponman, T. J., Read, A. M., & Schweizer, F. 2004, MNRAS, 353, 221 [NASA ADS] [CrossRef] [Google Scholar]
- Ocaña Flaquer, B., Leon, S., Combes, F., & Lim, J. 2010, A&A, 518, A9 [NASA ADS] [CrossRef] [EDP Sciences] [Google Scholar]
- Oosterloo, T., Morganti, R., Crocker, A., et al. 2010, MNRAS, 409, 500 [Google Scholar]
- Osmond, J. P. F., & Ponman, T. J. 2004, MNRAS, 350, 1511 [NASA ADS] [CrossRef] [Google Scholar]
- O’Sullivan, E., & Ponman, T. J. 2004, MNRAS, 349, 535 [NASA ADS] [CrossRef] [Google Scholar]
- O’Sullivan, E., Giacintucci, S., David, L. P., et al. 2011a, ApJ, 735, 11 [NASA ADS] [CrossRef] [Google Scholar]
- O’Sullivan, E., Worrall, D. M., Birkinshaw, M., et al. 2011b, MNRAS, 416, 2916 [NASA ADS] [CrossRef] [Google Scholar]
- O’Sullivan, E., Giacintucci, S., Babul, A., et al. 2012, MNRAS, 424, 2971 [NASA ADS] [CrossRef] [Google Scholar]
- Pellegrini, S. 2005, MNRAS, 364, 169 [NASA ADS] [CrossRef] [Google Scholar]
- Pellegrini, S. 2011, ApJ, 738, 57 [NASA ADS] [CrossRef] [Google Scholar]
- Pipino, A., Kaviraj, S., Bildfell, C., et al. 2009, MNRAS, 395, 462 [NASA ADS] [CrossRef] [Google Scholar]
- Renzini, A., & Buzzoni, A. 1986, in Spectral Evolution of Galaxies, eds. C. Chiosi, & A. Renzini, Astrophys. Space Sci. Lib., 122, 195 [Google Scholar]
- Sage, L. J., Welch, G. A., & Young, L. M. 2007, ApJ, 657, 232 [NASA ADS] [CrossRef] [Google Scholar]
- Salomé, P., & Combes, F. 2003, A&A, 412, 657 [NASA ADS] [CrossRef] [EDP Sciences] [Google Scholar]
- Salomé, P., Combes, F., Edge, A. C., et al. 2006, A&A, 454, 437 [NASA ADS] [CrossRef] [EDP Sciences] [Google Scholar]
- Serra, P., Oosterloo, T., Morganti, R., et al. 2012, MNRAS, 422, 1835 [NASA ADS] [CrossRef] [Google Scholar]
- Shulevski, A., Morganti, R., Oosterloo, T., & Struve, C. 2012, A&A, 545, A91 [NASA ADS] [CrossRef] [EDP Sciences] [Google Scholar]
- Struve, C., Oosterloo, T., Sancisi, R., Morganti, R., & Emonts, B. H. C. 2010, A&A, 523, A75 [NASA ADS] [CrossRef] [EDP Sciences] [Google Scholar]
- Wrobel, J. M., Terashima, Y., & Ho, L. C. 2008, ApJ, 675, 1041 [NASA ADS] [CrossRef] [Google Scholar]
- Wuyts, S., Förster Schreiber, N. M., van der Wel, A., et al. 2011, ApJ, 742, 96 [NASA ADS] [CrossRef] [Google Scholar]
- Young, J. S., & Scoville, N. Z. 1991, ARA&A, 29, 581 [NASA ADS] [CrossRef] [Google Scholar]
- Young, L. M., Bureau, M., Davis, T. A., et al. 2011, MNRAS, 414, 940 [NASA ADS] [CrossRef] [Google Scholar]
Appendix A: Comments on individual objects
NGC 1167 has a very large HI disk (Struve et al. 2010), and a large dust mass. The molecular gas derived from the detected CO emission is however modest. Given the usual exponential radial distribution of CO emission in galaxies (e.g., Young & Scoville 1991), it is not likely that we are missing some CO emission outside of the 7.8 kpc beam. The galaxy is currently active, hosting the compact steep spectrum radio source B2 0258+35, and shows signs of previous AGN outbursts in the form of large-scale (~10′/200 kpc) low surface brightness lobes (Shulevski et al. 2012).
NGC 2768 was already detected in the CO survey of SAURON galaxies (Combes et al. 2007) and mapped with Plateau de Bure (Crocker et al. 2008). The CO maps show that the molecular component lies nearly perpendicular to the optical major axis of the galaxy. This is obviously gas which has been recently accreted in a polar ring or disk, and could well come from some cooling filament.
NGC 4261 was observed with the James Clerk Maxwell Telescope (JCMT) by Jaffe & McNamara (1994) who reported the detection of CO(2–1) in absorption, located in a nuclear disk, with a peak absorption depth of 14 mK observed against a continuum level of 20 mK in the 1.3 mm band. However, later IRAM 30 m observations (Combes et al. 2007; Young et al. 2011) find no indication of CO in either absorption or emission. After re-reducing the IRAM observations, we find a continuum level of 40 mK in the 2.6 mm band and 14 mK in the 1.2 mm band, leading us to expect a continuum level in the JCMT data of 3 mK at 1.3 mm, in strong conflict with the JCMT results. We therefore adopt the IRAM 30 m upper limits on molecular gas content for NGC 4261.
All Tables
Upper limits on molecular gas mass for galaxies undetected in CO(1–0) and CO(2–1).
All Figures
|
Fig. 1 CO spectra of the observed group-dominant galaxies. In each column, the left-hand panel is the CO(1–0), and right-hand panel the CO(2–1) lines. The velocity scale is relative to the redshift displayed in Table 1. The vertical scale is Tmb in mK. All spectra have been plotted to the same scale, except the CO-rich NGC 940 galaxy, at the bottom. |
| In the text | |
|
Fig. 2 Correlation between FIR and CO luminosities, for the CLoGS sample (filled red triangles). The dashed line represents a depletion time-scale of 2 Gyr, assuming a conversion factor α = 4.6 M⊙ (K kms-1 pc2)-1. The shaded regions represent the main location of nearby spiral galaxies (from Bigiel et al. 2008), within a factor 3 around the mean depletion time-scale of 2 Gyr. |
| In the text | |
|
Fig. 3 Position of our sample galaxies in the SFR-stellar mass diagram. The blue shaded region indicates the main sequence of star forming galaxies at z = 0 (Wuyts et al. 2011). |
| In the text | |
|
Fig. 4 1.4 GHz radio continuum luminosity plotted against molecular gas mass. AGN are marked with circles or arrows indicating 3σ upper limits in molecular gas mass, or 2σ limits in 1.4 GHz luminosity. The open triangle indicates the starburst galaxy NGC 7252. The galaxy with the greatest molecular gas mass among our new observations, NGC 940, is also labelled. |
| In the text | |
|
Fig. 5 Histograms of the ratio of 22 μm to K-band luminosity (in solar units) for the ATLAS3D sample (black) and our group-dominant galaxies (red). For clarity, the histogram for our sample has been scaled up by a factor of 4. |
| In the text | |
Current usage metrics show cumulative count of Article Views (full-text article views including HTML views, PDF and ePub downloads, according to the available data) and Abstracts Views on Vision4Press platform.
Data correspond to usage on the plateform after 2015. The current usage metrics is available 48-96 hours after online publication and is updated daily on week days.
Initial download of the metrics may take a while.